

1. Introduction
From the 18th century to date, urbanization has been an important process all around the world and despite the apparent chaotic evolution of cities, many regularities in the spatial economy have been explained by considering economic factors only. This is typically the case of Zipf's law,Footnote 1 which is usually explained by a random productivity process of local economies and migrations between cities (Eeckhout, Reference Eeckhout2004). To describe deviation from this law, however, it seems necessary to introduce additional factors. For instance, how does one explain that Mexico City is much more than just twice the size of the second largest city in this country; is it the historical centralization of the political powers in that city or its unique market access to the world? This is the question addressed in this paper, which aims to better understand what explains urban primacy.Footnote 2 We find that democratic institutions are the main factor behind the concentration of a nation's urban population in the main city; trade liberalization and good market access are not significant.
Our research area is related to a vast literature. The agglomeration of the population in the nation's largest city has been explained by many mechanisms, often related to political institutions (Bates, Reference Bates1981; Lipton, Reference Lipton1977). In countries where urbanization goes hand in hand with industrialization, capital accumulation in the industrial sector can lead rent seeker governments to favor fiscal centralization and as a consequence, an agglomeration of the population in the largest city (Davis and Henderson, Reference Davis and Henderson2003). In states with extensive regulation, where licenses and permits are necessary for a myriad of activities (to start a business, to hire or to fire workers, to register property and so on), the decision to be near the administrative center is beneficial since it increases the probability of getting these authorizations. Such a probability can be a powerful determinant of location choice for multinational firms, which in turn attracts domestic firms and migrants. Furthermore, since bribes, red tape, or more generally corruption enable the obtaining of these rights, the centralization of power in the largest city is a “cash machine” for governments. Urban favoritism for the largest city may be a strategy to monopolize (or to polarize) the rent extracted by limiting the competition of bureaucrats and politicians located in other regions. Fiscal centralization not only pulls activities into the urban giants, it also pushes activities outside secondary cities. Indeed, when local governments have little power, this centralization limits urban planning de facto and also leads to a kind of resistance to urbanization.Footnote 3 Without the ability to integrate new migrants into the formal sector, there is a political fear of agglomerating people. The incidence of crime or revolt is higher in cities, and this may represent an incentive for weak local governments to discourage urbanization while on the contrary, strong central government can favor its urban giant.Footnote 4 Ades and Glaeser (Reference Ades and Glaeser1995) support this thesis and find that dictatorial governments have urban giants that are 50% larger than democratic governments.Footnote 5 This result however, raises many questions, the most important being: which kind of institutions are the most prone to urban bias?Footnote 6 Here we challenge the conclusion of Ades and Glaeser (Reference Ades and Glaeser1995) by working on countries colonized by European powers during the past 500 years. We focus on these countries because colonization has deeply modified economies and institutions in these countries, and while many consequences of this colonization have been analyzed in depth, the analysis in terms of urban economics is lagging behind.
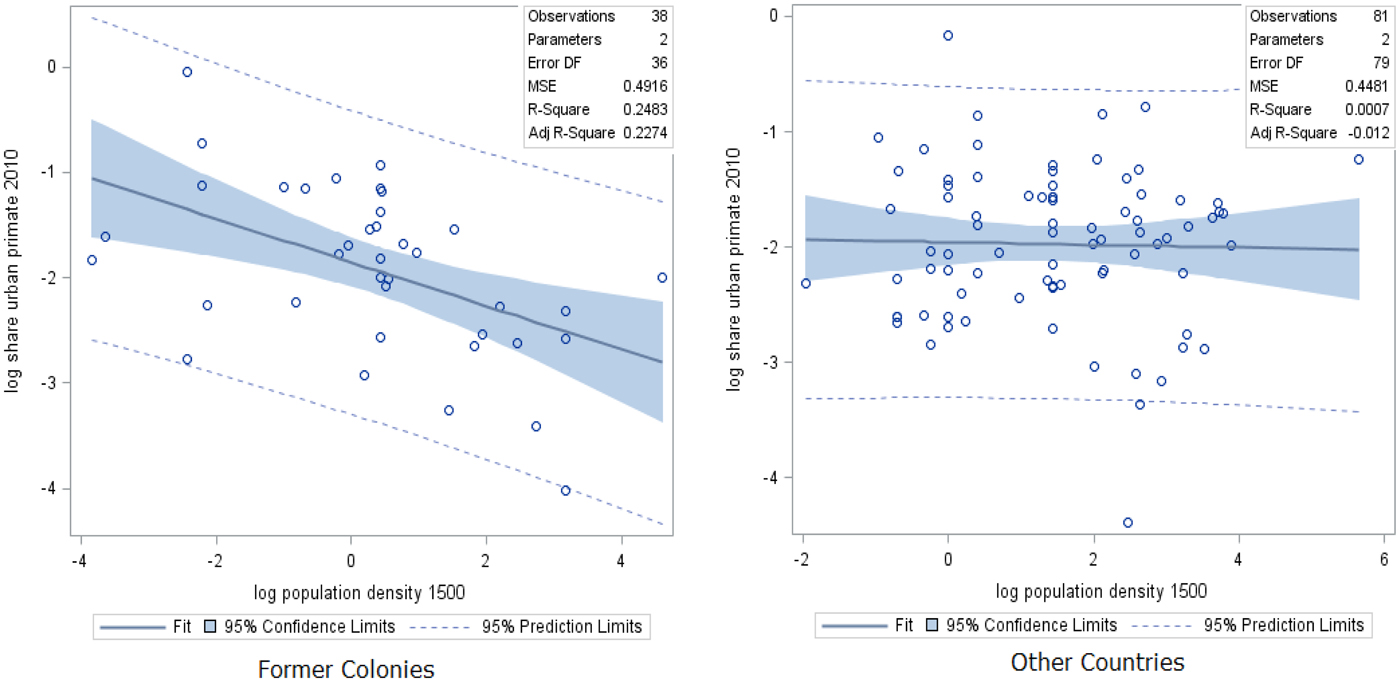
As illustrated by Figure 1, former European colonies that were relatively densely populated in the 1500s now have smaller central cities.Footnote 7 By considering, along with Acemoglu, Johnson and Robinson (Reference Acemoglu, Johnson and Robinson2002) (hereafter AJR), that density in 1500 was an indicator of prosperity fostering predatory behaviors and an indicator of the difficulty of settling, leading colonizers to set up extractive institutions, we come to the logical conclusion that these institutions have reduced concentration in the central metropolis.
Urbanization primacy in 2010 and density in 1500

The main finding of AJR is that economic growth is determined by political institutions and by nothing else, and in particular not by the geography and culture of nations. Are institutions also the unique determinant of urban primacy? While a vast literature on that subject explains the different size of cities by different kinds of political institutions, Krugman and Livas (Reference Krugman and Livas1996) proved that agglomeration can emerge without political favoritism:Footnote 8 bad market access can be a sufficient determinant. Trade restrictions can provide an advantage to one city, which becomes the platform for exports and catastrophically attracts all the population.Footnote 9 By contrast, trade liberalization, by providing market access to other cities, fosters the dispersion of activities. This conclusion has been much disputed; the link between the spatial economy of countries and trade integration is not monotonic, depending on the structure of the economy considered (weak congestion costs, a strong share of income spent on industrial goods, etc.), and good market access can also foster agglomeration in the largest city (Behrens and Robert-Nicoud, Reference Behrens and Robert-Nicoud2014; Krugman, Reference Krugman1991). Buenos Aires, London, Lagos, New York, and Seoul are clear examples where good market access to the world has boosted the size of cities. Faced with this theoretical debate, Ades and Glaeser (Reference Ades and Glaeser1995) found that a one-standard-deviation increase in the share of trade in GDP reduces the size of the main city by about 13%. Their analysis using alternative measures of trade integration (import duties and transportation spending) confirms this result; however, these variables are plagued with potential endogeneity bias, and their results using instrumental variables are not significant, which leads them to question reverse causality. Nitsch (Reference Nitsch2006), using geographic characteristics as an instrument for trade, is also skeptical about the role of economic geography on urban concentration.Footnote 10 In contrast, using a difference-in-difference strategy, Karayalcin and Yilmazkuday (Reference Karayalcin and Yilmazkuday2015) show that the Uruguay round of liberalization has reduced the relative size of mega-cities.
Our work differs from that literature in different aspects. First, since the direct measure of trade costs (e.g. tariffs used by Ades and Glaeser, Reference Ades and Glaeser1995) only represents part of trade friction, we use an indirect measure of economics integration based on trade flows. Regressing bilateral trade flows on distance between partnersFootnote 11 and aggregating these results using economic geography theory, we compute indicators of market access of these countries to the rest of the world. To our knowledge, this methodology, first introduced by Redding and Venables (Reference Redding and Venables2004) and used in various studies, has never been employed to study urbanization.
Second, since simple indicators of openness (e.g. exports as a percentage of GDP as used by Barrios et al.) introduce endogenous bias, we propose different instruments for market access such as the genetic distance between partners. The main idea of this instrumentation is that genetic distance is an exogenous indicator of past international migration and of international trade roads that can explain the current trading system. We also use many controls not available until recently, such as the differential between the intensity of night lights in the city and the intensity of lights in other cities obtained from satellite pictures within a country that allows us to capture spatial income differences.
Third, our results differ from the literature. We show that the rise and fall of mega-cities are mainly explained by institutions. The basic explanation follows the AJR thesis applied to urban economics. European colonialism led to the development of inclusive institutions in previously poor areas, which has favored agglomeration economies in urban giants. In contrast, introducing extractive institutions in previously prosperous areas has led to a dispersion of the population.
Section 2 presents our baseline empirical strategy, data and the first results. Section 3 presents an Instrumental Variables (IV) strategy and our results; section 5 describes the conclusions of the study.
2. Hypothesis, data and preliminary results
Empirical strategies
The aim of this paper is to study the causal impact of political institutions and international trade on the concentration of people in the biggest cities. However, before getting into the detail of these two determinants, let's first analyze the impact of institutions in general, considering all the formal and informal constraints and rules (the different codes of conduct, customs, laws, governance) that define political institutions and also the economic interactions necessary to long-distance trade) that causes the concentration of a nation's urban population in its first city. The most simple equation allowing to describe key identification issues of this question may be the following:Footnote 12

where u it is the population in the biggest metropolis,Footnote 13 f t are time-fixed effects that control for shocks affecting all individuals at the same time, f i are country-fixed effects aimed at capturing the characteristics of countries and I it the variable of institutions of the country i at the period t.
The main parameter of interest is α, the elasticity of agglomeration with respect to institutions. An unbiased OLS estimate for this parameter is obtained under the following assumption:

As is well known, when the covariance on the left hand side of this equation differs from zero, any of the three covariances on the right hand side is a source of bias. We discuss these three terms in turn in order to build our empirical strategy.
Concerning the first term, Cov(I i,t, f i), there are some reasons to consider that time-varying institutions depend on invariant country characteristics: for instance, natural resources or the level of development may have an impact on institutions. A related concern is the fact that the degree of urban primacy may influence institutions. Agglomeration economies may be higher in countries with urban giants and incomes generated from spillover, and/or pecuniary externalities can influence institutional change. This relationship is even more obvious concerning international trade: greater productivity in a particular sector (e.g. in finance) due to a concentration of activities in one place may influence institutions, at least the formal institutions, of a country. To analyze this bias, consider the following reversed causality between institutions and concentration:

From classic sociological theory to political modernization theory (Lerner, Reference Lerner1958; Lipset, Reference Lipset1959; Weber, Reference Weber and Runciman1909), there is a vast literature that defends this kind of relationship, considering that the urban structure affects political mobilization and political change (see Anthony (Reference Anthony2014) for a survey).
Using equation (1) without time effects to simplify, yields:

which allows us to rewrite the previous covariance as follows:

Hence the first origin of the bias comes from the variance of individual specific characteristics Var(f i), magnified by the elasticity of institutions with respect to the concentration of people β. The second channel of an upward bias is the correlation between individual characteristics that explain institutions and urban primacy (one can think respectively of culture and productivity), which lead one to conclude that such a bias is likely.Footnote 14
The other origins of bias in equation (2) are simple to understand: the covariance between institutions and temporal chocks (e.g. a global financial crisis), Cov(I i,t, f i), may differ from zero. Finally a covariance between institutions and the error term is the usual definition of endogeneity.
To reduce each of these problems, we first look for a lagged measure of institutions, or more precisely a measure of past institutional factors, that explains the sustainability of urban agglomeration before the industrial revolution. We choose the density in 1500 to approximate political institutions around that period. Density in 1500 is a good proxy of the current institutions according to AJR, who show that countries that were relatively rich in 1500 (density is considered as a proxy of economic prosperity) have fostered predatory behaviors and extractive institutions on the part of colonizers. We denote this variable I i,1500. We also use a proxy for the current state of political institutions by using the binary view of Acemoglu, Naidu, Restrepo and Robinson (Reference Acemoglu, Naidu, Restrepo and Robinson2017), who classify a country as democratic when different databases of political institutions (Freedom House, Polity IV) conclude as such, and dictatorial in the reverse case. This variable is denoted I it.
To take into account institutions that play a major role in explaining international trade, we regress bilateral trade flows on distance, GDPs and fixed effects and we use the estimates of fixed effects (which typically capture unobservable institutions that explain trade) and distance to build an indicator of market access (also called market potential), hereafter denoted as Ωit. To reduce the bias of an omitted variable, several variables of control are also introduced, including a proxy of the income gap between the biggest city and the rest of the country. While it seems trivial to say that people move from one place to another according to income difference, this variable has never been used to analyze urban primacy until now, mainly due to a lack of data at the regional level in developing countries. To approximate this spatial income gap in each country we use the differential between the intensity of night lights in the biggest city and the intensity of lights in the rest of the country from satellite pictures.Footnote 15 We also add classical controls (mainly climate data) for characteristics that are specific to country and time. All these controls are represented in the following equations by a vector C.
We start our analysis with a simple cross-sectional analysis (for the year 2010), running ordinary least squares on the following equation:

where I i,t−x represent past institutions when the indicator of density in 1500 is used (t − x = 1500, or the current level when we use a binary variable of democracy (t − x = 0) Many papers on the impact of institutions on urban primacy are based on this type of cross-sectional analysis. This naive regression presents all the aforementioned bias (and many more), and the problem of endogeneity due to omitting variables is particularly serious. However, the advantage of this estimation is that it allows us to include the invariant historical measure of institutions, I i,1500. This variable, which is also a measure of the urban primacy in 1500, helps us to understand the evolution of the spatial economy of nations over a long period of time. The coefficientα, if negative, indicates a dispersion of the population from the biggest city, i.e. a reversal in the attractiveness of the biggest city.
We then rely on the panel structure of the data to tackle endogeneity issues (due to omitting variables) by estimating:

This equation is analyzed through the lens of the Fixed Effect (FE) estimator over the period 1992–2010. This FE estimator is useful to reduce the endogeneity bias of omitted variables. However, the FE procedure is useless to obtain consistent estimates of the time-invariant proxy of institution I i,1500, since there is a perfect colinearity between fixed effects and institutions in 1500. As a result, the FE model constrains us to use exclusively time-varying institutions I it, which potentially introduce endogeneity from reversed causality.
To carry out inference on historical density, we thus use the Fixed Effects Filtered (FEF) estimator of Pesaran and Zhou (Reference Pesaran and Zhou2016). This estimation is in two steps, first a FE estimation is used to obtain coefficients of the time-varying variables and these estimates are used to filter out the time-varying effects. Then the residuals from the first step are averaged over time and computed as a dependent variable in a cross-section OLS estimation that includes a historical density and trade network.
To obtain an unbiased estimate of the elasticity of agglomeration with respect to the current institutions due to reverse causality, we propose two different Instrumental Variables (IV) estimations.
Data
Cities
Urban concentration over the period 1962–2010 is calculated by dividing the population in the biggest city by the total population using data from the United Nations World Urbanization Prospects. Data on density in 1500, u i,1500, come from the Clio-infra database on urban settlement sizes.Footnote 16 Data on urbanization in 1500 come from AJR.
To approximate the spatial urban-income gap Δit, we use the differential between the intensity of night lights in the biggest city and their intensity in other cities obtained from satellite pictures within a country. More precisely, we draw the spatial income gap between the biggest city and the remaining area of every country by using geomatics’ tools on night lights data provided by the National Oceanic and Atmospheric Administration (NOAA) from 1992 to 2010. NOAA processes the raw data collected by the United States Air Force Defense Meteorological Satellite Program. The approach used here aims to compute for each country the mean of night light intensity per square kilometer within areas where the largest city is located. For this purpose, we use Global Administrative Areas shapefiles, which provide an informative set of countries’ administrative boundaries at national and subnational level. We then cross them with the Natural Earth populated places database, which allows us to keep the most populated town location in every country. Night light rasters provided by the NOAA contain pixels to which are attributed digital numbers ranging from zero to 63, reflecting the brightness of the light. We used an average value for each pixel for the year in which two satellites collected the data. We compute, by country and year, the sum of pixel values for the biggest city and the sum of pixels for the rest of the country (to approximate light intensity outside the mega-city), and we divide these numbers by the surface areas as measured in square kilometers. The income gap is approximated by the difference between these two values. A lag of ten years is used to avoid reverse causality.Footnote 17 These data limit the period analyzed to 1992–2010.
Trade
The indicator of market access is built directly from economic geography theory. We modify market access of Redding and Venables (Reference Redding and Venables2004) to take into account the specificity of our research. The first step is to estimate the following trade gravity equation on bilateral exports, coming from COMTRADE, with individual fixed effects ($f_i^x, f_i^m$ ) and distance using a pseudo-maximum likelihood (PPML) estimator:Footnote 18

where bilateral trade costs τ ij take the following common specification:

With b ij, c ij, l ij are dummies characterizing bilateral trade barriers, respectively a border, past colony links and a common language; dist ij is a weighted measure of distance between cities. The literature usually uses two kind of distance, the simple distance between capitals and the distance between capitals weighted by the population of each country. Since simple distances between capitals represent poorly the geography of trade costs (in particular for large countries) and introduce bias in the estimation (e.g. over-estimation of the border effect), many articles routinely use the weighted measure, proposed by Head and Mayer (Reference Head and Mayer2002) and freely available from the GeoDist database of the CEPII. This distance between country i and j is calculated as follows:

where pop k and pop l are the population of the largest cities k and l. In brief, distances are weighted by the share of the biggest city in the total population, which is also our dependent variable. Thus it seems obvious that we cannot use such a measure to explain the concentration of the population in the nation's largest city without introducing endogeneity bias. We thus deviate from the literature by building our own measure using a weighting scheme based on internal distance between the capital and its cities:

where d ij is the distance in kilometres between the biggest cities i and j of each partner, and d i is the internal distance, i.e. the sum of the distance between the biggest city i and all other cities k belonging to the same country.
Last, an important part of the gravity equation making the link between theory and empiric are fixed effects $f_i^x$ and $f_j^x$
 (and their symmetric expressions) that allow us to obtain the predicted value of supply and market capacity.Footnote 19 Using these predicted values, with our weighted measure of bilateral distance, and estimates of the trade elasticity ε give market access:

The gravity equation is estimated in cross-sections to obtain a market access that varies over time Ωit.
To get rid of multicollinearity problems in estimating (7) and also to dispose of the fact that market potential can be endogenous to the size of mega-cities, we also use an historical measure of market access that is linked not to trade flow but to trade relationship: we calculate an indicator of networks, the so-called out-degree of trade, measuring the number of arcs pointing to partners with respect to the total number of nodes in the bilateral trade network of countries in 1900.Footnote 20
Institutions
Concerning institutions, one of the most recent dichotomous measure of democracy proposed by Acemoglu, Naidu, Restrepo and Robinson (Reference Acemoglu, Naidu, Restrepo and Robinson2017) (hereafter ANRR) is chosen. This index, running from 1960 to 2010, combines information from several sources including Freedom House and Polity IV databases. ANRR classify a country as democratic when several databases conclude as such. We also use the instrument of ANRR, who exploit regional waves of democratization and transitions to non-democracy as a source of exogenous variation in democracy. More precisely ANRR divide the world into seven regions, R i (where i is a country in Africa, East Asia and the Pacific, Eastern Europe and Central Asia, Western Europe and other developed countries, Latin America and the Caribbean, the Middle East, North Africa, and South Asia) and consider a dummy $D_{it_0}$ taking 1 when the country i is a democracy at the start of the period. Finally democracy in country i is influenced by democracy in the set of countries $J_i = \lcub {{i}^{\prime}:{i}^{\prime}\ne i,\; R_{{i}^{\prime}} = R_i,\; D_{{i}^{\prime}t_0} = D_{it_0}} \rcub$
 , which gives the following instrument of political governance:

In the words of ANRR, G it is the jack-knifed average of democracy in a region × initial regime cell, i.e. a distance-weighted average of democracy among “neighbors.” In order to avoid confusion, it is noteworthy that the “geographical components” of this instrument are radically different from the ones included in market access, geographical distance is not taken into account, and the neighborhood has a wide definition (e.g. every country in Africa).
For robustness checks regarding the variable of democracy, we also use the Polity 2 variable, from the Polity IV project and the Freedom House indices of political rights (PR) and civil liberty (CL).
The mortality rates of soldiers, laborers, and bishops used during colonial times used as an instrument of institutions, come from Albouy (Reference Albouy2012).
Other
Climate data, such as annual precipitation and temperature, come from CERDI's database.Footnote 21 Genetic distance data are used to instrument market access. These data, based on parts of the DNA that varies through random mutation and drift, come from Spolaore and Wacziarg (Reference Spolaore and Wacziarg2018), who use information on human micro-satellite variations (Pemberton et al., Reference Pemberton, DeGiorgio and Rosenberg2013) at the population (not country) level that are then matched with countries using ethnic composition data. More precisely, we use the ancestral genetic distance of Spolaore and Wacziarg (Reference Spolaore and Wacziarg2018), who match to populations as they were in 1500 ad.
First results
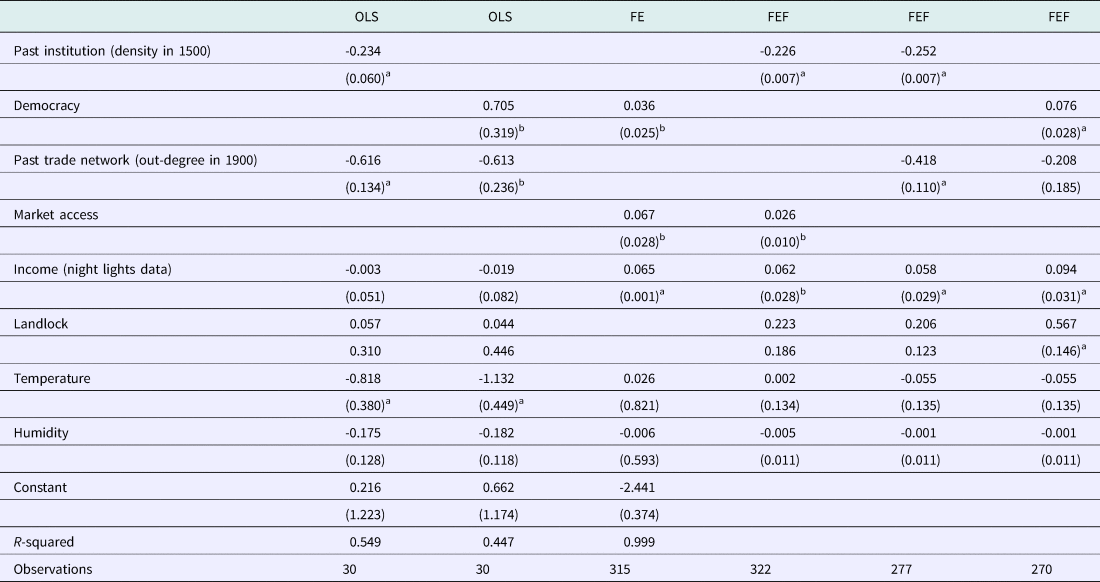
Table 1, columns (1) and (2), examines the cross-sectional patterns running ordinary least squares specification as described in equation (6) to illustrate the raw data patterns by regressing the log share of urban primacy in 2010 on two different indicators of democracy. In column (1), based on AJR, this indicator is the log of density in 1500. The bias of reversed causality is reduced by using this historical variable, but this advantage comes at a cost: the effects of the current political institutions cannot be analyzed. In column (2), we use the indicator of democracy of ANRR. These two columns make our results comparable with the literature on urban primacy that often uses cross-sectional data, but as discussed at length in Section 1, this specification may provide biased estimates of the variables of interest. Then, in columns (3), (4), (5) and (6), we exploit the panel structure of the data to tackle endogeneity issues by estimating equation (7) using the Fixed Effects (FE) and the Fixed Effects Filtered (FEF) models.
Urban reversal

Note: OLS estimator in columns (1) and (2), Fixed effects (FE) in column (3), Fixed Effects Filtered (FEF) in columns (4)–(6). All variables are in Log, a: significant at 1%, b: significant at 5%. Data on urban primacy are from World Development Indicators. Data on density in 1500 are from the Clio-infra database on urban settlement sizes, data on urbanization in 1500 from Acemoglu Johnson and Robinson (Reference Acemoglu, Johnson and Robinson2002). The binary variable of democracy comes from Acemoglu, Naidu, Restrepo and Robinson (Reference Acemoglu, Naidu, Restrepo and Robinson2017). The income gap between the biggest city and other cities is approximated by the differential between the intensity of night lights in the biggest city and the intensity of lights in other cities obtained from satellite pictures. Market access is computed from the estimation of a gravity equation using bilateral exportation from COMTRADE, distance and geographical variables from the CEPII. FE estimations include a full set of year and country fixed effects.
In column (1), the elasticity of urban primacy to past density is significant, high, and negative, revealing a reversion in the size of the urban concentration relative to its total population. On average a country that was twice more densely populated in 1500 is now a country where the share of its biggest city in the total population is 23% smaller than in other countries. We argue that the level of density in 1500, being a proxy of bad governance in the following centuries (countries densely populated in 1500 were richer, which was an incentive to set extractive institutions),Footnote 22 represents a repulsive force for the native population. This mechanism is consistent with the finding of Nunn and Puga (Reference Nunn and Puga2012) that rugged terrains were chosen in Africa because these places afforded protection to those being raided during the slave trade. The other side of this result is that countries with a weak concentration of the population in the nation's largest city in 1500 have benefited from inclusive institutions, such as the development of institutions of private property, which made the growth of urban giants profitable by developing agglomeration economies. As in the cross-section analysis, the impact of past density is still negative and significant (columns (4) and (5)) using the Fixed Effects Filtered (FEF) estimator of Pesaran and Zhou (Reference Pesaran and Zhou2016). Finally in columns (2), (3) and (6), the indicator of democracy is always significant and influences positively the population growth in the biggest city. All these results go against the finding of Ades and Glaeser (Reference Ades and Glaeser1995) that bad governance fosters population concentration at the top of the urban hierarchy.
In column (1), the past network of trade is also significant and negative. This negative impact of the past network of international trade may be related to the particular specialization of some countries, the first globalization has favored land tenets in Latin America for instance (Findlay and O'Rourke, Reference Findlay and O'Rourke2009) and thus urbanization was possibly not profitable for this elite. As a result this group may have put in place policies against cities and in particular against large cities that were a fertile land for industrialization. The introduction of fixed effects (column (5)) confirms this result, since the coefficient of the past network, albeit smaller, is still significant. However the introduction of an indicator of the current democracy raises some doubt about the validity of this variable of past network which is no longer significant (column (6)) and thus no longer used in the rest of the paper. Indeed this indicator of past network, reflect more past political institutions and networks between kings than between traders.
Columns (3) and (4) present the positive impact of market access. This result supports the thesis that a decrease in trade costs, at least in the first step of development, exacerbates regional disparities (Krugman, Reference Krugman1991). Activities and people tend to concentrate where there is a large market and the market is large where activities are concentrated; trade openness fosters this circular causality of agglomeration in the biggest city.
Regarding controls, the income gap approximated by the difference in night lights between the biggest cities and other cities has the expected positive impact.
The negative impact of temperature in the cross-section analysis (columns (1) and (2)) may be driven in some countries by the indirect effect of new technologies such as air conditioning or large investment infrastructures (e.g. dams) that have improved conditions of life in many cities that were initially inhospitable. Once individual fixed effects are introduced capturing the heterogeneity of countries on these aspects, temperatures are no longer significant (columns (3)–(6)).
3. The IV strategy
The main drawback of the previous analysis concerns the reverse causality of trade and political institutions, indeed, as discussed in section 2, political institutions may be influenced by the spatial economy and furthermore international trade often depends on the performance of the biggest city. To take into account these links, we propose a two-stage least squares (2SLS) estimation strategy, with a “zero-stage” to find suitable instruments for these institutions in the first stage. This 2SLS identification strategy with a zero-stage is inspired by Docquier et al. (Reference Docquier, Lodigiani, Rapoport and Schiff2016).
Two-step SLS identification strategy with a zero-stage
The zero-stage is based on the finding that the mortality rate faced by settlers is a good instrument of the current institution. Since this proposition has stirred up questions (Albouy, Reference Albouy2012),Footnote 23 we also take a more contemporaneous variable by using the regional waves of democratization and transitions to non-democracy as an instrument (this is the instrument used by ANRR, already described in the previous section).
Denoting H i the historical mortality rates of soldiers, laborers, and bishops during colonial times (source: Albouy, Reference Albouy2012), I i, the indicator of democracy (source: ANRR), and G i, the measure of political governance based on waves of democratization (defined by equation (10)), we estimate the following equation:

This equation is simply an extension of AJR using a different dependent variable (democracy instead of expropriation risks), and an additional variable, G i. Finally while AJR estimates this equation for one year only, we regress it on each year of our sample which gives an historical-geographical instrument, denoted $\widehat{{H_{it}^g}}$ that varies over time.Footnote 24 Democracy effect identification will come from this time-varying predicted instrument $\widehat{{H_{it}^g}},$
 which captures discretionary variations in institutions. It reflects the exogenous component of the democracy variable as a consequence of distant past shocks in the contemporaneous institutions trend.
Concerning the endogeneity of trade, we follow the same strategy by using the ancestral genetic distance (Spolaore and Wacziarg, Reference Spolaore and Wacziarg2018). The relevance condition asserting that this variable is a good instrument to predict the endogenous dependent variable, i.e. trade, is well established. For instance, Guiso, Sapienza and Zingales (Reference Guiso, Sapienza and Zingales2009) find that genetic distance is a good proxy for cultural proximity, which impacts on the trust between two partners and then on trade exchanges. Spolaore and Wacziard (Reference Spolaore and Wacziarg2018) present clear evidence that genetic distance acts as a temporary barrier to the diffusion of innovations and development. Giuliano, Spilimbergo and Tonon (Reference Giuliano, Spilimbergo and Tonon2014) find that genetic distance is a good proxy for transportation costs between countries because of international migrations. The variation in genetic distance is partially explained by international migrations, which partially cause international trade via business and social networks. See for instance Rauch and Trindade (Reference Rauch and Trindade2002) on the impact of ethnic networks on trade. Market access is then regressed on ancestral genetic distance, denoted $D_i^g$ , for each year of our sample, which enables us to get an instrument of market access based on genetic distance that varies over time, hereafter denoted $\widehat{{D_{it}^g}}$
 .
The first step explains the variation of institutions by using the exogenous variable of institutions defined in the previous step:

and in a similar way the variation over time in market access:Footnote 25

In this first step,$\; \varsigma$ is estimated from within changes in $\widehat{{H_{it}^g}}$
 which, by depending on the distance-weighted average of democracy among neighbors, is an exogenous variable of the current urban primacy. In a similar way ϱ is not estimated by cross-country difference but by internal changes in genetic distance between partners, which is certainly not a function of trade. Individual fixed effects in the two equations are particularly important in controlling for differences in the level of development. The term C it represents three variables of control that are used in the two stages: precipitation, temperature, and a gap in the intensity of night lights.
Finally the second step uses the predicted values of the “historical-geographical” institutions and of the predicted value of “genetic” market access as follows:

Results of the zero-stage
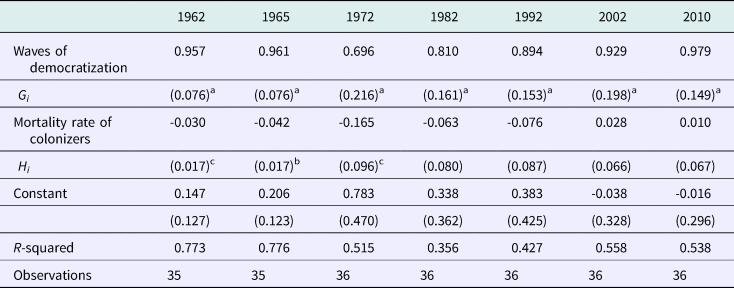
Table 2 confirms the positive impact of waves of democratization on institutions. Results are less clear concerning the effect of the mortality rate of colonizers. Coefficients associated with the colonizers’ mortality rate are significant only between 1962 and 1972, which may suggest an erosion of the bad influence of past colonial institutions. However, additional estimations provided in the online appendix show that the initial result of ARJ is verified over the whole period when we use a different indicator of democracy, i.e. the mortality rate of colonizers explains institutions as measured by the Polity 2 index of democracy, the Freedom House indices of political rights (PR) and civil liberty (CL). It is also noteworthy that this indicator of mortality has a small impact on institutions in comparison with waves of democratization.Footnote 26
Democracy (ANRR index), zero-stage

Note: OLS estimator. Mortality rate variable is in Log, a: significant at 1%, b: significant at 5%. The mortality rate of colonizers (in log) comes from Albouy (Reference Albouy2012). Data on democracy are from Acemoglu, Naidu, Restrepo, Robinson (Reference Acemoglu, Naidu, Restrepo and Robinson2017), denoted ANRR in the title of this table, and instrumented with their instrument based on waves of democratization.
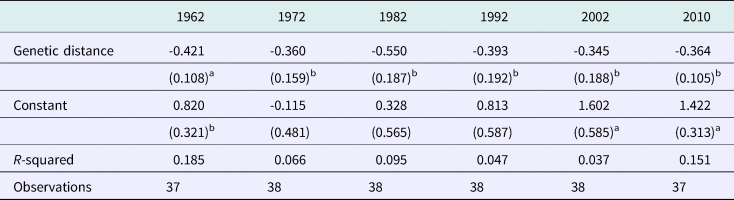
In Table 3 we present some of the zero-stage of market access. Throughout the period we find a negative impact of genetic distance on market access.
Market access, zero-stage

Note: OLS estimator. All variables are in Log, a: significant at 1%, b: significant at 5%. Data on genetic distance in 1500 are from Spolaore and Wacziarg (Reference Spolaore and Wacziarg2018). Market access is computed from the estimation of a gravity equation using bilateral exportation from COMTRADE, distance, and geographical variables from the CEPII.
Results of the first stage
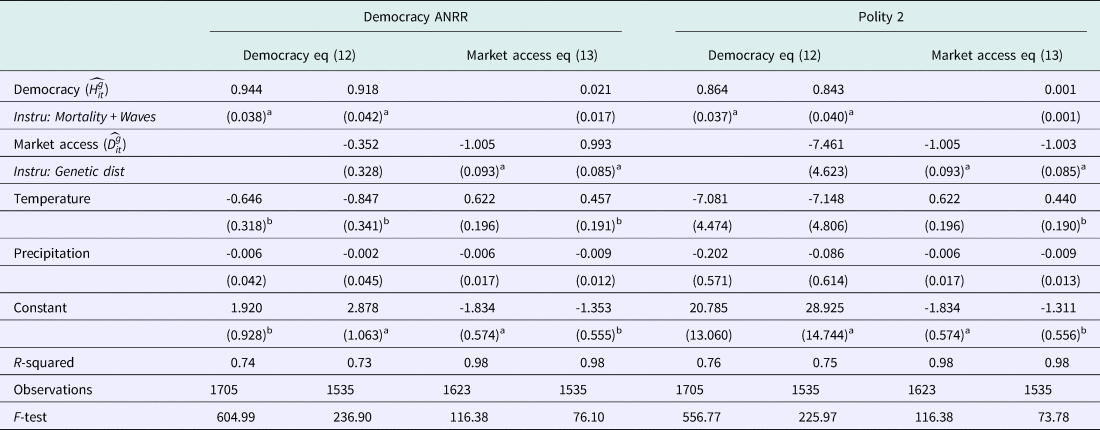
Table 4 (column (1)) presents the first stage described by equation (12). As expected, our historical and geographical instrument, based on mortality rates and on waves of globalization, significantly explains the level of democracy. This first stage confirms the different results obtained by AJR and ANRR. The coefficients on the instrument variables are highly significant. We present the F-test statistics that reject the joint null effect hypothesis of these IVs and they are above 10, the threshold proposed by Staiger and Stock (Reference Staiger and Stock1997). As a robustness check we also run an estimation by excluding the mortality rate in the zero-stage, and thus by using an instrument in this first step only based on the waves of democratization. We do not report this estimation since the results are almost identical (we find a coefficient of 0.871 with a Robust Standard Error (RSE) of 0.052).
Democracy and trade, first stage

Note: 2SLS procedure, a: significant at 1%, b: significant 5%. Market access is computed from the estimation of a gravity equation using bilateral exportation from COMTRADE, distance and geographical variables from the CEPII. This market access is instrumented using genetic distance in 1500 from Spolaore and Wacziarg (Reference Spolaore and Wacziarg2018). Data on democracy are from Acemoglu, Naidu, Restrepo, Robinson (Reference Acemoglu, Naidu, Restrepo and Robinson2017) and instrumented with their instrument, denoted ANRR, based on waves of democratization and with the mortality rate of colonizers provided by Albouy (Reference Albouy2012). All estimations include time effects and individual fixed effects.
Column (3) presents the first stage regressing market access on its instrument with various controls (see equation (13)). As required, the instrument of trade openness based on genetic distance significantly explains market access. This result confirms, in a different way, the main finding of Giuliano, Spilimbergo and Tonon (Reference Giuliano, Spilimbergo and Tonon2014) that genetic distance captures transportation costs between countries.
Columns (2) and (4) propose a simple test to verify that there are no other problems of endogeneity in this strategy by analyzing whether market access explains the current level of democracy. Indeed the causal link of globalization on democracy has been much discussed by economists and political scientists (e.g. Milner and Mukherjee, Reference Milner and Mukherjee2009) and not directly addressed in this paper until now. Our result confirms the finding of this literature that trade openness does not explain the process of democratization (when adequate IV are used).
Column (3) shows that the instrument of market access has no impact on institutions, while column (4) shows that the instrument of institutions does not impact on market access.
Columns (5), (6), (7) and (8) present exactly the same specification with a different measure of democracy. We use the variable Polity 2 instead of the democracy variable of ANRR. Results are not affected by this change.
Results, second stage
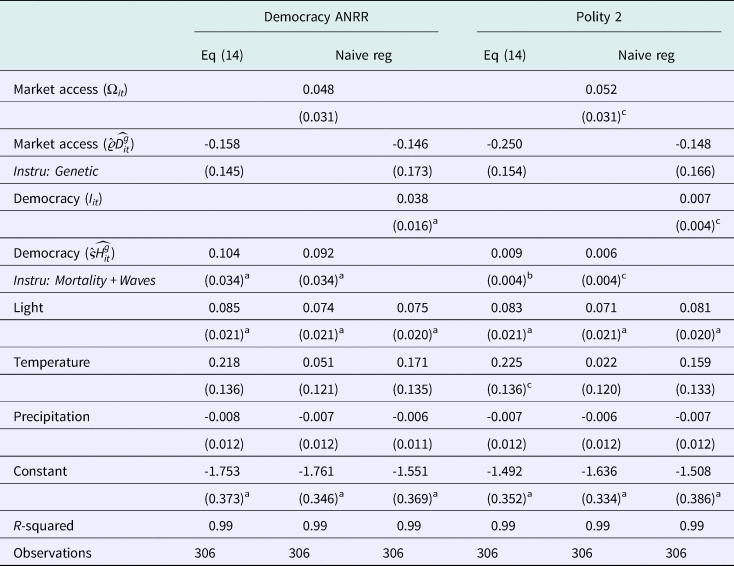
Table 5 (column (1)) shows the results obtained by estimating the second stage described by equation (14). Column (2) presents a “half-naive” estimation, where democracy is instrumented but market access is not. Column (3) presents the symmetrical estimation, where market access is instrumented while democracy is not.
Trade, institutions and urban primacy

Note: 2SLS procedure, a: significant at 1%, b: significant at 5%, c: significant at 10%. Market access is computed from the estimation of a gravity equation using bilateral exportation from COMTRADE, distance and geographical variables from the CEPII. This market access is instrumented using genetic distance in 1500 from Spolaore and Wacziarg (Reference Spolaore and Wacziarg2018). Data on democracy are from Acemoglu, Naidu, Restrepo, Robinson (Reference Acemoglu, Naidu, Restrepo and Robinson2017) and instrumented with their instrument, denoted ANRR, based on waves of democratization and with the mortality rate of colonizers provided by Albouy (Reference Albouy2012). All estimations include time effects and individual fixed effects.
In all estimations reported in Table 5, whatever the specification used, we find that the indicator of democracy, instrumented by past mortality rates and by waves of democratization, favors agglomeration in the biggest city.Footnote 27 These results indicate that the negative impact of democracy found by Ades and Glaeser (Reference Ades and Glaeser1995) and Henderson and Wang (Reference Henderson and Wang2007) may be due to a lack of control and/or to endogeneity bias. Another possibility, which is more interesting, is that there is something specific in our sample of countries. Ades and Glaeser (Reference Ades and Glaeser1995) for instance consider a sample of 70 countries without considering the history of these states. Our analysis is slightly different, since we focus our research exclusively on countries colonized by Europeans 500 years ago, following the arguments of AJR and of many historians that the long-run effects of colonization are still unclear. As a result, it is possible that countries not colonized by Europeans have developed institutions that shape their economic geographies differently.
Concerning the second hypothesis, market access is never significant, which reveals how the previous results arrived at without controls on time-varying institutions and without an exogenous measure of trade openness were misleading. This is in accordance with the skeptical view of Ades and Glaeser (Reference Ades and Glaeser1995) and Henderson and Wang (Reference Henderson and Wang2007) about the impact of international trade on the urban pattern. The same estimations are done in columns (4), (5) and (6) but with the variable Polity 2 and based on the first step of columns (5) and (6) of Table 4. The estimation of equation (14) in column (4), which is the most careful estimation correcting for the endogeneity of market access and of institutions, provides the same result as column (1).Footnote 28
Discussions
The link between urban planning and institutions studied here is binary (dictatorship versus democracy), which makes our paper more easily comparable to the literature. However, political regimes are richer than this simple binary difference suggests, and many interesting results are certainly hidden by this presentation. This is well summarized by Duranton (Reference Duranton2008), who wrote that “this type of explanation [i.e. Ades and Glaeser (Reference Ades and Glaeser1995)] implicitly assumes fairly strong state institutions able to tax their countryside and redistribute the proceeds to the primate city. On the contrary, it may be argued that undemocratic and unstable regimes are weak and favor primate cities by default.” In an online appendix,Footnote 29 we briefly develop this discussion. We find that in democratic states, the political regime has no role, whatever the urban pattern. In contrast, in countries with weak dictatorship and with an urban giant, more democracies foster the development of the largest city, maybe by “default,” as argued by Duranton (Reference Duranton2008).
Another discussion that may be interesting before concluding concerns the robustness of our result regarding the econometric used here. The previous results are based on a linear functional relationship and on strong assumptions regarding the IV strategy. The combination of non-random selection into the process of democratization and the omission of non-linear relationships can bias estimates. We thus lead different non-parametric estimations (see our online appendix) which confirms the results obtained so far: that urban primacy has been promoted by democratic regimes.
Conclusion
Institutions and first cause matter, rather than trade, in explaining the relative fall of the biggest cities in former European colonies. Our analysis documents the negative effects of bad governance on the current level of urbanization. We find that the reversal in urban primacy is due to past institutions related to colonization. Bad governance and extractive institutions inherited from colonization have reduced the population growth of the biggest city in many countries.
Regarding the literature, we have improved the analysis on different aspects by working with panel data (e.g. the analysis of Ades and Glaeser (Reference Ades and Glaeser1995) is in cross-section only), by using new controls (e.g. satellite data on night lights, market access measures) and new instruments (settlers’ mortality rates, waves of democratization) to explain urban primacy. All our different strategies (using OLS, IV, matching techniques) lead to the same conclusion: democracy in former European colonies has favored cities at the top of the urban hierarchy. As a result, we do not share the conclusion of Ades and Glaeser (Reference Ades and Glaeser1995), who wrote that what “was true in Rome, 50 bce, is still true in many countries today”: on the contrary, we document that dictatorship is no longer a force of agglomeration in the biggest cities of our sample. This result has concrete consequences: it means that in many countries where democratic institutions are improved, we can forecast a more significant growth of the biggest city than what has been predicted until now with major implications for infrastructure, public health, sanitation, productivity, and inequality.
Author ORCIDs
Fabien Candau, 0000-0003-3989-1157.
Acknowledgements
We thank Elisa Dienesch, Geoffroy Guepie, Charles Régnacq, Julie Schlick and many conference and seminar participants, especially Antonio Accetturo for its discussion at the 13th Meeting of the Urban Economics Association (New York City, Columbia University), for their valuable comments.