


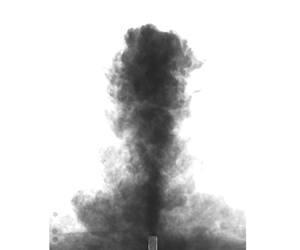





1. Introduction
Turbulent fountains occur widely in engineering and geophysical applications, for example, heating, ventilation and air conditioning systems in large buildings (Lin & Linden Reference Lin and Linden2005), brine discharge from desalination plants (Pincince & List Reference Pincince and List1973) and the dynamics of cumulus cloud tops (Turner Reference Turner1966). A comprehensive review of fountains in nature can be found in Hunt & Burridge (Reference Hunt and Burridge2015). Typically, a fountain is formed when dense fluid is ejected vertically upwards from a localised source into a lighter ambient fluid or when less dense fluid is injected downwards into heavier ambient fluid. The opposing buoyancy (as a result of a density difference between the source and the ambient fluids) causes the flow to slow down until the mean momentum is reduced to zero at some terminal height. The flow then reverses and collapses around the inner flow. While returning, the ambient fluid is entrained into the fountain, which causes the flow to dilute. The focus of this paper is to experimentally investigate the entrainment of ambient fluid and the dilution of scalar concentration in the fountain top, and their dependence on the source Froude number,  $Fr_o = W_o/\sqrt {(g\rho ^{\ast } r_o)}$ at a sufficiently large Reynolds number,
 $Re_o = 2 W_o r_o/\nu _o$. Here,
 $W_o$ is the source velocity,
 $r_o$ is the pipe radius, g is the gravitational acceleration,
 $\nu _o$ is the kinematic viscosity of the source fluid and
 $\rho ^{\ast } = (\rho _a-\rho _o)/\rho _a$. The subscripts ‘
 $o$’ and ‘
 $a$’ refer to the source and the ambient fluids, respectively.
Following the seminal study by Turner (Reference Turner1966), several theoretical models have been proposed describing the time-averaged behaviour of a forced fountain as consisting of an inner upflow and an outer counterflow (McDougall Reference McDougall1981; Bloomfield & Kerr Reference Bloomfield and Kerr2000; Carazzo, Kaminski & Tait Reference Carazzo, Kaminski and Tait2010; Mehaddi et al. Reference Mehaddi, Vaux, Candelier and Vauquelin2015). Surprisingly, barring McDougall (Reference McDougall1981), none of the models have accounted for the entrainment of ambient fluid into the fountain top (also referred to as the ‘cap’). There is strong evidence from experimental (Lin & Linden Reference Lin and Linden2005), numerical (Devenish, Rooney & Thomson Reference Devenish, Rooney and Thomson2010; Williamson, Armfield & Lin Reference Williamson, Armfield and Lin2011) and theoretical studies (Debugne & Hunt Reference Debugne and Hunt2016) that the entrainment into the cap is not negligible when estimating the bulk entrainment of volume flux in a turbulent fountain.
A number of experimental studies have investigated the entrainment in a fountain-like flow developing above a density interface. Such a flow is typically generated when a localised source of lower density is ejected vertically upwards within a stratified (often two-layer) environment of higher density. The entrained volume flux is inferred by measuring the time derivative of the interface height (see Baines (Reference Baines1975), Kumagai (Reference Kumagai1984) and Cardoso & Woods (Reference Cardoso and Woods1993) for full details). Although such flows have a fountain-like behaviour, their entrainment is clearly affected by the stratification, which tends to flatten the turbulent structures responsible for the entrainment. Shrinivas & Hunt (Reference Shrinivas and Hunt2014) carried out an analytical study to model the complex problem of turbulent entrainment across an interface due to the localised impingement of a shear flow (e.g. jet, plume or fountain). On the other hand, Baines (Reference Baines1975) studied entrainment in turbulent fountains that developed in a homogeneous environment. They performed experiments by ejecting a dense saline solution upwards to form a fountain in an initially uniform aqueous medium. More recently, Burridge & Hunt (Reference Burridge and Hunt2016) modified the technique of Baines (Reference Baines1983) to measure the entrainment by a saline turbulent fountain developing in a uniform fresh water environment. Burridge & Hunt (Reference Burridge and Hunt2016) deduced the net volume flux entrained by the fountain,  $Q_E$, as the difference between the measured outflow volume flux and the source volume flux
 $Q_o$ in the plane of the source, where the return flow ceases to interact with the rising core of the fountain.
There are other studies in the literature that used point-based measurements of velocity and temperature/density in a turbulent fountain to understand velocity–temperature/density correlations, Reynolds stresses and the balance of mean momentum and turbulent kinetic energy equations (Cresswell & Szczepura Reference Cresswell and Szczepura1993; Addona, Chiapponi & Archetti Reference Addona, Chiapponi and Archetti2021). For instance, Cresswell & Szczepura (Reference Cresswell and Szczepura1993) reported that the effect of negative buoyancy is mainly seen in the mean flow gradients, thereby altering the turbulence field indirectly. They also presented a statistical description of a turbulent fountain as consisting of a potential core surrounded by a growing shear region; a cap region of large-scale pulsating flow where generation of turbulence due to buoyancy is significant; and finally an annular counterflow region that is akin to a buoyant plume. A similar finding has been reported by Addona et al. (Reference Addona, Chiapponi and Archetti2021), who analysed the turbulent kinetic energy, the velocity skewness and the Reynolds stresses of the fluctuating velocity in a turbulent forced fountain. They found that the turbulent kinetic energy is maximum at  $z/z_{ss} \sim 1$ (where
 $z_{ss}$ is the steady height of the fountain), suggesting that the maximum production of turbulence takes place near the base of the fountain top, where the inner flow meets the pulsating fountain top.
Few studies have investigated the entrainment in the cap region of fountain-like flows (Lin & Linden Reference Lin and Linden2005; Devenish et al. Reference Devenish, Rooney and Thomson2010). Typically, the amount of ambient fluid entrained through the fountain top ( $Q_{top}$) is calculated as the difference between the volume flux supplied to the cap by the inner flow (
 $Q_{in}$) and that leaving the fountain top in the outer counterflow (
 $Q_{out}$), i.e.
 $Q_{top} = Q_{out} - Q_{in}$. This is graphically represented in figure 1(a), where
 $Q_{in}$ and
 $Q_{out}$ are the volume fluxes of the inner and outer flows estimated at the base of the cap. Using this approach, Devenish et al. (Reference Devenish, Rooney and Thomson2010) found that
 $Q_{top}/Q_{in} = 1\text {--}3$ over the investigated range of Richardson number (
 $Ri = - {1}/{Fr_o^{2}}$) in a large eddy simulation study of a plume that evolved in a stratified medium, which at a later stage behaves as a fountain. These values differed from those reported by Lin & Linden (Reference Lin and Linden2005) (i.e.
 $Q_{top}/Q_{in} = 0.5\text {--}0.8$) for a turbulent fountain in a steady two-layer stratification. Devenish et al. (Reference Devenish, Rooney and Thomson2010) reported that the discrepancy is primarily due to volume fluxes being measured at different
 $z$-locations in the fountain. A possible reason for the above discrepancy could be the ambiguity about the base location of the fountain top.
(a) Time-averaged morphology of a fountain top. (b) Instantaneous snapshot of a turbulent fountain (fresh water injected vertically downwards into a tank of saline water) and (c) the corresponding velocity and scalar fields obtained via particle image velocimetry and PLIF measurement techniques.

Irrespective of the above differences in different studies, it is clear that  $Q_{top} \sim Q_{in}$ as observed in the above experimental studies. This re-emphasises the point that neglecting fountain-top entrainment in the mathematical models will lead to an imbalance of momentum and buoyancy fluxes, and the counterflow remains relatively undiluted. Such models will predict a higher concentration of contaminant in the downstream section of a fountain flow. To further demonstrate this point, we present a heuristic calculation to illustrate how neglecting the local entrainment in the cap region (
 $Q_{top}$) leads to a large error in the global entrainment. Using the results of Burridge & Hunt (Reference Burridge and Hunt2016) for
 $Fr_o > 2.0$,
 $Q_E/Q_o = 0.77 Fr_o$ over the range of
 $Fr_o$ investigated in this study. Here,
 $Q_{o}$ is the source volume flux at the nozzle exit. In the numerical simulations of a flush-mounted turbulent fountain in the range
 $Fr_o \in [4, 24]$, Awin (Reference Awin2021) reported that
 $Q_{top}/Q_{o} \propto Fr_o$. Combining the results of Burridge & Hunt (Reference Burridge and Hunt2016) and Awin (Reference Awin2021), we find the ratio
 $Q_{top}/Q_{\rm E} \sim {O}(1)$, and is independent of
 $Fr_o$. This calculation clearly shows that
 $Q_{top}$ is a major contributor to
 $Q_{\rm E}$, and should not be ignored when modelling the global entrainment in a turbulent fountain.
In a recent study, Debugne & Hunt (Reference Debugne and Hunt2016) proposed a phenomenological model for fountain-top entrainment taking into account the role of rise-height fluctuations in engulfing ambient fluid into the cap. They adopted a framework wherein the rise-height fluctuations are incorporated into the entrainment model through periodical ‘filling’ and ‘draining’ half-cycles, during which the fountain top grows and collapses, respectively. The associated time period of the cycle is taken to be the time scale of large eddies forming on the scale of the inner-flow radius at the base of the cap (Burridge & Hunt Reference Burridge and Hunt2013). Further, Debugne & Hunt (Reference Debugne and Hunt2016) assumed a hemispherical morphology of the cap in their model, as shown in figure 1(a). Finally, in an attempt to scale entrainment in the fountain top at different  $Fr_o$, Debugne & Hunt (Reference Debugne and Hunt2016) defined a local Froude number
 $Fr_z$ as the ratio of inertial and buoyant forces at a given location;
 $Fr_z$ is defined as
 \begin{equation} Fr_z = \frac{W_m}{\sqrt{r_m b_m}}, \end{equation}
where  $W_{m}$,
 $r_{m}$ and
 $b_m$ represent the characteristic velocity, width and buoyancy defined in terms of the volume flux
 $Q$, momentum flux
 $M$ and the integral buoyancy
 $B$ of the inner flow as
 \begin{equation} \left.\begin{gathered} Q = \int_{0}^{r_{in}} 2{\rm \pi} r W \,{{\rm d}}r; \quad M = \int_{0}^{r_{in}} 2{\rm \pi} r W^{2} \,{{\rm d}}r;\quad B = \int_{0}^{r_{in}} 2{\rm \pi} r b \,{{\rm d}}r; \\ W_m = M/Q; \quad r_m = Q/M^{1/2}; \quad b_m = BM/Q^{2}, \end{gathered}\right\} \end{equation}
where  $b = g({(\rho _a - \rho )}/{\rho _a}) = g({C}/{C_o})$. Here,
 $\rho$ and
 $C$ are functions of
 $r$, with
 $C_o$ being the source concentration. Further, it should be noted that, throughout this paper, we are using the integral buoyancy (
 $B$) instead of the buoyancy flux as commonly used in the literature.
In order to select a suitable value of  $Fr_z$ at the base of the fountain top, Debugne & Hunt (Reference Debugne and Hunt2016) used the argument that a large eddy with size similar to the width of the inner flow (
 $2r_m$) at the base of the fountain top will reverse when the gravitational force on the eddy exceeds its momentum. Based on this argument, the height at which the flow tips over is given by
 $W_{m} = \sqrt {2r_m b_m}$, which results in
 $Fr_z = \sqrt {2}$ as per (1.1). A similar idea was developed by McDougall (Reference McDougall1981), who considered the base of the fountain top to be the height at which the local conditions in the inner flow correspond to
 $Fr_z = \sqrt {2}$. A similar result was reported by Mingotti & Woods (Reference Mingotti and Woods2016), who found that
 $Fr_z \sim 1$ at the mean height of a particle-laden turbulent fountain in its single-phase limit. It should be noted here that the model put forth by Debugne & Hunt (Reference Debugne and Hunt2016) is a simplified picture of the energetics in the cap region but nevertheless provides a scaling that seems to work well but that
 $Fr_z \approx \sqrt {2}$ is an approximate value. Further, their model does not consider the effect of entrained ambient fluid on the maximum height of the fountain. It is easy to see that the entrainment in the cap decreases the momentum of the inner flow and, therefore, the height at which the large eddy tips over may not truly correspond to
 $Fr_z = \sqrt {2}$. Nevertheless, using a value of
 $Fr_z = \sqrt {2}$ for the base of the fountain top and the model of vortical engulfment, Debugne & Hunt (Reference Debugne and Hunt2016) found that
 $Q_{top} \propto Q_{in}$ is in good agreement with the experimental results of Lin & Linden (Reference Lin and Linden2005) for a turbulent fountain in a two-layer stratification.
In almost all the previous studies, a clear distinction has not been made between the entrainment of volume flux and the dilution of scalar concentration in the fountain top. This is possibly due to the lack of well-resolved experimental data of velocity and scalar concentration for the fountain top. The distinction between entrainment and dilution may be very significant in this flow. Our flow visualisations and flow measurements suggest that the return flow from the oscillating fountain top is comprised of ejected fountain fluid of high scalar concentration and also induced flow (or entrained flow) of largely unmixed ambient fluid. The dynamic behaviour of the fountain top, which leads to spatially and temporally varying scalar concentration, is the key to all the observations made in this paper. In some instances, the entrained flow consisted of undiluted fluid with high scalar concentration, and in some other instances, the induced flow primarily consisted of the entrained ambient fluid at very low scalar concentration. Further, this phenomenon of high and low concentration induced flow is observed to be highly intermittent, and hence, the time-averaged scalar flux does not truly represent the transport of scalar flux across the base of the cap region. This implies that the entrainment of volume flux is not the same as scalar dilution. In an attempt to quantify the differences between the above two quantities, we conducted, for the first time, high-fidelity spatial measurements of velocity and concentration at a fountain top at different source Froude numbers,  $10 \leq Fr_o \leq 30$. The data also enabled us to develop and test a new metric using the instantaneous velocity and scalar fields to quantify dilution of scalar concentration at the fountain top.
2. Experimental details
Experiments were carried out in a cubical water tank with a side length of 1 m. The desired source Froude number ( $Fr_o$) was obtained by varying the source flow rate (
 $Q_o = {\rm \pi}W_o r_o^{2}$), pipe radius (
 $r_o$) and density ratio (
 $\rho _a-\rho _o/\rho _a$) between the ambient (
 $\rho _a$) and the source (
 $\rho _o$) fluids. The flow rate was set using an ISMATEC MCP-Z series gear pump with an accuracy of 1 %. The ratio of pipe length and pipe diameter is greater than 80 and the Reynolds number (based on pipe diameter and exit velocity) was set to be greater than 3000 to ensure a fully developed turbulent flow at the pipe outlet. The experimental parameters are summarised in table 1. At each
 $Fr_o$, six to eight runs have been conducted in order to ensure the repeatability of the measurements. A total of 40 experiments were conducted over the range,
 $10 \leq Fr_o \leq 35$, for estimating the uncertainty in the results presented in this paper.
Experimental parameters used in this study.

A combination of particle image velocimetry (PIV) and planar laser induced fluorescence (PLIF) measurement techniques was used to obtain simultaneous velocity and concentration measurements in the symmetric plane of the fountain top. Full details of the experimental procedures are given in Milton-McGurk et al. (Reference Milton-McGurk, Williamson, Armfield and Kirkpatrick2020) and the results have been validated in Talluru et al. (Reference Talluru, Armfield, Williamson, Kirkpatrick and Milton-McGurk2021) and Milton-McGurk et al. (Reference Milton-McGurk, Williamson, Armfield, Kirkpatrick and Talluru2021). Hence, the details are briefly discussed here. A dual-pulsed Nd-YAG laser (200 mJ pulse $^{-1}$ at 532 nm) was used to provide illumination for the PIV experiments. For the PLIF measurements, a fluorescent dye Rhodamine 6G was chosen as the scalar tracer, which has a peak emission at 560 nm. At each
 $Fr_o$, a total of 2400 images were captured using four pco.2000 cameras (two each for PIV and PLIF measurements) with a pixel resolution of
 $2048 \times 2048$ at a rate of 7 Hz. Burridge & Hunt (Reference Burridge and Hunt2013) reported a modified Strouhal number scaling for fountain height oscillations in a forced fountain (i.e.
 $Fr_o > 4$) as
 $Str_H = 0.5 = f_H ({r_o Fr_o}/{\sqrt {g \rho ^{\ast } r_o}})$, where
 $f_H$ is the highest frequency of height fluctuations in the fountain top. Using this relationship, we found the highest frequency of fountain height oscillations in the present experiments varies between 0.18 and 0.4 Hz for
 $10 \leq Fr_o \leq 30$. While our analysis does not require time resolved measurements, the sampling rate of 7 Hz is high enough to resolve these oscillations.
The PIV cameras were fitted with a  $532 \pm 2$ nm bandpass optical filter to cutoff ambient light and the Rhodamine 6G dye fluorescence. A
 $B+W$ Orange MRC 040M filter was used on the PLIF cameras to filter light below approximately 550 nm, allowing only the fluorescence from the dye, but not the scattered light from the particles, through to the CCD sensor. A snapshot of PIV and PLIF images taken in one of the experiments at
 $Fr_0 = 25$ is shown in figure 1(b). The inset plot shows the arrangement of two cameras for PIV (Cam 1 and Cam 2) and two cameras for PLIF (Cam 3 and Cam 4) with a small overlap between the images. Using the calibration image that is common to all the cameras, the images are stitched during the post-processing stage to yield a larger field of view. The final processed velocity and concentration fields are shown in figure 1(c). After confirming the symmetry of flow about the axis of the fountain, experiments were performed only on one side of the axis (as shown in figure 1b) to allow for a larger range of scales to be captured while maintaining high spatial resolution.
The uncertainty in the velocity fields was estimated using the ‘image matching’ method developed by Sciacchitano, Wieneke & Scarano (Reference Sciacchitano, Wieneke and Scarano2013). This method involves generating a synthetic image using the displacement vectors from a single pair of images and then comparing the original and simulated images. A perfect PIV algorithm would result in an exact match, however, in practice, there is a disparity between the particle locations in the original and synthetic images, which is used to estimate the error. Applying this method to a large number of image pairs from the present experiments, we found that the mean error in the instantaneous velocity fields was less than 0.005 pixels per time step (which equates to 0.6 mm s $^{-1}$). In the case of PLIF measurements, no post-processing algorithm is required as the image intensity is directly related to the scalar concentration. The error is mainly due to shot-to-shot variation of laser intensity, which has been quantified to be less than 2 %, as reported in Milton-McGurk et al. (Reference Milton-McGurk, Williamson, Armfield and Kirkpatrick2020). In order to quantify the repeatability of experiments, six to eight runs were conducted at each
 $Fr_o$, and the variability in the mean and variance of velocity and scalar fluctuations is found to be less than 3 %. Thus, the net uncertainty in the derived quantities presented in this paper is less than 5 %.
Throughout this paper,  $z$ and
 $r$ will be used to represent the axial and radial directions respectively, while
 $\tilde {W}$ and
 $\tilde {U}$ represent the corresponding instantaneous velocity components. Further,
 $\tilde {W} = W + w$ and
 $\tilde {C} = C+c$, where the uppercase and the lowercase letters represent the time-averaged mean and fluctuating quantities, respectively.
3. Results
At first, we briefly discuss the structure of velocity and scalar concentration at the fountain top. Figure 2(a–c) respectively shows the contour maps of time-averaged velocity (axial and radial) and concentration fields in a turbulent fountain at  $Fr_o = 15$. Note that the results are shown only on one side of the axis. Further, both the abscissa and ordinate axes are normalised using the source Froude number to facilitate a direct comparison with the relations for steady state height and the radial width of a turbulent fountain as reported in the literature.
A contour plot of time-averaged (a) axial and (b) radial velocity components; (c) scalar concentration in the cap region at  $Fr_o = 15$. The horizontal line in (a) represents the empirically predicted steady state height of the fountain. The vertical line in (b) represents the locus of maximum radial velocity at different
 $z$-locations. Two circular arcs are drawn at
 $({r}/{r_o}) Fr_o^{-1} = 0.21$ and 0.5 to indicate that the mean scalar field is only approximately hemispherical.

Looking at the contour map of axial velocity in figure 2(a), there is a region of upflow near the axis and adjacent to it is a region of counterflow. A horizontal line is drawn at  $(z/r_o) Fr_o^{-1} = 2.46$, which represents the empirical model for the steady-state height (
 $z_{ss}$) of a forced fountain (Turner Reference Turner1966; Burridge & Hunt Reference Burridge and Hunt2012) and the current data agree well with that model. As expected, the mean radial velocity is zero at the axis as evident in figure 2(b), which increases to a maximum at
 $({r}/{r_o}) Fr_o^{-1} \approx 0.21$ before dropping to zero in the ambient. Further, the maximum of
 ${\partial W}/{\partial r}$ (not shown here for brevity) estimated from the experimental data occurs at approximately the same location.
The mean scalar field shown in figure 2(c) indicates an approximately two-dimensional Gaussian distribution of concentration decreasing along the axial and radial directions. To illustrate this better, the radial distribution of  $C$ at the base of fountain top,
 $C(r, \hat {z} = 0)$ and axial distribution along the axis,
 $C(r = 0, \hat {z})$ are plotted in figure 3(a,b) along with numerically fitted Gaussian curves. Note that
 $\hat {z} = 0$ represents the base of the fountain top. It is clear that both the radial and axial distributions of
 $C$ are well represented by Gaussian curves. Further, the coefficients of the Gaussian fits for the radial and axial distributions are very similar, suggesting that the fountain top is approximately hemispherical. A closer observation of the radial and axial Gaussian fits reveals that the variance is higher in the axial direction, consistent with the elongated contours (larger spread) of
 $C$ along
 $z$ in figure 2(c). The higher axial variance is consistent with the oscillating behaviour of the fountain top as observed in previous studies (Burridge & Hunt Reference Burridge and Hunt2012, Reference Burridge and Hunt2013).
(a) The radial ( $C(r, \hat {z} = 0$)) and (b) the axial (
 $C(r = 0, \hat {z}$)) distributions of normalised scalar concentration at the fountain top. Symbols represent the experimental data and the solid lines denote the corresponding Gaussian fits. Note that
 $\hat {z} = 0$ indicates the base of the fountain top.

Further, the cap is slightly more elongated along  $z$. This is clearly evident in figure 2(c), where the contours of
 $C$ are compared against two circular arcs drawn at
 $({r}/{r_o}) Fr_o^{-1} = 0.21$ and 0.5. Note that, if the scalar field was perfectly hemispherical, the contours of
 $C$ would be circular in shape. Lastly, there is a finite value of concentration at the steady-state height (
 $z_{ss}$), which is expected as the fountain top oscillates above and below
 $z_{ss}$, resulting in a small residual concentration in the mean scalar field above
 $z_{ss}$. This is in contrast to the mean axial velocity field, where the positive and negative axial velocities result in a net zero velocity at
 $z_{ss}$ when averaged over time. We note that the profiles of mean axial velocity and the mean concentration are different along the radial direction, which suggest that there is a clear distinction between the entrainment of volume flux and the dilution of scalar concentration as will be elaborated in the later sections.
3.1. Entrainment
As defined earlier, the entrainment of ambient fluid into the fountain top ( $Q_{top}$) can be estimated using the inner and the outer volumetric flow rates,
 $Q_{in}$ and
 $Q_{out}$, respectively. To explain this, the radially weighted axial velocity (
 $rW$) at the base of the fountain top is plotted as a function of
 $r$ in figure 4. In this representation, the area represents the volume fluxes in the inner and the outer flow. Hence,
 $Q_{in}$ and
 $Q_{out}$ are respectively obtained as
 \begin{equation} Q_{in} = \int^{r_{in}}_{0} 2{\rm \pi} r W \,{{\rm d}}r \quad {\rm and}\quad Q_{out} = \int^{r_\infty}_{r_{in}} 2{\rm \pi} r W \,{{\rm d}}r. \end{equation}
Note that  $Q_{in}$ and
 $Q_{out}$ are both functions of
 $z$; both
 $Q_{in}$ and
 $Q_{out}$ decrease with
 $z$ as
 $W$ decays along the axis. Finally,
 $Q_{top}$ is estimated as
 $|Q_{out}| - |Q_{in}|$ at the base of the fountain top, where
 $|~|$ represents the modulus function.
The radial distributions of  $r W$ at the base of the fountain top (
 $Fr_z = 1.5$) at
 $Fr_o = 25$. Red and blue regions represent
 $Q_{in}$ and
 $Q_{out}$, respectively. The vertical dashed lines at
 $r_{in}$ and
 $r_\infty$ represent the locations of zero crossing in
 $W$ and zero mean volume flow rate, respectively.

Figure 5(a) shows the results of  $|Q_{out}|/Q_{in}$ at different
 $Fr_o$ plotted as a function of
 $Fr_z$. Note that
 $Fr_z$ is zero at
 $z_{ss}$ in the fountain. It is clearly evident that the ratio
 $|Q_{out}|/Q_{in}$ does not exhibit any similarity when plotted against
 $Fr_z$. We believe that the variation of
 $|Q_{out}|/Q_{in}$ with
 $Fr_o$ is due to the entrainment of the ambient fluid into the cap and the oscillating fountain top, whose frequency is a function of
 $Fr_o$ as reported by Burridge & Hunt (Reference Burridge and Hunt2016). Further, the distributions of
 $|Q_{out}|/Q_{in}$ exhibit minima at different values of
 $Fr_z$ in the range
 $1.2 \leq Fr_z \leq 1.8$. In the numerical simulations of Awin et al. (Reference Awin, Armfield, Kirkpatrick, Williamson and Lin2018), the ratio
 $|Q_{out}|/Q_{in}$ was estimated at the location where the radial width of the inner flow is maximum. The corresponding local Froude number (
 $Fr_z$) is found to be between 1.4 and 1.7. In order to maintain consistency, we chose the mean value
 $Fr_z = 1.5$ as the representative value to identify the base of the fountain top for the measurement of entrainment and dilution at different
 $Fr_o$. The chosen value of
 $Fr_z = 1.5$ is very similar to the analytical value,
 $Fr_z = \sqrt {2} \approx 1.414$, obtained by Debugne & Hunt (Reference Debugne and Hunt2016). To understand the effect of
 $Fr_z$ on the results presented in the later sections, we conducted a sensitivity analysis of
 $Q_{top}/Q_{in}$ on
 $Fr_z$ over the range
 $1.2 \leq Fr_z \leq 1.8$, and found the variation in
 $Q_{top}/Q_{in}$ to be less than 3 %.
(a) Comparison of  $|Q_{out}|/Q_{in}$ obtained via experiments (open symbols) at different
 $Fr_o$ plotted as a function of
 $Fr_z$. The two horizontal lines represent the observed limits of
 $|Q_{out}|/Q_{in}$ at
 $Fr_z = 1.5$ in the present experiments. (b) Variation of
 $Q_{top}/Q_{in}$ at the base of the cap for different
 $Fr_o$. Open symbols, experiments; filled symbols, numerical simulations (Awin et al. Reference Awin, Armfield, Kirkpatrick, Williamson and Lin2018). The error bars in (b) correspond to 5 % of the measured experimental values.

The corresponding results of  $Q_{top}/Q_{in}$ for the fountain base located at
 $Fr_z = 1.5$ at different
 $Fr_o$ are shown in figure 5(b). For comparison, we also included numerical simulation data of
 $Q_{top}/Q_{in}$ taken from Awin et al. (Reference Awin, Armfield, Kirkpatrick, Williamson and Lin2018), and the results agree well with the present experiments. Most importantly, unlike the previously reported results (Lin & Linden Reference Lin and Linden2005; Debugne & Hunt Reference Debugne and Hunt2016), we observe that
 $Q_{top}/Q_{in}$ can be greater than 1. In the previous studies such as Lin & Linden (Reference Lin and Linden2005) and Devenish et al. (Reference Devenish, Rooney and Thomson2010), the fountain evolves in a sharply stratified and a linearly stratified environment, respectively. Therefore, it is not surprising that the results of
 $Q_{top}/Q_{in}$ found here are different from the previous literature as the fountain evolves in a homogeneous fluid in the present study. As suggested by Burridge & Hunt (Reference Burridge and Hunt2016), the differences in the fountain entrainment in homogeneous and stratified environments could be due to the energy dissipation caused by interfacial waves excited when the rising turbulent jet/plume penetrates the density interface, an effect absent in our experiments.
As an interim summary about the entrainment of volume flux in the cap, we found that  $Q_{top}/Q_{in}$ varies between 1.5 and 3.5, suggesting that the phenomenological model put forth by Debugne & Hunt (Reference Debugne and Hunt2016) requires some tuning to account for the dependence of
 $Q_{top}/Q_{in}$ on
 $Fr_o$. Note that the entrainment model put forth by Debugne & Hunt (Reference Debugne and Hunt2016) was only tested against experimental data of entrainment in fountains evolving across a density interface. Further, this discrepancy also demonstrates the limitation of using dilution to measure entrainment as assumed by Lin & Linden (Reference Lin and Linden2005). This is due to non-uniform spatio-temporal dilution of scalar concentration in the cap caused by the entrained ambient fluid. In a turbulent fountain, there is fountain fluid entering the cap region where some entrainment of the ambient fluid occurs. Next, there is induced flow or basically unmixed ambient fluid that leaves the cap region with the ejected cap region fluid. The combination of these two conceptual flow streams is what we measure and analyse in this paper.
3.2. Dilution
In our flow visualisation experiments of a turbulent fountain, we observed a non-uniform distribution of scalar concentration at the fountain top, both spatially and temporally. At some instances, there is a high undiluted scalar concentration in the induced flow and at other instances, the induced flow mainly consisted of entrained ambient fluid at relatively low concentration. Further, the temporal variation of scalar concentration is found to be highly intermittent, suggesting that one cannot deduce scalar dilution in the cap based on the entrainment ratio,  $Q_{top}/Q_{in}$ evaluated at the base of the fountain top. This suggests that a time-averaged statistical quantity such as
 $Q_{top}$ does not provide physical insights into how the dilution of a scalar occurs at the fountain top. Our aims in computing dilution are twofold: first, to examine the relation of the entrainment of volume flux to scalar dilution. Secondly, to test how dilution ratio varies with
 $Fr_o$, and to determine if it scales with the integral quantities derived based on the inner flow. In this section, we develop and test a new procedure to estimate the scalar dilution at the fountain top via conditional analysis of instantaneous scalar fluxes crossing the base of the cap. To the authors’ knowledge, this is the first time that such a direct estimate is reported. First, we briefly describe the procedure of obtaining the conditional scalar fluxes using the instantaneous velocity and scalar concentration fields. Figure 6 illustrates all the intermediate steps involved in obtaining the conditional scalar fluxes based on which a dilution ratio is later defined. Akin to the entrainment calculation, an estimate of concentration dilution is obtained by comparing the scalar fluxes crossing into and out of the control surface at the base of the fountain top, i.e.
 $Fr_z = 1.5$, taken as uniform in experiments at different
 $Fr_o$. An instantaneous concentration field with overlaid velocity vectors is shown in figure 6(a). At the base of the fountain top, the time-varying
 $\tilde {W}$,
 $\tilde {C}$ and scalar flux (
 $\widetilde {WC}$) are obtained at an arbitrary radial location from a total of 2500 images. The respective time series signals of
 $\tilde {W}$,
 $\tilde {C}$ and
 $\widetilde {WC}$ are shown in figure 6(b). The scalar fluxes are first categorised into positive (
 $\widetilde {WC} > 0$) and negative (
 $\widetilde {WC} < 0$) scalar fluxes based on the conditions
 $\tilde {W} > 0$ (up flow) and
 $\tilde {W} < 0$ (return flow), respectively. The positive and negative scalar fluxes are conditionally binned into
 $N-1$ concentration bins between
 $C_1$ and
 $C_N$. The conditional scalar flux is then obtained as follows:
 \begin{align} \left.\begin{gathered} \langle \widetilde{WC} \rangle_i |_{{up}} = \langle \widetilde{WC} \,|\,\tilde{W} > 0 \quad {\rm and} \quad (C_{i} \leq \tilde{C} < C_{i+1}) \rangle \\ \langle \widetilde{WC} \rangle_i |_{{down}} = \langle \widetilde{WC} \,|\,\tilde{W} < 0 \quad {\rm and} \quad (C_{i} \leq \tilde{C} < C_{i+1}) \rangle,\quad \forall\ i = 1, 2,\ldots, N-1. \end{gathered}\right\} \end{align}
(a) Instantaneous concentration and velocity vector fields at a fountain top at  $Fr_o = 15$. (b) Time-varying
 $\tilde {W}$,
 $\tilde {C}$ and
 $\widetilde {WC}$ as a function of image number. (c) The conditional binning procedure of positive and negative scalar fluxes into bins,
 $C_{i} \leq \tilde {C} < C_{i+1},\ i = 1, 2,\ldots, N-1$. (d) Scalar fluxes entering (red) and leaving (blue) the base of the fountain top at different concentrations.

This is also illustrated graphically in figure 6(c). The conditional binning of positive and negative scalar fluxes is repeated at all radial locations ( $0 \leq r \leq r_\infty$) at the base of the fountain top. The net scalar fluxes entering (positive) and leaving (negative) the fountain top for
 $C_i \leq \tilde {C} \leq C_{i+1}$ are then obtained by integrating
 $\langle \widetilde {WC} \rangle _{i}$ over the entire width of the fountain as,
 $\int _{0}^{r_\infty } r \langle \widetilde {WC} \rangle _{i}\,{\textrm {d}}r$. Repeating this for all values of
 $\tilde {C}$ in
 $N-1$ concentration bins, we can then obtain the distribution of positive and negative buoyancy fluxes as a function of concentration. It should be noted that when the fountain top is in a steady state, there is no accumulation of scalar concentration at the fountain top, and therefore, the net scalar flux across the base of the fountain top should be zero. In other words, the following condition must be satisfied:
 \begin{equation} \sum_{i=1}^{N-1} \left(\left.\int_{0}^{r_{\infty}} r \langle \widetilde{WC} \rangle_{i}\,{{\rm d}}r \right|_{{{up}}}\right) + \sum_{i=1}^{N-1} \left(\left.\int_{0}^{r_{\infty}} r \langle \widetilde{WC} \rangle_{i}\,{{\rm d}}r \right|_{{{down}}}\right) = 0. \end{equation}
Using the distribution of conditional scalar fluxes shown in figure 6(d), the cumulative total of conditional positive and negative scalar fluxes is obtained. It is observed that the cumulative scalar fluxes into and out of the fountain top have similar magnitudes to within 2 %, which justifies the procedure employed in the study for estimating the conditional scalar fluxes. The results of conditional scalar fluxes at different  $Fr_o$ are presented in figure 7(a). As one would expect, the distributions of positive scalar fluxes are predominantly at higher concentrations while the majority of return scalar fluxes are at lower values. As a logical step, we also computed the mean scalar upflux and return flux using
 $WC$ as
 $r.r_\infty.WC$, and the results are plotted as a function of
 $C$ in figure 7(b). The mean scalar fluxes have similar shapes as the conditional scalar fluxes, with a peak and a trough that correspond to predominant concentrations in the upflow and the return flow. Finally, we can now define the dilution ratio
 $(R_D)$ as
 \begin{equation} R_D = \frac{C_{up}}{C_{down}}. \end{equation}
In physical terms,  ${C_{up}}$ is the most common concentration in the conditional scalar upflux, and upon dilution at the fountain top, the most common concentration in the return scalar flux (
 ${C_{down}}$) is relatively smaller, as evident in figure 6(d). In the definition of
 $R_D$, we consider
 ${C_{up}}$ and
 ${C_{down}}$ as the representative scales of scalar concentration in the positive (up) and negative (return) scalar fluxes, respectively and their ratio,
 $R_D$, is taken as an indicator of dilution. We demonstrate below that the profiles of
 ${C_{up}}$ and
 ${C_{down}}$ are approximately self-similar and scale with source conditions at the base of the fountain top. Since
 $R_D$ is a function of these profiles, it can be considered as a reasonable measure of dilution. We conjecture that this approach is more likely to eliminate the differences between different flow configurations. For instance, the induced flow at a fountain top (present study) may be different to a buoyant plume penetrating a density interface (Lin & Linden Reference Lin and Linden2005).
(a) Conditional and (b) mean scalar fluxes as a function of  $\tilde {C}$ and
 $C$, respectively. (c) Dilution ratio estimated as the ratio of the most predominant concentrations of the conditional (open symbols) and mean (filled symbols) scalar upflux and the return flux. The error bars in (c) correspond to 3 % of the measured experimental values.

In a similar manner, we can also obtain a different set of values for  $R_D$ using the distributions of mean scalar fluxes, as shown in figure 7(b). The values of
 $R_D$ based on conditional and mean scalar fluxes over the range of
 $Fr_o$ (= 10, 15, 20, 25 and 30) are plotted in figure 7(c). It is observed that
 $R_D$ varies non-systematically with
 $Fr_o$, and it has higher magnitude than the mean scalar fluxes (filled symbols). Interestingly, there seems to be a consistent anti-trend between the values of
 $R_D$ obtained from the conditional and mean scalar fluxes. Although not directly comparable, we noticed that the two ratios,
 $R_D$ and
 $Q_{top}/Q_{in}$ (see figure 5b) have different mean values and variation with
 $Fr_o$. While
 $R_D$ has a mean value of 1.9 (based on conditional scalar fluxes) with a variation of
 $\pm$10 % about the mean,
 $Q_{top}/Q_{in} \in [1.5\ 3.5]$ and has a relatively larger variation of
 $\pm$40 % with
 $Fr_o$.
Finally, we tested if the conditional and mean scalar fluxes scale with integral quantities:  $r_m$,
 $W_m$ and
 $C_m = (b_m/b_o) C_o$ as defined in (1.2). Here,
 $b_o$ and
 $C_o$ are the source buoyancy and source concentration, respectively. The normalised results of conditional and mean scalar fluxes are presented in figure 8(a,b), respectively. Considering the variability in experiments, there is a reasonably good collapse of mean and conditional scalar flux profiles at different
 $Fr_o$. This suggests that the scalar fluxes and their dilution measured through
 $R_D$ scale with the properties of the inner flow at the base of the fountain top. This result is entirely consistent with the phenomenological model of Debugne & Hunt (Reference Debugne and Hunt2016), which accounts for rise-height fluctuations and an engulfment time scale associated with the inner flow at the base of the fountain top.
Distributions of (a) conditional and (b) mean scalar fluxes when normalised by the integral quantities defined based on the inner-flow velocity and concentration profiles at the base of the fountain top. Lines of different colour represent the normalised distributions at different  $Fr_o$.

4. Discussion
4.1. Link between  $R_D$ and $Re_z$


In this section, we will attempt to explain the variation of  $R_D$ with
 $Fr_o$ as observed in figure 7(c). In the flow visualisation experiments, we observed that the flow turbulence at the base of the cap varied with
 $Fr_o$ and
 $Re_o$. This observation suggests that the dilution at the fountain top may be dictated by the local Reynolds number (characterising the turbulence in the inner flow) at the base of the cap. As seen in the previous section, the profiles of
 $R_D$ scaled very well when normalised by the local integral scales. For this reason, we defined the local Reynolds number (
 $Re_z$) in terms of the local integral scales as
 \begin{equation} Re_z = \frac{2 W_m r_m}{\nu_o}, \end{equation}
where  $W_m$ and
 $r_m$ are the local integral velocity and length scales defined based on the inner flow of the fountain. Note that
 $W_m$ and
 $r_m$ are functions of
 $z$, and
 $\nu _o$ is the fluid viscosity at the source. The results of
 $Re_z$ are plotted against
 $Fr_o$ in figure 9, where we observe a non-monotonic variation of
 $Re_z$. Most importantly, the variation of
 $Re_z$ has a great similarity to the trend of
 $R_D$ when plotted against
 $Fr_o$. This provides support to our earlier hypothesis that the turbulence in the inner flow at the base of the cap affects the dilution in the cap, and is an important parameter to consider when estimating the dilution in the cap.
Variation of the local Reynolds number  $Re_z$ as a function of the source Froude number,
 $Fr_o$.

To further elaborate on this, we computed the turbulence intensity defined as the ratio of the integral root-mean-square velocity ( $\sigma _w$) and the integral mean axial velocity (
 $W_m$). The results of turbulence intensity
 $({\sigma _w}/{W_m})$ are shown in figure 10(a,b) plotted against
 $Fr_o$ and
 $Re_z$, respectively. It is observed that the turbulence intensity continuously increases with
 $Fr_o$ and approaches a constant value at large
 $Fr_o$. This may be explained as follows. As
 $Fr_o$ increases, the momentum forces dominate over the buoyancy force and the turbulent fountain behaves similarly to a neutral jet. Further, as the turbulence statistics in a neutral jet become self-similar in the far-field region, the turbulence intensity approaches a constant value, as noticed here in
 ${\sigma _w}/{W_m}$ at larger values of
 $Fr_o$. On the other hand, there is no systematic variation of the turbulence intensity with
 $Re_z$, which suggests the dependence of
 ${\sigma _w}/{W_m}$ on
 $Re_o$. We believe that the magnitude of
 ${\sigma _w}/{W_m}$ is a result of the combined influence of
 $Re_o$ and
 $Fr_o$ on the turbulence at the base of the cap. In a neutral jet, as
 $Re_o$ increases, the magnitude of
 ${\sigma _w}/{W_m}$ increases proportionally before it attains a self-similar value independent of
 $Re_o$. However, in a turbulent fountain, where the buoyancy opposes the momentum, there is the dampening of turbulence in the flow as observed in our previous study (Talluru et al. Reference Talluru, Armfield, Williamson, Kirkpatrick and Milton-McGurk2021). For instance, in the seven experimental cases presented in this study,
 $Re_o$ is highest for
 $Fr_o = 18$; however, the turbulence intensity is maximum for
 $Fr_o = 35$, where the dampening effect of buoyancy is relatively reduced compared with
 $Fr_o = 18$. This will be further discussed using an analytical model that links
 $Re_z$ with the source parameters,
 $Fr_o$ and
 $Re_o$ in the following section.
Turbulence intensity  $({\sigma _w}/{W_m})$ as a function of (a) source Froude number,
 $Fr_o$ and (b) the local Reynolds number,
 $Re_z$. The grey line in (a) represents the nominal variation of
 ${\sigma _w}/{W_m}$.

4.2. Analytical model
To develop an analytical model, we start with the definition of the local Reynolds number ( $Re_z$) as given in (4.1). We then express
 $W_m$ in terms of
 $Fr_z$ using (1.1). By introducing the source conditions such as the mean axial velocity (
 $W_o$), the radius (
 $r_o$) and the buoyancy (
 $b_o$), we can thus express
 $Re_z$ in terms of
 $Fr_z$,
 $Fr_o$,
 $Re_o$ and the ratio of integral length and buoyancy scales
 \begin{align} Re_z &= \frac{2 r_m W_m}{\nu_o} \nonumber\\ &= 2 \left(\frac{r_m}{\nu_o}\right) Fr_z \sqrt{r_m b_m} \nonumber\\ &= Fr_z \sqrt{\frac{r_m}{r_o}\frac{b_m}{b_o}} \left(\frac{2 W_o r_m}{\nu_s}\right) \left(\frac{\sqrt{r_o b_o}}{W_o}\right) \nonumber\\ &= \frac{Fr_z}{Fr_o} \sqrt{\frac{r_m}{r_o}\frac{b_m}{b_o}} \left(\frac{2 W_o r_o}{\nu_s}\right) \left(\frac{r_m}{r_o}\right) \nonumber\\ &= \frac{Fr_z}{Fr_o} Re_o \sqrt{\frac{r_m}{r_o} \frac{b_m}{b_o}} \left(\frac{r_m}{r_o}\right) \nonumber\\ &= \frac{Fr_z}{Fr_o} Re_o \left({\frac{b_m}{b_o}}\right)^{1/2} {\left(\frac{r_m}{r_o}\right)}^{3/2}. \end{align}
Now, we use the empirical relations for  ${r_m}/{r_o}$ and
 ${b_m}/{b_o}$ as reported in Milton-McGurk et al. (Reference Milton-McGurk, Williamson, Armfield and Kirkpatrick2022). It was found that
 ${b_m}/{b_o}$ decreases linearly with
 $z/r_o$ and
 ${r_m}/{r_o}$ increases linearly with
 $z/r_o$. These relations were obtained by assuming a constant entrainment coefficient in the fountain up to the base of the cap and using a linear relation for the integral velocity in the outer flow. Thus,
 $Re_z$ can be expressed as
 \begin{equation} Re_z = \frac{Fr_z}{Fr_o} Re_o {\left(1 - a \frac{z}{r_o}\right)}^{1/2} {\left(1 + b \frac{z}{r_o}\right)}^{3/2}, \end{equation}
where  $a$ and
 $b$ are positive constants. Further, Milton-McGurk et al. (Reference Milton-McGurk, Williamson, Armfield and Kirkpatrick2022) reported that
 $z/r_o \propto Fr_o$, which is consistent with the previous findings for the steady-state height of a turbulent fountain,
 $z_{ss}/r_o = 2.46Fr_o$ (Burridge & Hunt Reference Burridge and Hunt2012; Hunt & Burridge Reference Hunt and Burridge2015). Now, for large
 $z/r_o$, we can approximate
 ${r_m}/{r_o} \propto Fr_o$. Replacing
 $z/r_o \sim Fr_o$ and replacing
 $a$ with another constant
 $K$ leads to
 \begin{align} Re_z &\simeq \frac{Fr_z}{Fr_o} Re_o {(1 - a Fr_o)}^{1/2} {(Fr_o)}^{3/2} \nonumber\\ &\simeq {Fr_z} Re_o {(1 - K Fr_o)}^{1/2} {(Fr_o)}^{1/2}. \end{align}
Since the exponents of the product terms are the same, we can combine them to get the ratio of the local Reynolds number and the source Reynolds number ( ${Re_z}/{Re_o}$) as
 \begin{equation} \frac{Re_z}{Re_o} \simeq {Fr_z} {(1 - K Fr_o)}^{1/2} {(Fr_o)}^{1/2}. \end{equation}
The model captures quite well all the relevant non-dimensional parameters involved in the study of a turbulent fountain. Using the empirical value of  $K = 0.02$ obtained in our experiments, we found that the maximum of
 $Re_z/Re_o$ (at the base of the cap) occurs at
 $Fr_o = {1}/{(2K)} = 25$. Note that the local Froude number at the base of the cap,
 $Fr_z \approx 1.5$, and is treated as a constant here. Further, it should be noted that (4.5) is only valid at large values of
 $z/r_o$ and under the assumptions stated earlier. Figure 11 shows a comparison of the experimental data against the results from the analytical model (4.5), which indicates a good agreement between them. The analytical model is able to correctly predict the maximum value of
 $Re_z/Re_o$ at
 $Fr_o = 25$. Note that the analytical results have been scaled by a constant factor to form a proper comparison with the experimental data as (4.5) is only an approximate relationship. As mentioned earlier, the idea behind developing this analytical model is mainly to explain the non-systematic variation of
 $R_D$ with
 $Fr_o$ as observed in the previous section. As such, one should exercise caution in applying the proposed model. It requires a much more comprehensive dataset by varying
 $Re_o$ and
 $Fr_o$ to test if this model is applicable over a broader range of
 $Re_o$ and
 $Fr_o$, which is beyond the scope of this study. Nevertheless, the model seems quite useful as it includes all the governing source parameters and presents physical insights about the role of the local Reynolds number and the local Froude number. One may treat
 $Fr_z \simeq 1.5$ as a constant in the above model, as it is primarily used for identifying the base of the cap.
Comparison of experimental data of  $Re_z/Re_o$ (at the base of the cap) against the numerical model. The symbols represent data at different
 $Fr_o$. The solid grey line is the analytical model given by (4.5).

5. Conclusions
Detailed measurements of velocity and concentration have been obtained in the cap region of a turbulent fountain by varying the source Froude number ( $Fr_o$) between 10 and 35. The mean structure of the fountain agrees well with the current understanding, i.e. the shape of the cap is approximately hemispherical. Further, the base of the fountain top is found to scale well with local Froude number,
 $Fr_z \approx 1.5$ over the range of
 $Fr_o$ tested in this study. Our results agree well with the empirical model for the steady-state height of the fountain as reported in the literature (Turner Reference Turner1966; Burridge & Hunt Reference Burridge and Hunt2012). The entrainment (mean volume flux) of the ambient fluid into the cap is estimated as the difference of volume fluxes in the return flow and the upflow at the base of the fountain top. It is observed that the ratio of entrained volume flux and the supplied volume flux to the fountain top lies between 1.5 and 3.5, and exhibits a non-monotonic variation with
 $Fr_o$. The measured values of entrained volume flux are observed to be greater than those previously reported via a theoretical model (Debugne & Hunt Reference Debugne and Hunt2016) and experiments in a stratified flow (Lin & Linden Reference Lin and Linden2005).
A new and robust metric has been proposed to directly estimate dilution of a scalar at the fountain top. A comparison of the new metric against entrained volumetric ratio revealed that the two quantities have different mean values and varied non-systematically with  $Fr_o$. It is conjectured that the proposed metric can better characterise dilution of a scalar at a fountain top taking into account the induced downward flow that depends on the flow configuration. As a final concluding statement, we emphasise that the dilution of scalar concentration is not equal to the entrainment of ambient volume flux at the fountain top. Nonetheless, the self-similarity of the profiles of dilution ratio when scaled with integral quantities of the inner flow seems to suggest that the phenomenological model put forth by Debugne & Hunt (Reference Debugne and Hunt2016) may be extended to model the dilution of scalar concentration at the fountain top.
In an attempt to explain the variation of the dilution ratio with  $Fr_o$, we found that the local Reynolds number (
 $Re_z$) at the base of the cap has a direct correlation with the dilution ratio. This supports the idea that the turbulence in the inner flow fed to the cap at its base controls the dilution of the scalar concentration in the cap. An analytical model has been developed to connect
 $Re_z$ to the local (
 $Fr_z$) and source parameters (
 $Re_o$ and
 $Fr_o$), which is found to agree well with the experimental data. As a final concluding statement, the entrainment of volume flux and the dilution of scalar concentration at the fountain top are governed by both the source (
 $Re_o$ and
 $Fr_o$) and the local (
 $Re_z$ and
 $Fr_z$) parameters, and as such, these parameters must be considered when developing the prediction models.
Supplementary movie
Supplementary movie is available at https://doi.org/10.1017/jfm.2022.292.
Acknowledgements
The authors acknowledge the Australian Research Council for its financial support via ARC Discovery Project DP160102134.
Declaration of interests
The authors report no conflict of interest.


 Open access

