Introduction
A sound understanding of the magnitude and sources of variation of both the size and shape of extinct organisms is fundamental for accurate interpretation of data in paleobiological inquiry. Such variation may be attributed to a variety of sources, including ontogenetic, ecological, evolutionary, or taphonomic processes. Ecophenotypic variation is intraspecific variation in size or shape driven by differences in environmental variables acting on genetically similar populations. Environmentally driven differences in size and shape have been identified in a broad range of taxa throughout the history of metazoans and have been attributed to a variety of drivers, including hydrodynamic conditions, substrate type, water depth, immersion time in intertidal environments, temperature, salinity, oxygen concentration, pH, habitat/bathymetric heterogeneity, population density, and food availability (e.g., Bottjer Reference Bottjer1980; Kemp and Bertness Reference Kemp and Bertness1984; Daley Reference Daley1999; Wilk and Bieler Reference Wilk and Bieler2009; Zieritz and Aldridge Reference Zieritz and Aldridge2009; Clewing et al. Reference Clewing, Riedel, Wilke and Albrecht2015; Piovesan et al. Reference Piovesan, Bergue, Fauth and Viviers2015; Schlüter Reference Schlüter2016; Penny et al. Reference Penny, Wood, Yu. Zhuravlev, Curtis and Bowyer2017). Correctly recognizing ecophenotypic variation can help one avoid mistakes in taxonomic identification and can assist in the interpretation of paleoenvironments based upon their influence on such taxa.
Though little has been published on the influence of taphonomic processes on the preservation of ecophenotypic variation specifically, such research has addressed the preservation of morphological variation in general. Time averaging, the temporal mixing of multiple generations of organisms within a stratigraphic interval, is generally thought to result in the preservation of greater morphological variability within a deposit than had existed in single populations (Wilson Reference Wilson1988; Bush et al. Reference Bush, Powell, Arnold, Bert and Daley2002), though the extent depends upon the tempo and mode of evolution as well as the extent of time averaging (Kidwell and Holland Reference Kidwell and Holland2002; Hunt Reference Hunt2004a, Reference Hunt2004b). Presumably, time averaging of ecophenotypic variation would result in a similar “smearing” of morphological variability as the driving environmental variables change through time. Spatial mixing of fossils by out-of-habitat transport is rare, except in predictable depositional settings (e.g., rivers, turbidites) and taxa (e.g., bloated vertebrate carcasses, chambered-shell cephalopods), though within-habitat transport is likely common (Kidwell and Holland Reference Kidwell and Holland2002). Within-habitat postmortem transport of skeletal material would also likely reduce the spatial fidelity of ecophenotypic variation in the fossil record, though again, these ideas have yet to be evaluated.
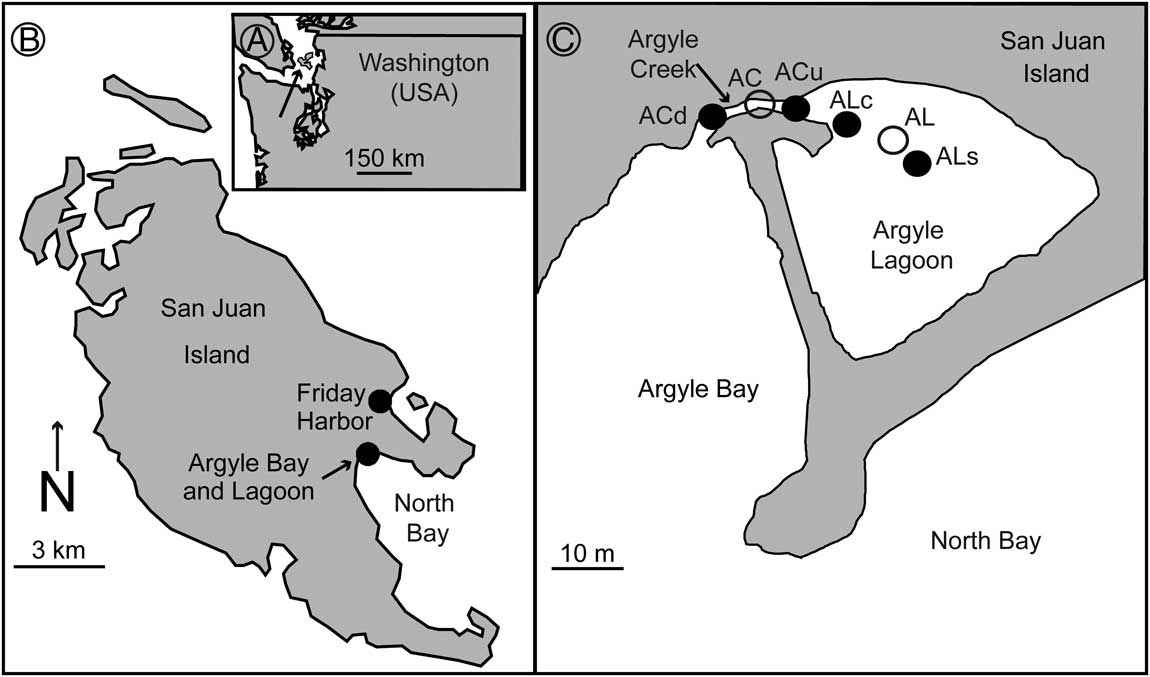
Leukoma staminea, previously referred to as Protothaca staminea by Huntley (Reference Huntley2007; see Coan and Valentich-Scott Reference Coan and Valentich-Scott2012), is an infaunal, suspension-feeding bivalve from the Veneridae family that is common in gravelly, sandy, and muddy substrates in protected bays along northern Pacific coasts (Kozloff Reference Kozloff2000; Huber Reference Huber2010) and is particularly common in the vicinity of North Bay, San Juan Island, WA (Fig. 1). Argyle Lagoon is a low-energy, tidally influenced body of marine water whose mud/sand substrate remains submerged in the interior, with only its margins exposed during low tides. The lagoon maintains connection and circulation with the open waters of Argyle and North Bays via Argyle Creek, a shallow, high-energy tidal creek with a gravel/sand substrate whose thalweg is also not completely exposed during low tide. These differences in substrate impose differing life modes upon L. staminea individuals, with a typical infaunal life mode in Argyle Lagoon and an atypical epifaunal life mode in Argyle Creek. Live-collected bivalves from the creek have been shown to be significantly smaller and infested more frequently by shell-altering digenean trematode parasites (indicated by the presence of oval-shaped pits with raised rims on the interior of the host) than lagoon bivalves (Huntley Reference Huntley2007). Likewise, epifaunal specimens suffer higher taphonomic alteration than their infaunal counterparts (Lazo Reference Lazo2004). Lazo (Reference Lazo2004) asserted that the differences in life mode were not reflected in shell morphology, but a visual inspection of the specimens of Huntley (Reference Huntley2007) suggests otherwise. The purposes of this study are: (1) to test for variation in size and shape of live-collected conspecific intertidal bivalves living within close proximity on differing substrates with differing life modes, (2) to test for linkages between trematode parasitism and bivalve morphology, (3) to test the fidelity of these signals within adjacent death assemblages, and (4) to examine the ecological underpinnings and implications of such variation, if present.
Location map of study: A, Washington; B, San Juan Island; and C, Argyle Creek and Argyle Lagoon. Live-collected specimen locations are indicated by open circles (AC, Argyle Creek; AL, Argyle Lagoon). Death-assemblage locations are indicated by solid circles (ACd, Argyle Creek downstream; ACu, Argyle Creek upstream; ALc, Argyle Lagoon spit-side channel; ALs, Argyle Lagoon surface). Figure modified from Huntley (Reference Huntley2007).

Materials and Methods
Live specimens of L. staminea were collected in both the creek (AC; epifaunal individuals; the gravel substrate precludes burrowing) and the lagoon (AL; infaunal individuals; mud, silt, to very fine sand) in August 2004 (Huntley Reference Huntley2007). Surficial death assemblages were collected in August 2006 from four locations: downstream from the AC location (ACd); upstream from the AC location (ACu); in the higher-energy, spit-side channel at the juncture of the lagoon and creek (ALc; coarse sand, gravel, shell bed substrate); and from the lower-energy surface of the lagoon adjacent to the location of the live-collected sample (ALs; Fig. 1).
Live specimens were sacrificed and cleaned with a scalpel and small brush. Valves from death assemblages were soaked in 10% H2O2 solution to remove desiccated algae and cleaned physically with a small brush. Valves from death assemblages were examined for matches. The pallial line, pallial sinus, and adductor muscle attachment scars of these valves were outlined in pencil so as to accentuate their visibility. Photographs of the interior of these valves were made with a Nikon D600 digital SLR camera on a Kaiser eVision copy-stand for a standardized orientation. Specimens and scale bars were placed near the center of view, and consistent camera settings were maintained for images of all specimens (Collins and Gazley Reference Collins and Gazley2017). The left valves of the live-collected specimens, the right paired valves from the death assemblages, and the left and right singletons from the death assemblages were used for further analysis. Mirrored images of the left valves were used such that all data were extracted from a right-valve orientation.
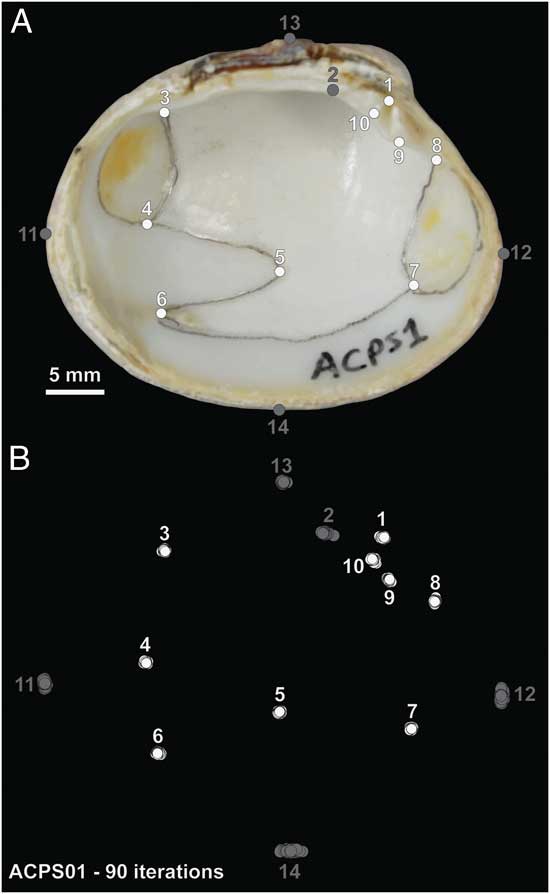
Ten true landmarks (Fig. 2A, 1–10) and four pseudolandmarks (Fig. 2A, 11–14) were selected to quantify the morphology of L. staminea valves from scaled images in ImageJ freeware. The x- and y-coordinates of the landmarks were collected from the same specimen (ACPS01) 90 times to assess operator error. The error about each of the landmarks, with the exception of landmark 2, was distributed in a circular pattern (Fig. 2B), suggesting that error was random and did not display a preferred orientation. Landmark 2 and pseudolandmarks 11–14 displayed a linear orientation of error tangential to the shell margin (Fig. 2B) and were not included in further analyses.
Leukoma staminea and landmarks. A, Leukoma staminea live collected in Argyle Creek (ACPS01) with landmarks indicated by circles. B, Procrustes-transformed x- and y-coordinates of all landmarks measured on the same individual 90 times to assess operator error. Landmark 2 and pseudolandmarks 11–14, shown in gray, displayed linear variation and were not used in further analyses. Landmarks in white (1, 3–10) displayed circular variation about the mean and were further analyzed.

Centroid size, a proxy for body size (the square root of the sum of squared distances of the landmarks from the centroid), was calculated for each valve from landmarks 1 and 3–10. The landmark coordinate data were then subjected to a generalized least-squares Procrustes transformation to eliminate differences attributable to orientation, position, and size. A principal components analysis (PCA) was conducted on the Procrustes-transformed landmark data on the variance–covariance matrix. To aid interpretation of this morphospace, thin-plate spline analyses were used to produce deformed grids and expansion factors for four select specimens, from opposing extremes of the morphospace, relative to the mean configuration of the Procrustes-transformed coordinates. Further, point cloud data of the interior of these select bivalves were collected using a FARO Arm laser scanner (35 µm resolution). Three-dimensional models were produced in InnovMetric PolyWorks software. These models were compared in InnovMetric IMinspect software by scaling opposing shells to the same centroid size, conducting a best-fit alignment of the valves’ interior surfaces using the alignment tool, and producing a color map illustrating topographic differences using the measure deviation tool. The 2D surface areas of the anterior and poster adductor muscle scars were measured from the photographs using ImageJ freeware (Schneider et al. Reference Schneider, Rasband and Eliceiri2012). The length of the pallial sinus was calculated from the landmark data as the distance between landmark 5 and the midpoint of a straight line connecting landmarks 4 and 6. Allometric coefficients were calculated for the muscle scars and the pallial sinus for the live-collected specimens by environment (AC and AL). The allometric coefficient is calculated as the slope of the reduced major axis regression model between the natural log-transformed sizes of the anatomical feature (surface area for muscle scars, length for pallial sinus) with the natural log-transformed centroid size. Randomizations (10,000 iterations) were conducted in SAS (version 9.4) to determine the 95% and 99% confidence intervals for the range of variance values expected by random chance (similar to an ANOVA) for centroid size, PC 1 values, and PC 2 values from each sample. Calculation of centroid size and Procrustes transformation were performed in PAST freeware (version 2.17c) (Hammer et al. Reference Hammer, Harper and Ryan2001). Reduced major axis regressions, PCA, and the calculation and plotting of density values for centroid size and PC variables were performed in R freeware using the following packages: ‘ggplot2,’ ‘plyr,’ ‘dplyr,’ ‘factoextra,’ ‘lmodel2,’ ‘ggpubr,’ and ‘ggridges’ (Wickham Reference Wickham2009, Reference Wickham2011; Legendre Reference Legendre2014; Kassambara Reference Kassambara2017; Kassambara and Mundt Reference Kassambara and Mundt2017; R Core Team 2017; Wickham et al. Reference Wickham, Francois, Henry and Müller2017; Wilke Reference Wilke2017). An alpha of 0.05 is assumed for all statistical tests unless otherwise stated.
Results
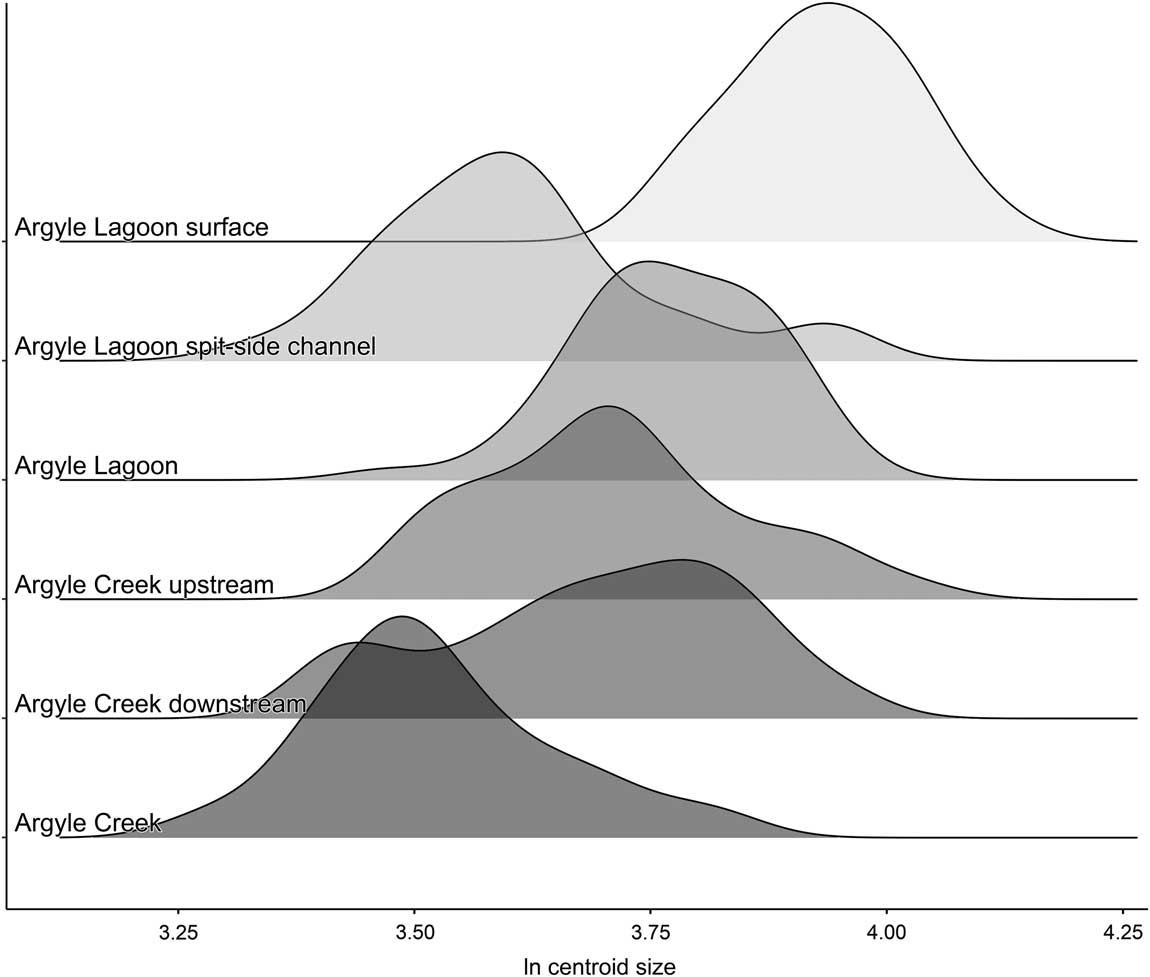
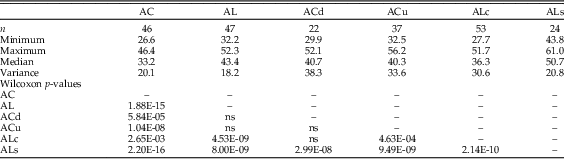
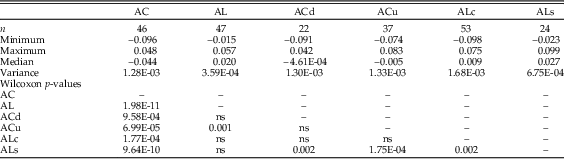
Body size varied significantly among the live-collected and death-assemblage samples (Fig. 3, Table 1). Live-collected specimens from Argyle Creek were significantly smaller than their counterparts in all other samples, whether live collected or death assemblage (Table 1). There was no significant difference in body size between the two death assemblages from Argyle Creek. Live-collected valves from AL were significantly larger than valves in the ALc death assemblage and significantly smaller than valves in the ALs death assemblage. The median body size of the ALs death assemblage was significantly greater than the median body size of all other samples, living or dead (Table 1). Variance of body size was greater in the creek death assemblages (ACd, ACu) and the spit-side channel death assemblage of the lagoon (ALc) than in the live-collected assemblages of both the creek (AC) and lagoon (AL) or the surface death assemblage of the lagoon (ALs; Table 1). Indeed, body-size variance values of AC, AL, and ALs fall below the 99% confidence interval calculated from the randomization (Table 2).
Natural log-transformed, centroid size-density distributions for live-collected (AC and AL) and death-assemblage (ACd, ACu, ALc, and ALs) specimens of Leukoma staminea from Argyle Creek and Argyle Lagoon.

Body-size (centroid-size) summary statistics and p-values of pairwise Wilcoxon tests for median centroid-size values of Leukoma staminea from Argyle Creek (AC) and Argyle Lagoon (AL). ACd, downstream from the AC location; ACu, upstream from the AC location; ALc, in the higher-energy, spit-side channel at the juncture of the lagoon and creek; ALs, from the lower-energy surface of the lagoon adjacent to the location of the live-collected sample. ns, not significant, >αBonferroni (0.05/15=0.003).

Results of 10,000-iteration randomizations for body-size variance values. Percentile values were used to calculate 95% and 99% confidence intervals for variance. Variance values that fall outside of one or both confidence intervals are in bold. AC, Argyle Creek; ACd, downstream from the AC location; ACu, upstream from the AC location; AL, Argyle Lagoon; ALc, in the higher-energy, spit-side channel at the juncture of the lagoon and creek; ALs, from the lower-energy surface of the lagoon adjacent to the location of the live-collected sample.

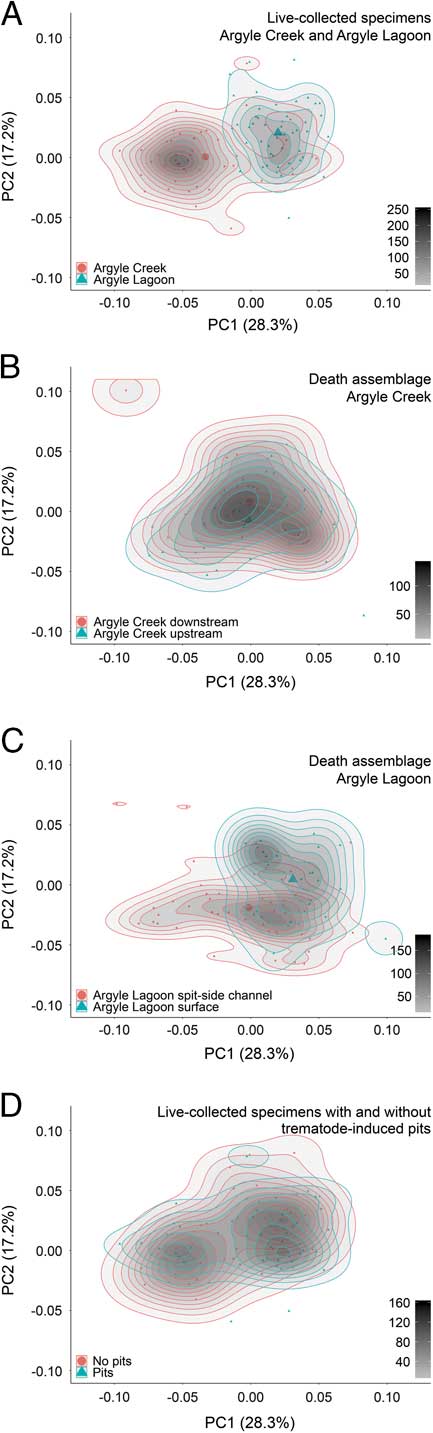
The PCA results show distinct positions of the samples in the landmark-derived morphospace (Fig. 4). The first two principal components (PC 1 and PC 2) account for 45.5% of the size-free morphological variation (28.3% and 17.2%, respectively) and illustrate the most distinction between the samples (Supplemental Figs. 1 and 2). The surface death-assemblage and live-collected specimens from Argyle Lagoon display more positive PC 1 values, while live-collected Argyle Creek specimens display more negative values. The upstream and downstream creek death-assemblage specimens overlap nearly completely and display more central PC 1 values (Fig. 4, Table 3). Specimens from the Argyle Lagoon spit-side channel death assemblage display a broad range of PC 1 values, again centered near a value of zero. The median PC 1 value for AC live-collected specimens is significantly more negative than the median PC 1 scores for all other samples, either live collected or death assemblage (Table 3). The median PC 1 value for the ALs sample is significantly more positive than all other samples except for AL (Table 3). Variation of PC 1 scores, quantified as variance, is significantly lower than expected by random chance for the AL live-collected sample (<<99% CI) and the ALs death assemblage (<95% CI). The PC 1 variance values of the remaining samples fell within the envelope of values expected by random chance (Table 4). There is no significant difference between the median PC 1 values of parasitized and nonparasitized valves in the AL (p=0.405) and AC (p=0.921) samples (Fig. 4).
Principal components analysis of Procrustes-transformed landmark data of Leukoma staminea from Argyle Creek and Argyle Lagoon (PC 1 v. PC 2). A, Comparison of Argyle Creek and Argyle Lagoon live-collected samples. B, Comparison of Argyle Creek death assemblages. C, Comparison of Argyle Lagoon death assemblages. D, Comparison of parasitized and nonparasitized live-collected samples from Argyle Creek and Argyle Lagoon. See Supplemental Fig. 1 for scree and loadings plots.

Principal component 1 (PC 1) score summary statistics and p-values of pairwise Wilcoxon tests for median PC 1 values for each sample of Leukoma staminea from Argyle Creek (AC) and Argyle Lagoon (AL). ACd, downstream from the AC location; ACu, upstream from the AC location; ALc, in the higher-energy, spit-side channel at the juncture of the lagoon and creek; ALs, from the lower-energy surface of the lagoon adjacent to the location of the live-collected sample. ns, not significant, >αBonferroni (0.05/15=0.003).

Results of 10,000-iteration randomizations for principal component 1 (PC 1) variance values. Percentile values were used to calculate 95% and 99% confidence intervals for variance. Variance values that fall outside of one or both confidence intervals are in bold. AC, Argyle Creek; ACd, downstream from the AC location; ACu, upstream from the AC location; AL, Argyle Lagoon; ALc, in the higher-energy, spit-side channel at the juncture of the lagoon and creek; ALs, from the lower-energy surface of the lagoon adjacent to the location of the live-collected sample.

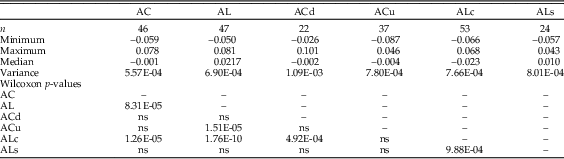
Similar to PC 1, Bonferroni-corrected Wilcoxon tests reveal significant differences in median PC 2 score values between samples (Table 5). The median PC 2 score for the AL sample was significantly higher than the median PC 2 scores of the AC, ACu, and ALc samples. There is no statistically significant difference in median PC 2 scores for AL and ALs (Table 5). The median PC 2 value of the AC sample is statistically indistinguishable from ACd, ACu, and the ALs samples. The ALc median PC 2 value is significantly lower than all samples except ACu. The variance of the AC PC 2 value is slightly less than the lower 95% confidence interval. The PC 2 variance values for all other samples falls within the envelope of that which is expected by random chance based upon the randomization results (Table 6). The median PC 2 value of parasitized AL individuals is significantly higher than nonparasitized AL individuals (p=0.007). Conversely, the median PC 2 value of parasitized AC individuals is significantly lower than nonparasitized AC valves (p=0.031).
Principal component 2 (PC 2) score summary statistics and p-values of pairwise Wilcoxon tests for median PC 2 values for each sample of Leukoma staminea from Argyle Creek (AC) and Argyle Lagoon (AL). ACd, downstream from the AC location; ACu, upstream from the AC location; ALc, in the higher-energy, spit-side channel at the juncture of the lagoon and creek; ALs, from the lower-energy surface of the lagoon adjacent to the location of the live-collected sample. ns, not significant, >αBonferroni (0.05/15=0.003).

Results of 10,000-iteration randomizations for principal component 2 (PC 2) variance values. Percentile values were used to calculate 95% and 99% confidence intervals for variance. Variance values that fall outside of one or both confidence intervals are in bold. AC, Argyle Creek; ACd, downstream from the AC location; ACu, upstream from the AC location; AL, Argyle Lagoon; ALc, in the higher-energy, spit-side channel at the juncture of the lagoon and creek; ALs, from the lower-energy surface of the lagoon adjacent to the location of the live-collected sample.

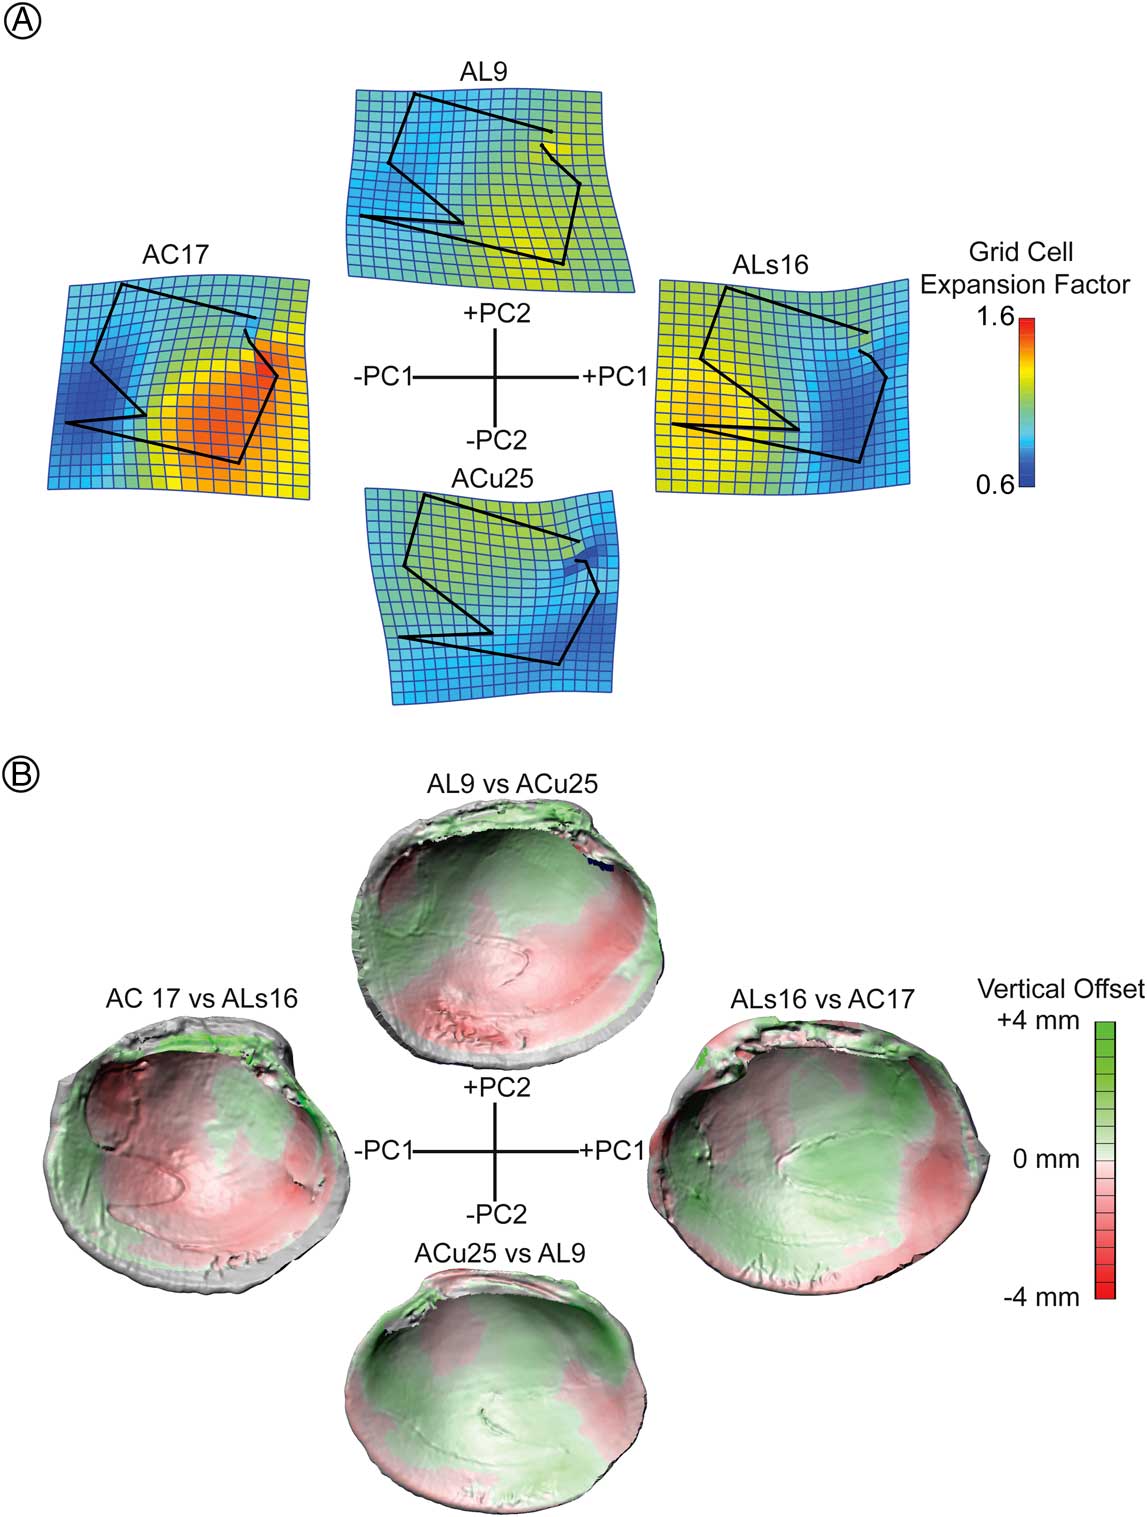
Thin-plate spline analyses relative to the mean Procrustes-transformed landmark data configuration were conducted on four specimens that represented distal values on one of the axes in the PC 1 versus PC 2 space and a value near zero on the other axis in order to aid in the interpretation of the morphospace (Fig. 5). Expansion factors were calculated in each cell of the 20 line by 20 line grid (19 cells by 19 cells) and are displayed in cool and warm colors indicating contraction and expansion, respectively. Positive PC 1 values correspond with a deep pallial sinus, while negative PC 1 values correspond to a shallow pallial sinus. The deepened pallial sinus is the result of posterior expansion and anterior contraction, while the shallower pallial sinus is due to the opposite pattern: anterior expansion and posterior contraction (Fig. 5). The strong visual difference in expansion and contraction of the anterior and posterior portions of the shell along PC 1 could also indicate diverging size patterns of the adductor muscles. Morphological variation along the PC 2 axis is more subdued and is related to dorsal expansion, with negative PC 2 values and ventral expansion corresponding to positive PC 2 values. The comparison of 3D models demonstrates that positive PC 1 values are associated with flatter shells with an elevated central interior surface and depressed commissural margin, whereas negative PC 1 values are associated with deeper valves with a depressed central interior surface and elevated commissural margin. Morphological differences along the PC 2 axis are less clear than those in PC 1, but generally illustrate depressed ventral margins with positive PC 2 values and possibly elevated ventral margins with negative PC 2 values.
Comparison of morphological exemplars. A, Thin-plate spline analyses of select valves compared with the mean landmark morphology. Color grid indicates expansion factor of area within each grid cell (expansion in warm colors and constriction in cool colors). Landmarks are indicated by black dots and are connected by black lines. B, Vertical surface deviation between PC 1 exemplars and PC 2 exemplars. Green indicates positive offset; red indicates negative offset.

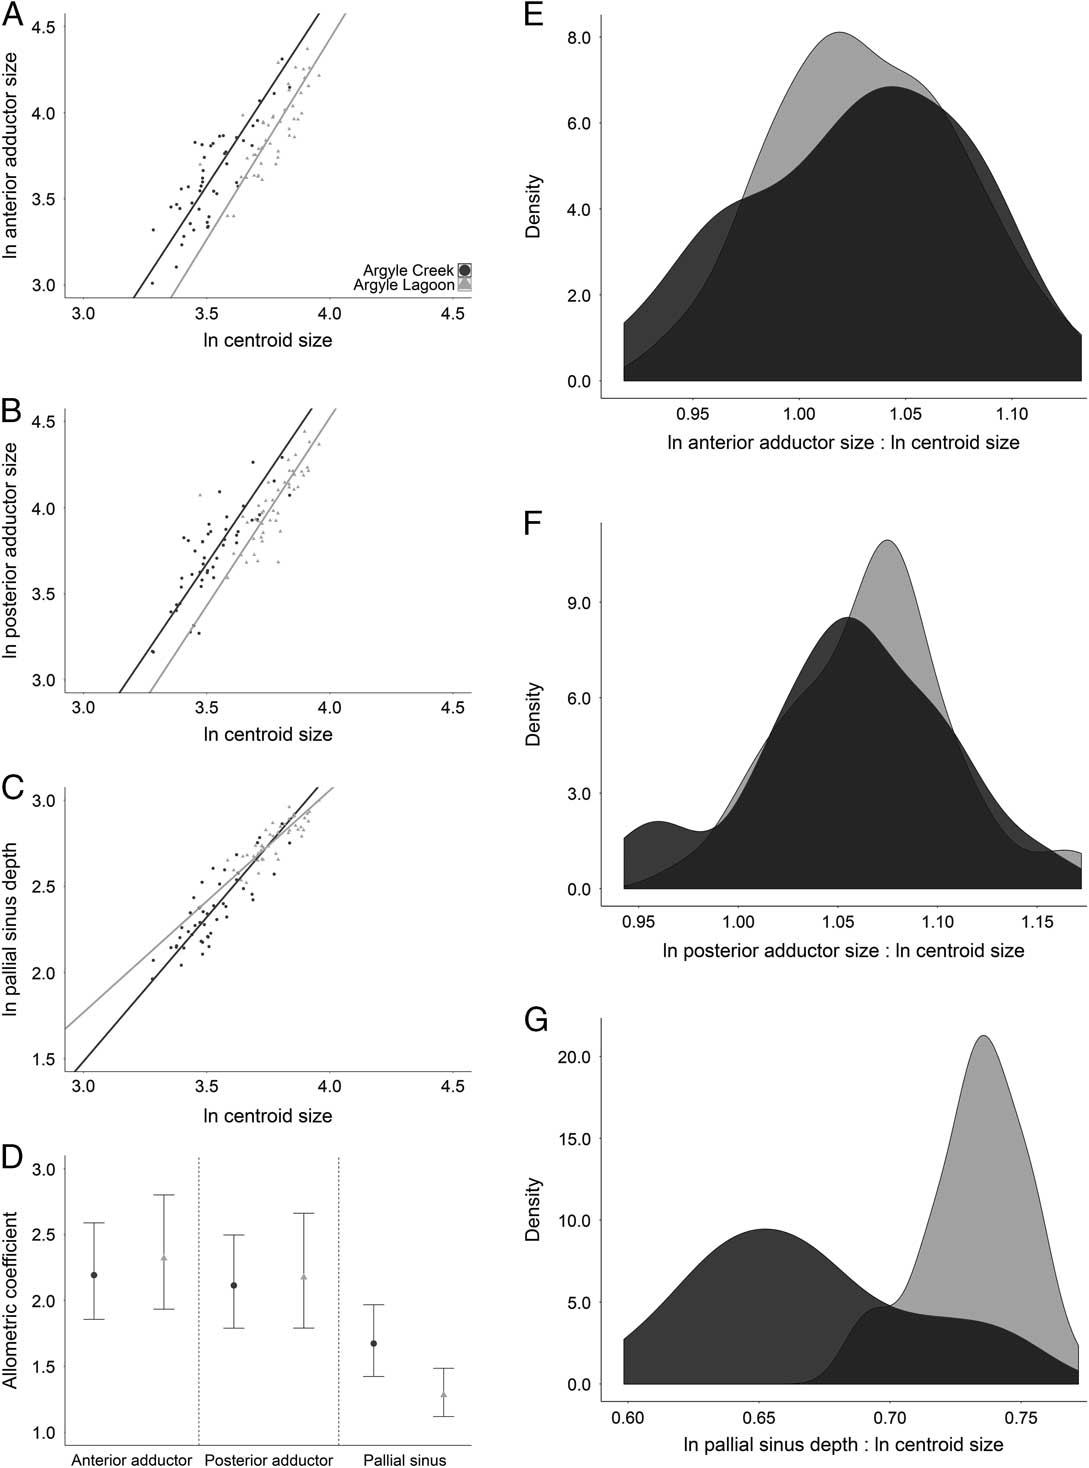
The allometric coefficients of both anterior and posterior adductor muscle scars are statistically indistinguishable between live-collected specimens from AC and AL (Fig. 6). Similarly, the ratios between natural log-transformed muscle scar area and natural log-transformed centroid size are also indistinguishable between the creek and lagoon (Mann-Whitney U, p anterior=0.72 and p posterior=0.33). The allometric coefficient of the pallial sinus in creek live specimens is significantly larger than that of lagoon counterparts (Fig. 6). The ratio between the natural log-transformed pallial sinus length and natural log-transformed centroid size is significantly smaller for creek specimens than for those from the lagoon (Mann-Whitney U, p=7.37×10⁻¹¹; Fig. 6).
Morphological analysis of adductor muscle scar area and pallial sinus length of live-collected valves from AC and AL. A, Biplot and reduced major axis (RMA) regression model of anterior adductor muscle scar area and centroid size. B, Biplot and RMA of posterior adductor muscle scar area and centroid size. C, Biplot and RMA of pallial sinus length and centroid size. D, Allometric coefficients and bootstrapped 95% confidence intervals of adductor muscle scars and pallial sinus. E, Density distributions of natural log anterior adductor area:natural log centroid size. F, Density distributions of natural log posterior adductor area:natural log centroid size. G, Density distributions of natural log sinus length:natural log centroid-size ratios. Argyle Creek in dark gray; Argyle Lagoon in light gray.

Discussion
Spatial Variation of Body Size and Live–Dead Fidelity
Live-collected specimens from the creek were significantly smaller than their live-collected counterparts from the lagoon (Fig. 3). Huntley (Reference Huntley2007) first reported this pattern and speculated that it could be due to a number of non–mutually exclusive factors:
1. stress in creek clams due to the inability to burrow in the gravel substrate and occasional subaerial exposure;
2. higher trematode prevalence in creek clams relative to lagoon clams;
3. increased susceptibility to durophagous predators like crabs, birds, and raccoons as the combined result of forced epifaunality and higher boring spionid prevalence (thereby weakening shells) among creek clams relative to lagoon clams;
4. variation influenced by differing hydrodynamic regimes in the creek and lagoon; and
5. the samples representing two distinct cohorts.
It is difficult to test among these options without specific knowledge of the ontogenetic age of individuals and differences in predation intensity by durophagous predators between the creek and lagoon environments. Growth increments are not reliable indicators of ontogenetic age in L. staminea (Berta Reference Berta1976; Hughes and Clausen Reference Hughes and Clausen1980), and calculating age estimates via stable isotope geochemistry is beyond the scope of this project. Further, these are either live-collected or whole dead-collected valves and would not provide a reliable record of durophagous predation intensity. Acquiring such data would necessitate extensive field observations, because most durophagous predators in question (i.e., birds and raccoons) remove prey items from this environment.
In general, the habitat-based discrepancy in L. staminea body size identified in the live-collected samples is preserved in the death assemblages. Both creek death assemblages, indistinguishable from one another, are significantly smaller than the lagoon surface death assemblage; however, they are larger than the spit-side channel death assemblage from the lagoon. This discrepancy is likely attributable to the preferential transport of smaller creek clams into the lagoon during flood tide as indicated by the general morphology of shell accumulations where the channel enters the lagoon (similar to a flood-tide delta). Notably, the median sizes of creek death-assemblage bivalves are significantly larger than live-collected creek clams. Similarly, the ALs death assemblage is, on average, significantly larger than the live clams from the lagoon. These results suggest that death assemblages accumulate a greater range of body-size variation than seen in the ecological snapshot of live-collected specimens—presumably a signal of time averaging superimposed onto that of environmentally influenced size distinctions.
Spatial Variation of Morphology and Live–Dead Fidelity
The size-free morphological analysis via PCA of Procrustes-transformed 2D landmark data indicates significant differences in bivalve morphology between samples. This discrepancy is most apparent when comparing the central tendency and distribution of live-collected specimens. Live specimens from the lagoon have significantly more positive PC 1 values than corresponding live-collected creek specimens (Fig. 4). Moreover, the variation of PC 1 values for live lagoon specimens is less than that of the creek specimens. This variance of lagoon specimens is much less (<<99% CI) than expected by random chance (Table 4). The morphological variability of AC clams is elevated, by comparison, and falls within the confidence intervals calculated by the randomization. These findings suggest that live creek and lagoon clams were either not drawn from a single population or they were sorted during life. Contrary to the findings of Lazo (Reference Lazo2004), there are strong morphological differences between L. staminea individuals living in the lagoon versus those that live in the creek. It seems that morphological variation is quite low when the clams are allowed to occupy their preferred infaunal life mode in the lagoon, but there is a significant shift in median morphology and an increase in morphological variance when the clams are restricted to epifaunal life modes in the gravel substrate of the creek. These results provide strong evidence for morphological differences in bivalves occupying spatially proximal habitats of strongly diverging substrate types and hydrodynamic regimes (Huntley Reference Huntley2007).
Similar to the results for body size, and also contrary to the suggestion of Lazo (Reference Lazo2004), the spatial distribution of diverging morphologies is broadly preserved within the death assemblages. Median PC 1 scores decrease in value from the lagoon surface to the creek death assemblages, though the differences among the downstream creek, upstream creek, and lagoon spit-side channel samples are statistically indistinguishable.
The Accumulation of Variance in Death Assemblages and Implications for the Fossil Record
The variation of both body size and morphology was generally greater in death assemblages than in living organisms. The variance values of body size for both live-collected samples fell below the randomization-derived 99% confidence intervals, while all death assemblages, except ALs, fell within the confidence intervals, indicating substantially lower variation among the living. This result is expected, because death assemblages are likely time averaged, comprising individuals from many generations. This pattern could have been further promoted by a seasonal bias in sample collection, typically in summer. Perhaps the live-collected clams would have been larger on average if collected later in the season.
Elevated body-size variation among creek death assemblages could indicate spatial mixing of bivalves from the creek and lagoon. Alternatively, increased variation could be the result of more extensive time averaging in Argyle Creek than in Argyle Lagoon. Lazo (Reference Lazo2004) demonstrated higher taphonomic scores (poor preservation) for both live and dead clams from Argyle Creek relative to those from the lagoon, suggesting that fossilization potential, and thus time averaging, was greater for lagoon clams and less for creek clams. This serves as an argument against increased time averaging in the creek resulting in greater size variability. Body-size variation values in the spit-side channel and lagoon surface death assemblages were less than the 95% and 99% confidence intervals, respectively. The lagoon surface sample location has a fine-grained substrate, suggesting low hydrodynamic energy and little spatial averaging due to physical processes. The geomorphology of the spit-side channel, however, suggests an influx of material from the creek into the margin of the lagoon contrary to the low variation in body-size values.
The elevated PC 1 variance values for the creek and spit-side channel death assemblages, which fall within the 95% confidence intervals, could also be the result of increased time averaging in the higher-energy environments, but again this seems unlikely, as Lazo (Reference Lazo2004) reported significantly poorer preservation among creek clams. Instead, the increased morphological variance values among these three death assemblages likely result from spatial mixing due to shell transport in these higher-energy environments. Such an interpretation is consistent with a considerably lower variance value (<lower 95% CI) of the lagoon surface death assemblage sourced from a low-energy setting that likely experienced very little shell transport. The similarly muted morphological variance values for the living lagoon clams and the lagoon surface death assemblage are consistent with the results of Krause (Reference Krause2004) that demonstrated statistically nonsignificant differences in brachiopod morphology between live-collected and death-assemblage specimens in deeper-water settings in the nearby San Juan Channel. Despite the significant difference in median PC 1 scores of live creek and live lagoon clams, there is substantial overlap of creek clams in the morphospace occupied by lagoon clams, suggesting that some individuals developed the typical morphology living in the lagoon and were then transported in vivo to the creek (Fig. 4). Potential sources for shell transport mechanisms include elevated water energy; activities of predators, including raccoons and birds (Stempien Reference Stempien2007); and an extensive history of experimental and research activities at the location. Despite this hypothesized transport, in vivo morphological variation among sample sites is generally preserved in death assemblages.
It is notable that such strongly diverging intraspecific patterns in body size and morphotypes related to environmental gradients are produced over such small spatial scales (a few tens of meters). The accumulation of greater variation within death assemblages from that found among ecological snapshots of live-collected specimens results from the superimposition of a time-averaging signal onto environmentally influenced, perhaps ecophenotypic, patterns of size and shape. This accumulation is even more remarkable when one considers the small amount of time over which these death assemblages have been accumulating. Argyle Lagoon is an anthropogenic feature demarcated from the waters of North Bay by the construction of two spits connected to what was once an island (Little Island). It is even more remarkable that these spatial patterns can be recorded in the incipient fossil record of a dynamic intertidal environment, suggesting similar patterns could be preserved at a comparable spatial scale in the fossil record.
Parasitism, Body Size, and Morphology
Digenean trematode parasites in the family Gymnophallidae are known to induce the growth of pits with raised rims on the interior of their bivalve hosts (Ruiz and Lindberg Reference Ruiz and Lindberg1989; Huntley and De Baets Reference Huntley and De Baets2015). These parasites are known to affect their hosts in a number of deleterious ways, including inducing dwarfism or gigantism, castration, and increasing susceptibility to predators (Swennen Reference Swennen1969; Lim and Green Reference Lim and Green1991; Ballabeni Reference Ballabeni1995; Taskinen Reference Taskinen1998; Hechinger et al. Reference Hechinger, Lafferty, Mancini, Warner and Kuris2009). Within a given sample, bivalves with trematode-induced pits tend to be larger than those without (Huntley and Scarponi Reference Huntley and Scarponi2012; Huntley and De Baets Reference Huntley and De Baets2015; Scarponi et al. Reference Scarponi, Azzarone, Kowalewski and Huntley2017), but this is likely due to hosts accumulating parasites through ontogeny rather than a preference of the parasites. Though creek clams are significantly smaller than lagoon clams, there was no significant difference in size between infested and noninfested clams in either the creek or lagoon live-collected samples (Huntley Reference Huntley2007). The median PC 2 score for parasitized individuals was significantly lower in the lagoon and higher in the creek, respectively, versus nonparasitized individuals (Fig. 4). While these differences in morphology are statistically significant, the fact that they differ in opposite ways between environments suggests that the morphological discrepancies between parasitized and nonparasitized individuals are not ecologically significant. We did not examine death assemblages for parasitic traces due to their comparatively poor preservation. In sum, trematode parasites seem to have little influence on the morphology of L. staminea; rather, the morphological variation among creek and lagoon individuals is likely due to differences in environmental and ecological factors, such as hydrodynamic and substrate regimes.
Ecophenotypy, Substrate Heterogeneity, Functional Morphology, and Physiological Trade-Offs
Ecophenotypy refers to the physical characteristics or behaviors of organisms that result from environmental and/or ecological conditions and not from genetic expression. Do the Argyle clams represent a case of ecophenotypic variation? If so, one would expect that creek and lagoon clams would have the same genotype and express different phenotypes due to environmental disparity. An alternative hypothesis, in which there are two genotypes of clams with distinct phenotypes (blade-shaped and barrel-shaped) experiencing differential recruitment success in the creek and lagoon, could explain the morphological variation without ecophenotypy. While genetic data are not available for these specimens, their physical proximity suggests that the populations are not genetically isolated and were sourced through the same spat-fall events. In this case, ecophenotypy is the most parsimonious interpretation.
Ecophenotypic variation can be related to the functional morphology of the organism and physiological trade-offs (e.g., Bottjer Reference Bottjer1980). Bivalves have long served as model organisms for studies in skeletal functional morphology owing to easily observable anatomical features that relate to soft tissue anatomy and physiological function (Stanley Reference Stanley1970). The thin-plate spline analyses and the comparison of 3D models (Fig. 5) of four select valves allow us to elucidate the nature of size-free morphological variation along the PC 1 axis. Positive PC 1 values (typical of lagoon bivalves) are characterized by a deep pallial sinus and contraction of the anterior portion of the shell, the latter of which is directly related to landmarks on the adductor muscle scar. Conversely, specimens with negative PC 1 values (typical of creek bivalves) are characterized by a much shallower pallial sinus and anterior expansion of the shell. Pallial sinus length, relative to overall body size, is positively correlated with the size of the bivalve’s siphons and its burrowing depth (Stanley Reference Stanley1970). It follows that lagoon bivalves, which are able to freely burrow in fine-grained substrate, have relatively longer siphons than bivalves occupying the rocky substrate of Argyle Creek in a state of forced epifaunality. We interpret the relatively long pallial sinus of lagoon clams to be the typical morphology of L. staminea and the reduced pallial sinus of creek clams to be an ecophenotypic variant.
Perhaps nonburrowing creek bivalves divert energy from growing unnecessarily large siphons into other anatomical features that help them cope with elevated water energy and an imposed epifaunal life mode. A visual examination of the expansion factors from the thin-plate spline analyses (Fig. 5) could suggest differences in the relative size of posterior and anterior adductor muscle scars by environment. However, there is no significant environmental variation in the allometric coefficient of either the anterior or posterior adductor muscle scars as indicated by nearly identical reduced major axis (RMA) regression slopes (Fig. 6). This observation is further illustrated by no significant difference in median natural log muscle scar area:natural log centroid-size ratios by environment (Fig. 6). Any seeming morphological dissimilarity between creek and lagoon clams in the allometric analysis of muscle scars is the result of significant body-size differences between the two populations (Figs. 3, 6). Indeed, the lagoon clams are larger, on average, than the creek clams. There is, however, a significant difference in the allometric coefficient of the pallial sinus between creek and lagoon populations (Fig. 6) that is not the spurious result of differences in body size, as also similarly illustrated by the significant difference in median natural log sinus length:natural log centroid-size ratios (Fig. 6).
The analyses conducted thus far have been based upon reduced dimensionality of 3D objects projected onto 2D planes. The comparison of 3D models derived from handheld laser scanning (e.g., Motani Reference Motani2005; Adams et al. Reference Adams, Strganac, Polcyn and Jacobs2010; Platt et al. Reference Platt, Hasiotis and Hirmas2010) can provide a more complete view of morphological change between populations. Specifically, a technique commonly used for tolerance analysis in manufacturing, wherein the topographic deviance between the surfaces of two comparable 3D objects is quantified. In addition to illustrating the strong difference in relative pallial sinus length between the two PC 1 exemplar specimens, the surface comparisons reveal that high PC 1 scores (typical of lagoon bivalves, ALs16 vs. AC17; Fig. 5) are associated with an interior surface that is elevated in the center and suppressed along the commissural margin. Conversely, low PC 1 scores (typical of creek bivalves, AC 17 vs. ALs16; Fig. 5) have a topographically lower center interior surface and slightly elevated commissural margin. In other words, the burrowing lagoon clams have a more compressed obesity index (height/width), and epifaunal creek clams tend to be more inflated. The trends in 3D morphology along PC 2 are less straightforward. Stanley (Reference Stanley1970) demonstrated that rapid-burrowing bivalves tend to be shaped like disks, blades, or cylinders (i.e., relatively compressed like the burrowing lagoon clams), and slow burrowers tend to have spherical forms, similar to creek clams. We suggest that the lack of opportunity to burrow alone is not enough to induce such ecophenotypic variation. Rather, we hypothesize that the more inflated morphology of creek clams functions to increase shell strength and stability in a high-energy environment on a rocky substrate.
Conclusions
Common suspension-feeding intertidal bivalves from the northern Pacific coast of the United States display strong variation in size and morphology within a few tens of meters of one another. This variation is related to stark divergences in environment and life mode. Live-collected infaunal bivalves in a fine-grained, low-energy lagoon are larger, more compressed, and have relatively larger siphons than their conspecific counterparts that are forced to be epifaunal in a high-energy, rocky tidal creek. The fidelity of ecophenotypy is quite high, and these results demonstrate the potential for being recorded in the fossil record. Generally, a greater variation in size and shape is recorded in the death assemblages relative to the live-collected specimens. The increase in variance of size and shape, the expected result of temporal and spatial averaging, is likely due in this case to the mixing of multiple generations of individuals, shell transport via hydrodynamics and predatory activities, and temporal limitations on sampling the live fauna. We suggest that the ecophenotypic variation documented in this case study is induced by strong differences in water energy and substrate type and results in physiological trade-offs that divert energy from the growth of an organ associated with feeding, respiration, and burrowing to a morphology that promotes stability and strength.
Acknowledgments
We gratefully acknowledge the constructive comments of T. Olszewski, a second anonymous reviewer, and M. Patzkowsky (editor). This work has been generously supported by the Peck and Sando Scholarship Funds of the Department of Geological Sciences at the University of Missouri (to T.D.A.) and the G. Ellsworth Huggins Scholarship of the University of Missouri (to J.S.B.). J.W.H. is supported by the National Science Foundation EAR CAREER-1650745. J.D.S. is supported by the National Science Foundation EAR CAREER-1652351 and EAR/IF-1636643.
Supplementary material
Data available from the Dryad Digital Repository: https://doi.org/10.5061/dryad.2bs5231