

Women are underrepresented at all levels of elective office in American government for various reasons (Bauer Reference Bauer2015), and the public has different views of the abilities and traits of male and female politicians (Dolan and Lynch Reference Dolan and Lynch2014). On overt bias, the Center for American Women and Politics reports that women held fewer elective offices than men in 2016: 19.6% of congressional seats, 20% of U.S. Senate seats, and 24.4% of state legislature seats.Footnote 1 More insidiously, and directly relevant to the current study, women may experience suggestions that their opinions and competences are not valued as much as those of men. For example, in a classic study, Huddy and Terkildsen (Reference Huddy and Terkildsen1993) find that “masculine” traits increase a candidate's perceived competence on a broad range of issues compared with “feminine” traits of warmth and expressiveness. This is crucial as studies show competence is one of the most important traits for the evaluation of politicians (Laustsen Reference Laustsen2014). In addition, Dolan and Lynch (Reference Dolan and Lynch2016) note that previous research indicates that voters are more likely to apply male stereotypes to candidates for high-level offices.
The present article examines the persuasiveness potential of male and female election candidates based on voters’ evaluations of them as credible sources. Persuasion can be defined as an attempt to influence a person's (here, a voter's) beliefs, intentions, and ultimate (voting) behavior. Persuasiveness potential is thus the possible ability to do so. If political candidates are seen as highly credible sources, voters increase their intention to (are persuaded to) vote for them in elections (Housholder and LaMarre Reference Housholder and LaMarre2014). The persuasion literature shows that appeals from a highly credible speaker increase the acceptance of that candidate's statement (Chaiken and Maheswaran Reference Chaiken and Maheswaran1994; Petty and Cacioppo Reference Petty and Cacioppo1984; Pornpitakpan Reference Pornpitakpan2004; Tormala and Clarkson Reference Tormala and Clarkson2007). Adding to this, the present article examines whether voters revise their beliefs differently given the sex of the candidate. It also examines whether the sex of the voter has an impact on belief revision. To the best of our knowledge, such a dual investigation has not been reported in the literature. In addition, the article contributes a novel methodological approach, a Bayesian analysis of belief updating and thus persuasion. This allows for a formal and normative method for testing overt and covert belief discrimination, which is a novel use of Bayesian predictions.
The next sections provide an outline of the academic discussion concerning the impact of gender stereotypes on voting and the Bayesian approach to reasoning. After formulating hypotheses, the empirical methodology of the study is explained. The results section explores the impact of the sex of candidates as well as voters. Finally, the discussion section interprets the findings and their implications for future research as well as political decision makers.
THE IMPACT OF GENDER STEREOTYPES ON VOTING
Female political candidates are generally seen as being more concerned with “women's issues” such as children, health, poverty, and education and as having personal traits such as being compassionate, honest, trustworthy, willing to compromise, and more empathetic, whereas men are typically viewed as stronger leaders, more decisive, more self-confident, and better able to handle a crisis (Dolan Reference Dolan2014; Dolan and Lynch Reference Dolan and Lynch2014; Holman, Merolla, and Zechmeister Reference Holman, Merolla and Zechmeister2011; see Schneider and Bos Reference Schneider and Bos2014 for a more extensive review of the literature on gender-based stereotypes). Laustsen (Reference Laustsen2017) argues that voters may prefer powerful and strong candidates if they seek protection against a threatening environment or so-called warm candidates if they see the world as more peaceful. The context matters (Holman, Merolla, and Zechmeister Reference Holman, Merolla and Zechmeister2011). The personal qualities of candidates are therefore important when voters assess the argumentation of candidates and choose a candidate.
The process through which voters reach a decision has been discussed in the literature. Some authors point out that a voter may first choose a political party and then the actual candidate (Dolan Reference Dolan2014). The impact of gender stereotyping therefore may differ depending on the actual candidate's political party, or it may be nonexistent if that particular political party has only one candidate. If voters have a choice, Meeks (Reference Meeks2012) argues, they will evaluate the candidates’ abilities to handle political issues as well as their personal characters before deciding. However, despite numerous studies in the past, Laustsen (Reference Laustsen2017, 883) notes that “the mechanisms through which voters are attracted to certain candidates and not to others remain largely unresolved.” The present study aims to contribute to filling this gap in knowledge by exploring how gender issues impact the persuasiveness potential of male and female candidates. In the literature, there are no unanimous conclusions regarding how gender stereotyping affects voter reasoning and decision-making. As outlined here, some authors argue that gender stereotyping does not lead to bias against female candidates, whereas other authors find evidence that such biases do exist.
Evidence against Bias Impact of Gender Stereotyping
Ditonto, Hamilton, and Redlawsk (Reference Ditonto, Hamilton and Redlawsk2014) report that survey-based studies often do not find overt bias toward women, but experimental studies often find differences due to gender issues. Dolan (Reference Dolan2014) expands this argument by pointing out that voters may discriminate when they are exposed to abstract candidates in an experiment, but in real-world situations, voters evaluate individuals, not abstractions. The qualities of an actual candidate are known to voters, who will then relate to that person and not to an abstraction. For that reason, Dolan argues, gender stereotyping will be less important in real-world evaluations. Dolan's study supports the position that gender stereotypes are not decisive for candidate evaluation and voting decisions.
Meeks (Reference Meeks2012) shows that overall news coverage emphasizes women's novelty more than men's, and, regardless of perceived gender congruence, women receive more political issue and character trait coverage than men. This indicates that female candidates should not necessarily be disfavored when they run for office. Holman, Schneider, and Pondel (Reference Holman, Schneider and Pondel2015) find that although candidates of either gender can use so-called identity-based ads (appeals based on emotional attachment) to affect women's votes, only female candidates are able to prime female voters’ gender identity. Male voters are generally unaffected by such appeals. This indicates that female candidates may have advantages in some respects but disadvantages in other types of campaigning.
In a recent experimental study, Coffé and Theiss-Morse (Reference Coffé and Theiss-Morse2016) find no differences between male and female candidates with regard to voters’ perception of their competence; rather, the authors find that occupational background is more important. Bauer (Reference Bauer2015) carried out a major experimental and observational study and argues that it is faulty to assume that stereotypes of women always matter. She finds that stereotypes only have an impact if they are activated during the election campaign. The literature thus provides several examples of studies that support the notion that gender stereotyping does not have any decisive negative impact on voters’ beliefs about female candidates or on their voting behavior.
Evidence Supporting Impact of Gender Stereotyping
Other studies, however, provide evidence for the opposite and identify several mechanisms through which gender stereotyping has a negative impact for female candidates. Smith, Paul, and Paul (Reference Smith, Paul and Paul2007) examined candidates for presidential elections. Using a single candidate design, they find support for the hypothesis that gender bias is a significant obstacle for women presidential candidates. Such obstacles may be attributed to voters’ perceptions of women candidates. Similarly, Carlin and Winfrey (Reference Carlin and Winfrey2009) show that Hillary Clinton and Sarah Palin experienced a considerable amount of negative coverage that may have discredited their suitability for office when campaigning against male candidates in 2008. Supporting this, Paul and Smith (Reference Paul and Smith2008) find that women presidential candidates are viewed as significantly less qualified to be president compared with male candidates with similar credentials.
Based on their empirical study, Schneider and Bos (Reference Schneider and Bos2014, 260) argue that female politicians are defined more by their deficits than by their strengths. In addition to failing to possess the strengths associated with being women (e.g., sensitive or compassionate), female politicians lack leadership, competence, and masculine traits in comparison with male politicians. Holman, Merolla, and Zechmeister (Reference Holman, Merolla and Zechmeister2011) draw similar conclusions, finding that a context of terror threat caused voters to prefer male political leaders. This result confirms the gender stereotypes mentioned earlier since voters should be expected to prefer strong leaders in a threatening context of terror.
Only few studies have examined the persuasiveness potential of male and female election candidates. Cavazza and Guidetti (Reference Cavazza and Guidetti2014) find that a candidate's use of swear words in a blog post improves impressions about the source. The effect is particularly strong when the candidate is a man. Hansen and Otero (Reference Hansen and Otero2006) find that female politicians seem to gain advantages if they prove to be “tough” and, at the same time, signal care and compassion. Lee (Reference Lee2014) finds that female candidates can increase voter intentions by focusing on “soft” issues, while it is more advantageous for male candidates to focus on “hard” issues. On the other hand, an experimental study by Bernstein (Reference Bernstein2000) suggests that message explicitness on a stereotypically male policy area (crime in that study) seems to be more important for female candidates. In a similar vein, an experimental study by Leeper (Reference Leeper1991) indicates that it may be optimal for female candidates to apply a “masculine” approach in their campaign.
Madsen (Reference Madsen, Papafragou, Grodner, Mirman and Trueswell2016) examines the persuasiveness potential of candidates from the American race for the presidential nomination for the 2016 election. The results suggest no overt gender differences. However, male voters were significantly less convinced by policies proposed by Hillary Clinton compared with female voters despite the fact that male and female voters did not differ in prior beliefs regarding Clinton's (or any other the other candidates’) trustworthiness and expertise. This pattern is not observed for any of the male candidates used in the study, suggesting covert reasoning discrimination.
As demonstrated earlier and pointed out by Bauer (Reference Bauer2015), the literature remains inconclusive concerning the influence of the sex of political candidates and of gender stereotypes on candidate evaluation and voting decisions.
VOTER REASONING—A BAYESIAN APPROACH
The present study contributes to the exploration of voter reasoning bias by testing voters’ evaluations of the persuasiveness potential of female and male candidates in an experimental setting. It builds on studies in argumentation and reasoning that have sought to formalize the impact of source credibility (Hahn, Harris, and Corner Reference Hahn, Harris and Corner2009) on beliefs, intentions, and behavior. It applies a Bayesian normative model in an attempt to uncover whether voters evaluate the persuasiveness potential of female election candidates differently than identical male election candidates. Bayesian modeling has been applied in numerous reasoning, argumentation, and decision-making studies, but to our knowledge it has never previously been used as a method to detect possible reasoning biases and discrimination regarding voting for political candidates. Therefore, the present article contributes a novel methodology that has proven its value in many other settings concerning argumentation and persuasion.
Many situations necessitate or even warrant reliance on information from sources. First, in situations in which a person has no access to evidence or information, reliance on credible sources is a reasonable strategy. Second, in situations in which the evidence is too complex for an unskilled person to interpret, reliance on expert sources is a reasonable strategy. Third, in situations in which the experiences of others may reasonably substitute for firsthand evidence, reliance on their testimonies is a good strategy. All three conditions are often present when ordinary voters shape their beliefs about political issues.
The fact that reliance on evidence presented by political candidates can be a rational and entirely reasonable information strategy for voters suggests that they need to assess whether a particular political candidate is a credible source for the particular problem at hand. Credibility has been defined as the amalgamation of perceived expertise and trustworthiness (see Harris et al. Reference Harris, Hahn, Madsen and Hsu2015 for the formal integration of source credibility within a Bayesian framework). Expertise refers to the degree to which the source is believed to have access to accurate information for the specific domain in question and therefore has the ability to tell the truth. Trustworthiness refers to the degree to which the source is believed to have the intention to transmit the information as faithfully as possible and to the best of the source's ability. That is, expertise refers to the capability to provide relevant information, while trustworthiness refers to the intention to do so.
Crucially, framing these probabilistically (0–1) in a Bayesian framework allows for normative predictions against which responses can deviate and be checked (see Table 2). If observed beliefs depart significantly from the normative predictions, one may say the observation has deviated from rational norms. This further allows for quantitative comparisons of deviations such that some observations may be in line with normative predictions, some may deviate slightly (e.g., update beliefs less strongly than normative predicted), and others may deviate strongly. Using a Bayesian normative framework allows for comparisons of belief revision processes, not only between observations (e.g., a high-credibility female candidate compared with high-credibility male candidate) but also in relation to normative standards.
The probabilities elicited in such studies are individual and subjective, so estimations of source credibility are voter dependent. That is, two voters can see the same message from the same election candidate and update their posterior beliefs differently if they disagree on the credibility of the source or the likelihood of the evidence before reading any statements. Concretely, if Person A and Person B disagree fundamentally on whether, for example, Hillary Clinton or Donald Trump is credible, they should update their beliefs differently when encountering statements from them.
Paralleling this approach, the stereotype content model (SCM) divides person perceptions into two broad categories: warmth (analogous to trustworthiness) and competence (analogous to epistemic expertise). This definition has been tested repeatedly in social psychological literature (e.g., Cuddy, Glick, and Beninger Reference Cuddy, Glick and Beninger2011; Cuddy et al. Reference Cuddy, Fiske, Kwan, Glick, Demoulin, Leyens and Bond2009; Fiske, Cuddy, and Glick Reference Fiske, Cuddy and Glick2007). In line with findings from reasoning and persuasion studies, a person who is perceived as warm and competent is more likely to elicit positive responses, while low warmth and competence elicit less positive responses, and mixed person perceptions elicit intermediate responses (Fiske and Cuddy Reference Fiske, Cuddy and Guimond2006).
The Bayesian approach therefore examines the persuasive potential—that is, the extent to which a voter may be convinced/persuaded by a particular election candidate's argument. In this framework, expertise thus refers to the capability to provide good information, while trustworthiness refers to the intention to do so. A political candidate who is perceived to have high trustworthiness and high expertise should have higher credibility and persuasiveness potential according to this normative model.
HYPOTHESES
Several studies have explored the function of stereotyping and implicit biases in reasoning, judgment, and decision-making. For example, Rodeheffer, Hill, and Lord (Reference Rodeheffer, Hill and Lord2012) and Krosch and Amodio (Reference Krosch and Amodio2014) report that white participants identify more mixed-race images as “black” when they are primed to think of economic scarcity. Payne (Reference Payne2001) shows that participants are more likely to identify objects as weapons when those images are juxtaposed with black faces. White participants respond differently to poverty-related news reports on black and white children when the former is explained in relation to personality terms, while the latter is explained in relation to structural or social terms (Iyengar Reference Iyengar1991). Of particular relevance to the current study, Neal and colleagues (Reference Neal, Guadagno, Eno and Brodsky2012) explore effects on mock jurors’ perceptions of male and female witness credibility. They report that witnesses scoring high in likeability and knowledge are assessed equally well regardless of sex. However, for low likeability or knowledge, males score better than females. Other studies suggest similar effects, with females judged more critically than males (e.g., Larson and Brodsky Reference Larson and Brodsky2014; Rudman and Kiliansky Reference Rudman and Kiliansky2000; for a review of the literature, see Neal et al. Reference Neal, Guadagno, Eno and Brodsky2012). The foregoing studies suggest that male and female statements are valued differently.
The current study departs from Neal and colleagues in three ways. First, it tests the impact of the sex of the candidate as well as the voter (male or female election candidates and voters). Second, it deals with the persuasiveness potential of political candidates rather than estimations of witnesses. Finally, it deals with political persuasiveness potential rather than legal settings and presents complex sources with different qualities rather than single-facet sources. In continuation of the foregoing discussions, we test the following distinct hypotheses concerning gender stereotyping.
The Impact of Candidate Sex
The findings reported by Neal et al. (Reference Neal, Guadagno, Eno and Brodsky2012) indicate that males and females are judged equally if they have high expertise as well as trustworthiness. Therefore, we predict the following:
H 1:
Highly credible (high expertise and high trustworthiness) female and male candidates will have the same persuasiveness potential at the population level, as measured by voters’ posterior beliefs.
However, the findings by Neal et al. show that females may be evaluated more negatively if the condition of high expertise as well as trustworthiness is not present. Accordingly, we predict the following:
H 2:
Female candidates have lower persuasiveness potential than identical male candidates for other source conditions (high expertise and low trustworthiness, low expertise and high trustworthiness, or low expertise and low trustworthiness).
The latter hypothesis is tentative, as the studies that motivate it are from legal settings, and the impact of source credibility may differ when the setting is politics.
The Impact of Participant/Voter Sex
Discrimination of sources/election candidates based on the sex of participants/voters may be manifested in two distinct ways. First, male and female voters may have different perceptions of how persuasive a particular candidate is in general (i.e., both male and female voters discriminate against a certain source). In our case, this translates into differences in expressed posterior beliefs between male and female voters when they evaluate the persuasiveness potential of candidates with different types of credibility. As mentioned earlier, previous research has demonstrated that males generally emphasize expertise more than females and vice versa when it comes to trustworthiness. Our hypothesis is as follows:
H 3:
Male voters will emphasize the expertise dimension of credibility more than female voters, whereas female voters will emphasize trustworthiness more than male voters.
Joint Impact of Candidate and Participant/Voter Sex
Finally, the sex of the source/election candidate may impact male and female voters differently. That is, although no population difference is observed between male and female candidates, internal differences may be registered for male and female voters’ reactions to male and female candidates. Previous findings (Madsen Reference Madsen, Papafragou, Grodner, Mirman and Trueswell2016) indicate that discrimination will be most obvious when males react to the expertise dimension related to female candidates. We predict that
H 4:
Male voters will discriminate against female candidates. In particular, we expect that male participants/voters will discriminate against female candidates with high expertise.
This means that differences may emerge in posterior beliefs even if voters agree on candidate expertise. The hypothesis suggests a subtler discrimination (e.g., a person may believe that a woman is as qualified as a man but may still be less convinced by the woman).
METHOD
Participants were recruited using Mechanical Turk (see Paolacci, Chandler, and Ipeirotis Reference Paolacci, Chandler and Ipeirotis2010 for analyses of the validity of MTurk participants for social science experiments). Two participant filters were applied: participants had to be aged 18 or older and American citizens. By answering the questionnaire, all participants expressed consent since the introduction as well as the debriefing informed them about the study and its purpose. The participants’ privacy and anonymity were fully secure, as no one knew the identity of each participant, and all entries were assigned a randomized code that could not be tracked back to the participant. A total of 202 participants completed the questionnaire, 103 women and 99 men. Participant age ranged between 19 and 75; the average age was 40.1 years (SD = 13.4). Respondents were paid an equivalent of $9 per hour to participate. Data were collected from October 27 to November 1, 2015.
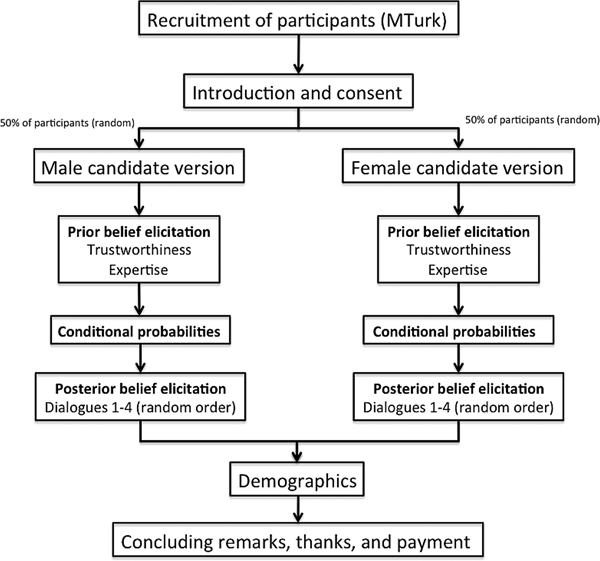
The flow of the survey experiment is outlined in Figure 1 and explained in depth in the next section.
The flow of the survey experiment.

DESIGN AND PROCEDURE
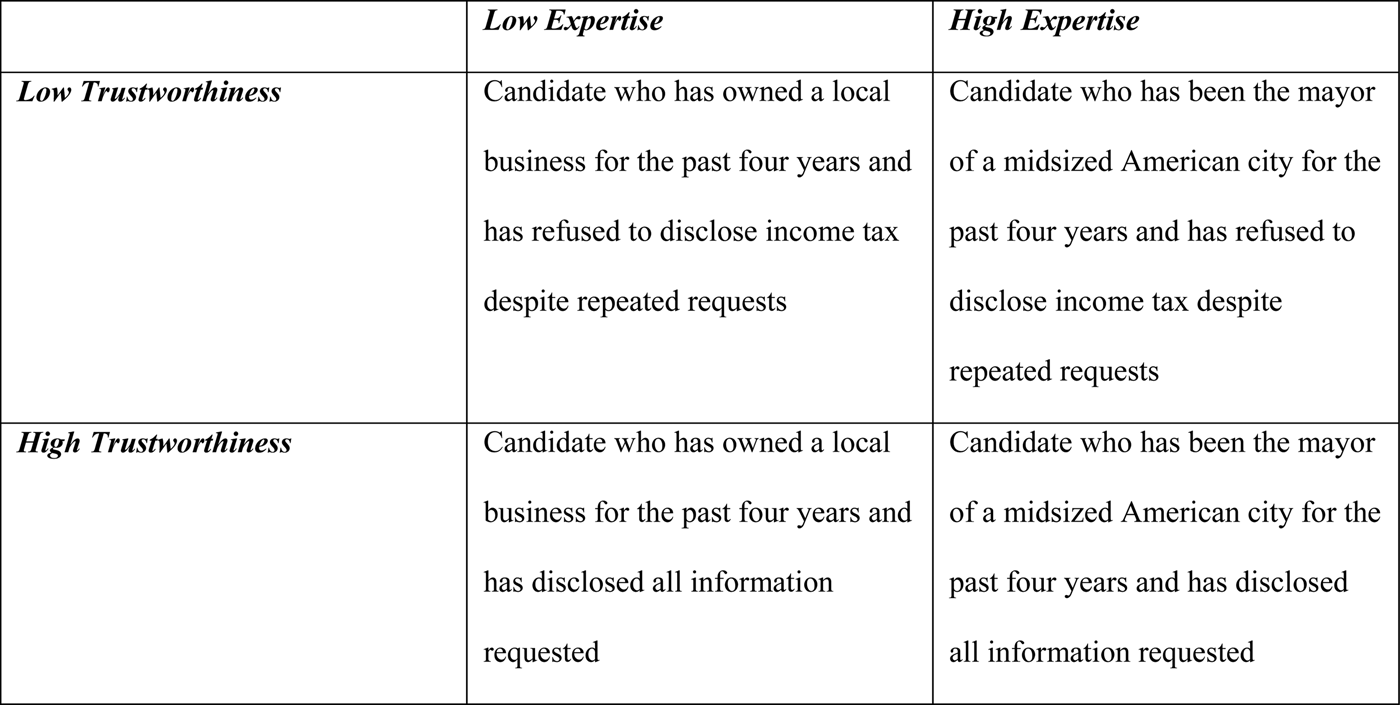
The design followed Harris et al. (Reference Harris, Hahn, Madsen and Hsu2015) closely in terms of structure and wording of questions and dialogues. High political expertise was operationalized as being a candidate who had been the mayor of a midsized American city for the past four years, while low political expertise was operationalized as having owned a local business for the past four years. Low trustworthiness was operationalized as having refused to disclose income tax information despite repeated requests, while high trustworthiness was operationalized as having disclosed all information requested. This led to four types of candidates, as shown in Figure 2.
The four candidate types.

In order to test the hypotheses about sex differences, a mixed-model approach was applied. Candidate sex is the basic variable of interest and therefore was manipulated in a between-subjects design so that each participant/voter would only evaluate the persuasive potential of either a male or a female candidate. Participants/voters were thus randomly assigned to female candidates or male candidates. Candidate credibility was manipulated as a within-subjects design in which all participants/voters were exposed to every condition—that is, the different candidate types as defined by levels of the independent variable, here the candidate's credibility (see Figure 2). A within-subjects design was chosen for this part of the study because candidate credibility is the critical variable. This design requires a smaller pool of participants, and a within-subjects design allows for direct comparisons of the impact of candidate sex regardless of individual differences (e.g., deference to authority, which would influence responses on all four dialogues equally). In addition, the design was chosen to emulate the design in the experiments of the Bayesian source credibility study that shaped the dialogues (Harris et al. Reference Harris, Hahn, Madsen and Hsu2015). In a between-subject design, there is a possibility that there may be differences between the groups that could impact the experiment's results. One drawback of using a within-subjects design is that there may be a carryover effect in the sense that the individual participant/voter's response to one credibility condition may affect his or her response to the other credibility conditions.
In the last part of the questionnaire, each participant/voter read four dialogues (either a female or a male candidate in the between-subjects approach) in which hypothetical candidates supported an unknown (for the participant) policy (one dialogue for each of the four conditions shown in Figure 2). An example is given below (here a candidate called Jennifer Smith who has high expertise and high trustworthiness) that follows the dialogue form from Harris et al. (Reference Harris, Hahn, Madsen and Hsu2015).
The participant/voter read a dialogue in which two persons talk about a new policy. One of the persons has no idea as to whether this policy is good or bad, but the other person argues that it is a good policy, because:
Jennifer Smith has SUPPORTED the policy. She has been the mayor of a mid-size American city for the past 4 years. Throughout her campaign, she has disclosed all information that members of the public has requested.
The four candidate types were presented to participants/voters in a random order. After reading each dialogue, they were asked to rate (on a 1–100 scale) how convinced they were that a policy would in fact be a good policy (0 representing being convinced that the policy is bad, 100 representing being convinced that the policy is good). Rather than scoring statements expressed by an election candidate as truth-conditionally dichotomous (i.e., true or false), the Bayesian reasoning paradigm conceptualizes truth (here, a voter's belief in a statement) as a matter of individual probabilistic degrees of belief in the statement, formally between 0 and 1 (Evans and Over Reference Evans and Over2004; Howson and Urbach Reference Howson and Urbach1993; Oaksford and Chater Reference Oaksford and Chater2007). These questions solicited the posterior beliefs as input to testing the hypotheses related to candidates’ and participants’ sex.
To make the sex of the candidate salient and clear, images were included out of worry that simply manipulating sex through name and pronoun references would be so subtle that some participants may not attend to this cognitively. Names were generic sounding (e.g., Jennifer/Jonathan Smith). Images are from the KDEF facial expression catalogue (Lundqvist, Flykt, and Öhman Reference Lundqvist., Flykt and Öhman1998), a face library previously used in psychological research. In order to control for the impact of emotions (e.g., a smiling face compared with a frowning face), the study only included images rated as 100% neutral in the KDEF library.Footnote 2 Four faces were female and four faces were male (given the between-subjects design). All faces were Caucasian (the use of faces of other ethnicities might test other types of epistemic discrimination than the one tested here) and had chestnut hair (with the exception of one male who was bald).
Given controlled candidate description, the study allows for comparisons with Bayesian predictions and analyses of overall population bias patterns and bias patterns related to candidate and participant sex. In order to check whether the manipulations were sound and well balanced, the participants were asked different questions, which made it possible to evaluate their attention as well as comprehension of the questions and scales. The operationalization of expertise worked well since respondents’ prior beliefs about the political expertise of a candidate having been mayor scored average 63.06 (scale for 0–100), while a candidate having owned a local business scored only 37.21. Similarly, a candidate who disclosed all tax information was rated average 76.78 in being completely trustworthy, while a candidate refusing to disclose information was rated only 19.48.
Furthermore, it was checked whether the respondents reasoned according to the Bayesian approach by measuring the so-called conditionals. Each respondent was asked to evaluate (also on a 0–100 scale) whether a candidate would in fact support a good policy or a bad policy (one question for each of the candidate types in Figure 2). These measures (prior beliefs and conditionals) were used to calculate each respondent's predicted posterior belief for each of the four candidate types. This predicted posterior belief was then compared with the respondent's actual expressed beliefs, as mentioned earlier. A linear regression shows a very good fit between model predictions and observed degrees of belief in the goodness of the proposed policy given a public endorsement from an election candidate. This is a strong result that shows that voters in general actually do follow the Bayesian logic expected, so posterior beliefs in the goodness of a policy are higher if the trustworthiness and expertise of the candidate are high, and vice versa. It is an underlying assumption in the study that ex ante expertise is the same for males and females.
RESULTS
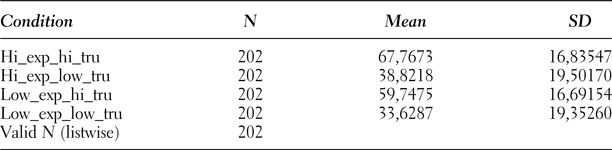
All 202 participants reported posterior beliefs for all four cells regarding trustworthiness and expertise (within-subjects design). Table 1 indicates that trustworthiness is valued higher than expertise since the level of posterior beliefs fall much more when going from the condition “high expertise/high trustworthiness” to “high expertise/low trustworthiness” than when going to “low expertise/high trustworthiness.” The finding is supported by the measures of prior beliefs reported earlier, where the variation for trustworthiness is much higher (between 19.48 and 76.78) than for expertise (from 37.21 to 63.06). These findings are in line with the social psychological literature, which that suggests that people attend more to warmth than to competence traits.
Overall expressed posterior beliefs (in goodness of policy)

The Impact of Candidate Sex
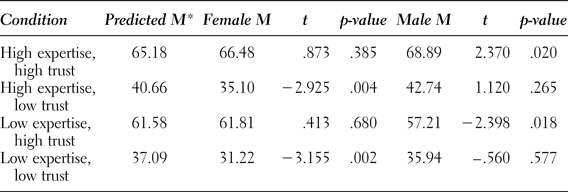
A number of t-tests comparing predicted and expressed beliefs for male and female candidates separately reveal some interesting departures from the normative Bayesian model predictions. The expected posteriors were calculated using Bayes's theorem from Harris et al. (Reference Harris, Hahn, Madsen and Hsu2015), which integrates source credibility in belief revision through amalgamation of expertise and trustworthiness. This allows for comparisons against normatively predicted posteriors and observed posteriors. Table 2 shows such departures from the normative predictions for the four candidate types. It appears that highly credible males (high in expertise as well as trustworthiness) have significantly higher persuasiveness potential than the model predicted (p = .020), while ratings of identical female candidates do not differ significantly from model predictions. This is contrary to H 1, which hypothesized no difference between male and female candidates for this condition. H 1 is thus rejected. Further, we see that voters were significantly less convinced by female candidates with low trustworthiness (p = .004 and .002), while observations from identical male candidates do not differ significantly from model predictions. Conversely, male candidates who are high in trustworthiness but low in expertise have significantly less persuasiveness potential compared with the model (p = .018), while identical female candidates do not differ significantly from model predictions. We thus found mixed results for H 2.
Comparison of expressed and predicted posterior degrees of beliefs—Female and male candidates

* The predictions used are the average predictions for each condition compared against the average response for each group (male versus female candidates).
These results suggest that female candidates are affected more negatively when they are perceived as having low trustworthiness compared with identical male candidates. Conversely, male candidates are affected more negatively when they are perceived as having low expertise compared with identical female candidates. As discussed later, this may be due to implicit stereotypical gender biases in which females might be expected to have to be warmer and males are assumed to have to be more competent, such that depletion in the respective traits appears more surprising and thus more diagnostic.
The Impact of Participant/Voter Sex
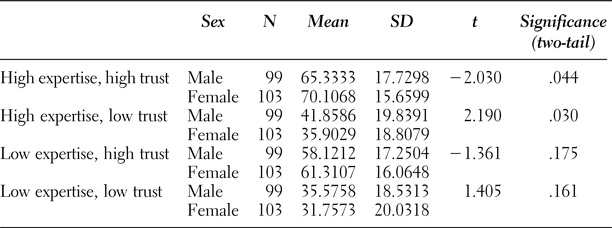
When comparing male and female participants/voters, Table 3 reports some interesting differences. We see that female voters exhibit significantly (p = .044) higher posterior beliefs than male participants/voters if the candidate is expert as well as trustworthy. Such candidates thus have higher persuasiveness potential among female voters than among male voters. The opposite is the case in the “high expertise/low trust” condition (p = .03). Males value negatively that the election candidate has low trustworthiness, but female voters do so even more. Similarly, female voters value negatively that the election candidate has low expertise, but male voters do so even more (p = .03). This result supports H 3.
Expressed posterior beliefs by male and female voters

The Joint Impact of Candidate and Voter Sex
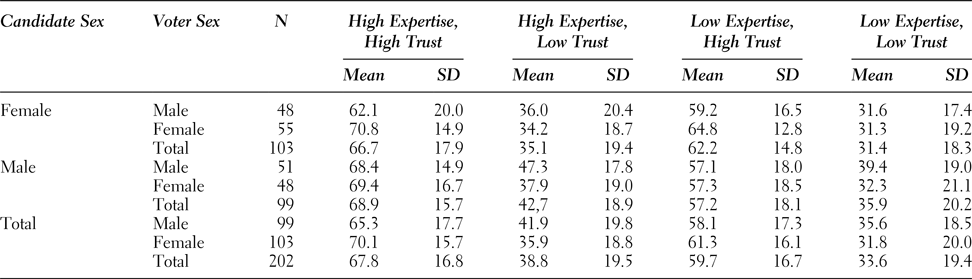
The final part of this section will analyse the direct as well as possible interaction effects of voter and candidate sex on posterior beliefs. We hypothesized that male voters will discriminate against female candidate with high expertise. Table 4 summarizes voters’ posterior beliefs concerning the four candidate types. The posterior beliefs of female voters appear to be influenced almost to the same extent by female candidates with low expertise and high trustworthiness (64.8) as by male candidates with high expertise and high trustworthiness (69.4). Similarly, male voters are influenced more by male candidates with low expertise and low trustworthiness (39.4) than by female candidates with high expertise and low trustworthiness (36.0). These finding provide more information concerning H 3. The combined effects are examined by means of a two-way analysis of variance (ANOVA) as well as t-tests.
Detailed expressed posterior beliefs

For the condition in which candidates have high expertise and low trustworthiness, male candidates are evaluated significantly higher than female candidates (42.7 versus 35.1; significant at the .006 level). For the same condition, there is a significant effect from voter sex in that male voters evaluate male candidates higher than female candidates (47.3 versus 37.9; significant at the .012 level in a t-test). A two-way ANOVA confirms this pattern (significant at the .003 level). These results both support H 4.
Looking more in detail at the female candidate condition, a t-test comparing male and female voter responses supports the hypothesis that in comparison with female voters, male voters find that female candidates have less persuasiveness potential. This is true for the condition with high expertise and high trustworthiness (difference between 70.8 and 62.1; significant at p = .013). A similar difference is significant at a lower level for female candidates with low expertise and high trust (difference between 64.8 and 59.2; p = .057).
For male candidates, the data suggest a different pattern. A t-test shows no significant voter sex differences for highly expert and highly trusted male candidates (which was significantly different for female candidates) or for male candidate with low expertise and high trust (which was significant for female candidates). However, male voters judge male candidates with high expertise and low trustworthiness significantly higher compared with female voters (difference between 47.3 and 37.9; p = .012). Further, the same pattern is seen for male candidates who are low in expertise and trustworthiness, yet at a lower significance level (difference between 39.4 and 32.3; p = .084).
In addition, the t-tests based on Table 4 suggest that female voters are internally consistent for three out of four candidate types while overevaluating female candidates who are low in expertise but high in trustworthiness compared with their estimations of identical male candidates (difference between 64.8 and 57.3; p = .018). This result is confirmed in the two-way ANOVA (p = .035). Candidate sex seems to influence male voters more. For candidates who are low in trustworthiness (regardless of expertise), male voters significantly overevaluate male candidates (difference between 47.3 and 36.0; p = .004; difference between 39.4 and 31.6; p = .036), while they seem to be underevaluate highly credible female candidate (difference between 68.4 and 62.1; p = .077). It seems that the sex of the candidate influences his or her persuasiveness potential. H 4 is thus supported, but in addition, the study revealed positive discrimination of female participants/voters toward female candidates.
DISCUSSION
The combined results clearly demonstrate that the candidates’ expertise and trustworthiness by far explain most of the variance in voters’ expressed posterior beliefs, which measure the candidates’ persuasiveness potential. This is in line with previous Bayesian argumentation studies and suggests that voters are sensitive to the relative credibility of sources and integrate this into their estimation of statements. The results also show that voters’ belief updating is in accordance with the rationality assumptions underlying the Bayesian approach (in line with Harris et al. Reference Harris, Hahn, Madsen and Hsu2015). However, as demonstrated earlier, we also find significant evidence that the sex of the candidate as well as of the voter has an impact on expressed posterior beliefs. For example, low trustworthiness significantly reduces the persuasive potential of female candidates, while low expertise reduces the persuasive potential of male candidates significantly.
Second, we observe a significant impact of source type such that statements from highly credible sources are more persuasive than statements from mixed-credibility sources, which, in turn, are more persuasive than statements from barely credible sources. This is in line with previous studies in credibility reasoning (e.g., Harris et al. Reference Harris, Hahn, Madsen and Hsu2015) and social psychological SCM studies (e.g., Neal et al. Reference Neal, Guadagno, Eno and Brodsky2012).
Third, SCM predicts no persuasive difference between highly credible female and male candidates. At the population level, the results support the hypothesis. However, when looking at voter groups, male voters rate highly credible females as significantly less persuasive compared with identical male candidates. Female voters do not exhibit this sex effect. This suggests that male voters are more skeptical toward policies endorsed by credible female candidates. This implies that female candidates need to be perceived as relatively more credible to have the same persuasive impact as male candidates when persuading male voters.
Fourth, the SCM literature predicted that female candidates with mixed or low credibility would be seen as less persuasive compared with identical male candidates. Our results are less clear concerning this issue. At the population level, female candidates with low trustworthiness are seen as less persuasive than their identical male counterparts. However, male candidates with low expertise and high trustworthiness are significantly less persuasive compared with Bayesian estimations at the population level. This supports the previous finding that female candidates suffer comparatively more from having low trustworthiness, while male candidates suffer comparatively more from having low expertise.
Voter sex differences yield a complex and intriguing picture. Female voters appear to overevaluate female candidates who are low in expertise but high in trustworthiness compared with their estimations of identical male candidates and compared with male voter reactions to statements from identical female and male candidates. Male voters appear to overevaluate male candidates with low trustworthiness regardless of expertise, while they trend toward devaluing highly credible female candidate. For all candidates, however, our results indicate that trustworthiness is more important for persuasiveness potential than expertise.
Results suggest that female candidates are more negatively affected than male candidates given loss of perceived trustworthiness at the population level. Comparatively, male candidates suffer more from perceived expertise loss. Implicit sex bias may have serious ramifications for the equal opportunity of working in dynamic and adversarial political environments as trust is easy to lose and difficult to regain, while expertise is harder to lose and easier to regain.
The present study suggests implicit sex biases, so female election candidates are at a relative loss when trustworthiness is lost, while male election candidates are at a relative loss when expertise is lost. The credibility asymmetry is disproportionately negative for female candidates in two ways. First, trustworthiness seems to impact persuasiveness potential more than expertise. Second, trust is easy to lose and hard to regain, while expertise is more difficult to lose and easier to regain. For example, if a politician makes a bad legislative decision because of a lack of expertise or knowledge (e.g., not knowing a particular set of procedural rules), the politician in question may quickly regain expertise by consulting with experts in the area, by enrolling in a course that specifically trains people to deal with his or her knowledge deficit, etc. However, if the politician lies about a particular decision, the damage can be irreparable, and regaining trust may take months or years (if at all possible).
The fact that female candidates appear more damaged by a loss of trust whereas male candidates appear more damaged by a loss of expertise suggests that male credibility is easier to rebuild compared with female credibility. In an adversarial and antagonistic atmosphere in which attack ads are common, the results indicate that the political environment is less favorable to candidates who suffer disproportionately from a loss of trustworthiness. Previous research has demonstrated that male voters are mobilized more than female voters by negative campaigns (Brooks Reference Brooks2010). Thus, the political environment is not conducive to maintaining and building trustworthiness, which may very well affect men and women voters differently.
While the present study explores prejudices and epistemic discrimination on the part of the receiver, implicit biases may also cause people to act in accordance with social expectations (Sjöström and Holst Reference Sjöström and Holst2002). Priming people with racial or gender stereotypes yields stereotype-congruent behavior (e.g., Steele Reference Steele1997; Walton and Cohen Reference Walton and Cohen2003). Priming women with sex stereotypes causes them to engage in less risky financial activities (Schubert et al. Reference Schubert, Brown, Gysler and Brachinger1999), makes them less likely to pursue careers stereotypically considered to be “male” professions (Rudman and Phelan Reference Rudman and Phelan2010), and may make them more security oriented (Sassenberg et al. Reference Sassenberg, Brazy, Jonas and Shah2013). As an example of social priming, Hetsroni and Lowenstein (Reference Hetsroni and Lowenstein2014) report that experts are consulted along sex-stereotypical lines (e.g., male experts commenting on financial matters and female experts commenting on family issues).
Priming candidates with sex stereotypes may plausibly result in negative outcomes for female candidates. If this is true, women are doubly disadvantaged, as they are judged more negatively than men, and, if socially primed to think in sex stereotypes, they are less likely to engage with antagonistic careers such as politics. Future research should be conducted to determine the influence of sex stereotyping on the part of election candidates.
LIMITATIONS OF THE CURRENT STUDY AND FUTURE DIRECTIONS
Through an argumentation framework and Bayesian predictions, the current study offers a novel way to elicit implicitly biased responses to different sources. While the paradigm offers a tentative view into the cognitive processes delineating reasoning discrimination, there are several limitations to the current study that point to a wider research program on biased reasoning processes and sex discrimination. First, this is an experimental study, and not a study examining the evaluation of actual real-life candidates. As mentioned previously, several authors point out that experimental studies may overemphasize the importance of gender stereotypes. Second, the study was conducted in the United States. It is likely that different sociocultural backgrounds would yield different discriminatory patterns. Third, candidate trustworthiness was manipulated through finance-oriented factors (the candidate either disclosed or refused to disclose personal income information). As the study targets sex stereotyping, it is plausible that different causal influences on trustworthiness may impact male and female candidates differently, as prejudice can be multifaceted (Brauer, Wasel, and Niedenthal Reference Brauer, Wasel and Niedenthal2000). Future studies should test other trustworthiness and expertise manipulations to get a richer picture of the causality of discrimination.
Fourth, while priors were elicited for nongendered candidates (e.g., eliciting the political expertise of an election candidate who has been the mayor of a midsized American town for the past four years), it is possible that participants would have responded differently to priors concerning male and female candidates. If this were the case, discrimination would have occurred at the level of prior beliefs rather than at the level of reasoning processes. Nonetheless, future studies should determine the onset and causal structure of biased reasoning and epistemology, as it may occur at both instances (priors and posteriors). Fifth, the study tests male and female candidates rather than a broader range of genders (e.g., transgender, queer, etc.). Finally, the study deals with policy statements. It is conceivable that other domains (e.g., financial markets, medical staff, etc.) exhibit other discriminatory traits. Sixth, we asked voters to evaluate the goodness of a policy. This concept is far from unequivocal, and different interpretations are possible for each voter. Finally, the external validity of experimental studies is generally questionable since respondents were presented with a noncontextualized world.
The study suggests that female election candidates are subject to implicit sex biases in two central ways. First, despite agreeing on their trustworthiness and expertise, highly credible women are less persuasive to male voters. Second, female candidates are affected more adversely if they are perceived as lacking in trustworthiness. Male candidates, on the other hand, are affected more negatively if they are perceived as lacking in expertise. As the latter is easier to repair, trust may be difficult to regain in a cutthroat political environment, which may carry greater negative impact for female candidates.