

When using sarcasm (e.g., saying ‘Nice catch’ after Eve fumbles a baseball), the speaker's words and intended meaning differ. As illustrated, sarcasm is used to refer to a specific individual's failure to meet an expectation (Lee & Katz, Reference Lee and Katz1998). Therefore speakers use sarcasm to simultaneously express a critical attitude, to tease, and to do so with humor (Jorgensen, Reference Jorgensen1996). Verbal irony, on the other hand, is used to refer to generally agreed upon expectations that are unmet, but at the fault of no particular individual (Lee & Katz, Reference Lee and Katz1998). Speakers use sarcasm to ridicule and to express a critical attitude with humor (Dews & Winner, Reference Dews and Winner1995; Jorgensen, Reference Jorgensen1996; Pexman & Olineck, Reference Pexman and Olineck2002). Sarcastic speakers commonly couch a criticism in indirect language (i.e., a sarcastic criticism) and provide paralinguistic cues such as intonation or laughter to signal their intentions (Bryant & Fox Tree, Reference Bryant and Fox Tree2002). The majority of research concerning children's developing understanding of sarcasm has focused on sarcastic criticisms likely because this statement type is a conventional counterfactual figurative language form. Children understand the non-literal meaning of sarcastic criticisms between five and six years old but appreciation of a sarcastic speaker's humorous intent begins at nine years old (Glenwright & Pexman, Reference Glenwright, Pexman, Gibbs and Colston2007) and is still developing at thirteen years of age (Demorest, Meyer, Phelps, Gardner & Winner, Reference Demorest, Meyer, Phelps, Gardner and Winner1984). Given that sarcasm understanding is an important aspect of conversational awareness which has social costs if miscomprehended, it is important to examine the factors that aid understanding for both children and adults.
Adults' sarcasm interpretation is facilitated by cues to a speaker's beliefs and intentions (Colston, Reference Colston2002), including intonation (Winner, Reference Winner1988) and discrepancy between statement and context (Katz & Lee, Reference Katz and Lee1993). Adults also consider the sarcastic speaker's characteristics, including whether the speaker is a funny person (Katz & Pexman, Reference Katz and Pexman1997) and the speaker's relationship with the listener (Pexman & Zvaigzne, Reference Pexman and Zvaigzne2004). Children similarly attend to relevant cues in formulating attributions of sarcastic intent, such as allusion to unmet expectations (Creusere, Reference Creusere2000), utterances that echo predictions (Hancock, Dunham & Purdy, Reference Hancock, Dunham and Purdy2000), speaker personality traits (Pexman, Glenwright, Hala, Kowbel & Jungen, Reference Pexman, Glenwright, Hala, Kowbel and Jungen2006), statement/context incongruity (Ackerman, Reference Ackerman1983), and speaker intonation.
Studies examining children's comprehension of sarcasm according to speaker intonation have required children to recognize sarcasm based on context, intonation, or a combination of these two cues. There are some claims that sarcasm comprehension is more dependent on intonation than context during middle childhood (Ackerman, Reference Ackerman1983; Laval & Bert-Erboul, Reference Laval and Bert-Erboul2005; Winner & Leekam, Reference Winner and Leekam1991), while context is more important than intonation during late childhood (Cappelli, Nakagawa & Madden, Reference Colston1990; Keenan & Quigley, Reference Keenan and Quigley1999). In the cited studies, sarcasm was voiced by a speaker conveying a disapproving attitude with a highly stressed intonation (Ackerman, Reference Ackerman1983) or by a mocking, negative, and exaggerated tone with lengthened syllables as confirmed by adult raters (Capelli et al., Reference Capelli, Nakagawa and Madden1990; Keenan & Quigley, Reference Keenan and Quigley1999). Studies including adult participants, however, have taken a more careful approach to verifying the features of sarcastic intonation with a computerized signal editor. The majority of published papers on this topic indicate that sarcastic utterances are distinguished from sincere utterances by a lower voice pitch or, more specifically, an overall reduction in mean F0 (Cheang & Pell, Reference Cheang and Pell2008; Milosky & Ford, Reference Milosky and Ford1997; Rockwell, Reference Rockwell2000, Reference Rockwell2003, Reference Rockwell2007; Voyer & Techentin, Reference Voyer and Techentin2010). From the listener's perspective, an overall reduction in mean F0 sounds like the speaker is lowering her voice when uttering the sarcastic part of her message. Contrary to this dominant claim, a handful of papers have reported that sarcastic utterances are voiced with an exaggerated and varied pitch range (Haiman, Reference Haiman1998; Milosky & Ford, Reference Milosky and Ford1997), or with a higher pitch (Anolli, Ciceri & Infantino, Reference Anolli, Ciceri and Infantino2000; Haiman, Reference Haiman1998), and still others have found no intonational differences between sarcastic and literal speech (Bryant & Fox Tree, Reference Bryant and Fox Tree2005).
While previous studies have focused on how children's attention to present versus absent sarcastic intonation influences sarcasm comprehension, our main goal was to examine if gradient levels of intonation would influence children's interpretations of the sarcastic speaker's intentions. This finding would tell us whether children's comprehension of sarcasm would be improved if a sarcastic speaker were to use an exaggerated intonation. We are not aware of any published study which has examined this issue for adults. Our secondary goal was to address the described controversy in the adult literature regarding the acoustical features of sarcastic speech. Given the dominant claim that sarcastic speech is distinguished from literal speech according to mean reductions of F0, we examined if participants' interpretations of the sarcastic speaker's intended meaning, intent to criticize, and intent to convey humor would be facilitated by an exaggerated intonation with larger reductions in the speaker's mean F0 relative to preceding sentences.
Participants watched conversations that varied by statement type (sarcastic versus literal) and by the size of speaker's reduction in mean F0 (small, medium, large) verified by an acoustical analysis. We presented the sarcasm task to five- to six-year-old children and young adults, for whom sarcasm comprehension should be fully developed. If a reduction in the sarcastic speaker's voice pitch is a reliable cue to sarcasm, we expected that five- to six-year-olds would be just beginning to comprehend the meaning of sarcastic criticisms, and that this emerging proficiency should be improved for sarcastic criticisms presented with larger reductions in the speaker's mean F0. Improvement could be demonstrated by participants in the following ways as afforded by our methodology.
First, participants were asked a speaker belief question, which assessed comprehension of the speaker's intended meaning. Speaker belief responses were coded as correct if participants recognized sarcastic/literal criticisms as negative evaluations. If larger reductions in the speaker's pitch served to help children detect the sarcastic speaker's non-literal meaning, improved comprehension of sarcasm would be evidenced by larger proportions of correct speaker belief responses for sarcastic criticisms in the large F0 reduction condition relative to the medium and small F0 reduction conditions. Given that adults should have ceiling levels of sarcasm comprehension, we did not expect to find a difference between F0 conditions. Second, participants were asked to rate the speaker's attitude for sarcastic criticisms and literal criticisms by indicating how nice or mean they viewed the speaker's intentions in making the remark. Here, recognition of the sarcastic speaker's critical attitude would be evidenced if children rated speaker attitude for sarcastic criticisms in the large F0 reduction condition as more ‘mean’ than sarcastic criticisms in the medium and small F0 reduction conditions. For this dependent variable, we expected that adults would also show ratings for sarcastic criticisms voiced in the large F0 conditions as being more ‘mean’ than sarcastic criticisms in the medium and small conditions. Lastly, participants were asked to rate speaker humor by rating how funny or serious the speaker was trying to be. Given previous observations that five- to six-year-old children do not yet appreciate the humor in sarcasm (Demorest et al., Reference Demorest, Meyer, Phelps, Gardner and Winner1984; Glenwright & Pexman, Reference Glenwright, Pexman, Gibbs and Colston2007), we did not expect children to provide significantly different speaker humor ratings among the three F0 reduction conditions. That is, we expected children to rate all sarcastic criticisms as serious regardless of the speaker's voice pitch quality. We predicted that adults, however, should rate sarcastic criticisms in the large F0 reduction condition as being funnier than sarcastic criticisms in the medium and small conditions because a more obvious sarcastic intonation should convey a more humorous message for a participant group with a fully developed understanding of sarcasm's humor function.
METHOD
Participants and design
Participants were sixty-four typically developing children (32 females) between the ages of 5;1 and 6;9 (M=6 years, 3·84 months, SD=6·6 months) recruited from local schools and thirty-six adults (18 females) between the ages of 17;11 and 34;7 (M=20 years, 1 month, SD=3·15 years) recruited from a university subject pool. Age (children or adults), Statement (sarcastic criticisms, literal criticisms, or literal compliments), and F0 Reduction (small, medium, large) were manipulated in a mixed design.
Stimuli and procedure
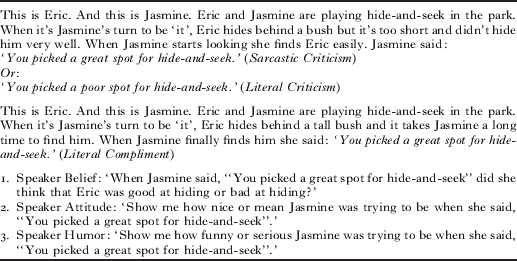
Each participant viewed eighteen videos depicting puppet dyad conversations. Each video featured child-friendly activities such as playing hide-and-seek or painting. The dialogue ended with a sarcastic criticism, literal criticism, or literal compliment (Table 1). After each video, participants were asked about the speaker's belief, attitude, and humor. The experimenter was required to repeat the test statement in the context of asking each question (e.g., ‘When Jasmine said, “You picked a great spot for hide-and-seek” did she think that Eric was good at hiding or bad at hiding?’). The experimenter tried to consistently use either a mocking and negative tone with lengthened syllables when repeating sarcastic criticisms, a blunt and factual tone when repeating literal criticisms, or a warm, sincere, and friendly tone when repeating literal compliments. Speaker belief responses were coded as correct if children recognized sarcastic/literal criticisms as negative evaluations or literal compliments as positive evaluations. As is standard practice, mean speaker attitude and mean speaker humor ratings were calculated only when children correctly responded to the speaker belief question. Prior to testing, participants were trained to use two visually depicted rating scales, each consisting of six faces (Glenwright & Pexman, Reference Glenwright and Pexman2010). Speaker attitude ratings on the Nice/Mean Scale (Figure 1) were coded from 1 (very nice) to 6 (very mean). Participants were asked to point to one of the six faces to indicate their rating of speaker attitude (e.g., ‘Show me how nice or mean Jasmine was trying to be when she said, “You picked a great spot for hide-and-seek”.’). Speaker humor ratings on the Funny/Serious Scale (Figure 2) were coded from 1 (very funny) to 6 (very serious). Participants were also asked to point to one of the six faces to indicate their speaker humor rating (e.g., ‘Show me how funny or serious Jasmine was trying to be when she said, “You picked a great spot for hide-and-seek”.’).
Nice/Mean Scale for speaker attitude ratings. note: Ratings were coded so that 1=very nice, 2=nice, 3=a little bit nice, 4=a little bit mean, 5=mean, and 6=very mean.

Funny/Serious Scale for speaker humor ratings. note: Ratings were coded so that 1=very funny, 2=funny, 3=a little bit funny, 4=a little bit serious, 5=serious, and 6=very serious.

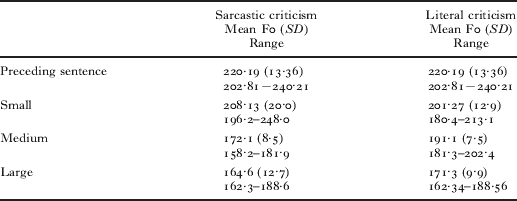
Female narrated audio files were acoustically analyzed using Praat speech analysis software (Boersma & Weenink, Reference Boersman and Weenink2007) according to F0 means and SDs for neutral, sarcastic, and sincere statements voiced by female speakers in Cheang and Pell (Reference Cheang and Pell2008). One female speaker (i.e., the first author) produced all sound files. While recording the final neutral, sarcastic, and sincere statement endings, she purposely manipulated the pitch of her voice with the goal of producing stimuli for three conditions. Sarcastic stimuli were verified on mean F0 reductions relative to preceding sentences to create three conditions: small (neutral), medium (dry sarcasm), and large (dripping sarcasm). Literal criticisms were also presented in three F0 reduction conditions: small (neutral), medium (critical), and large (harsh). While these stimuli were not naturally created, it should be noted that this speaker knew how to manipulate her voice to create more and less obvious intonations from a decade of experience narrating sarcastic and literal statements in developmental studies of children's sarcasm comprehension. She was required to re-record only a few sound files in the large intonation conditions so that the F0 means and SDs were not significantly different from the corresponding values for statements voiced by female speakers in Cheang and Pell (Reference Cheang and Pell2008). This was necessary, not because the high F0 stimuli were artificial sounding, but rather because this female speaker's voice has a lower pitch than the typical female and thus needed to stretch the range of her voice to a higher pitch in the re-recordings. Sarcastic criticisms and literal criticisms were presented with the same preceding sentence audio files (see Table 2). For each statement type, all stories were presented in each of the three F0 reduction conditions balanced across participants.
Sample puppet show for each statement type and questions
note: The speaker's final sarcastic/literal criticism was voiced with either a small, medium, or large F0 reduction.
Bonferroni-corrected paired t-tests compared mean F0 values for each criticism condition to the preceding sentence. The mean F0 for sarcastic criticisms voiced in the small condition did not significantly differ from the F0 of the preceding sentence (t(5)=1·18, p=·293). Sarcastic criticisms voiced in medium and large conditions were both significantly lower in pitch compared to the preceding sentence (t(5)=10·20, p<·001 and t(5)=13·87, p<·001, respectively). The mean F0 for literal criticisms voiced in the small condition did not significantly differ from the preceding sentence (t(5)=2·99, p=·030). Literal criticisms in the medium and the large conditions were both significantly lower in pitch compared to the preceding sentence (t(5)=5·56, p=·003 and t(5)=5·59, p=·003, respectively). Six literal compliments were also included to vary situational context valence.
Mean F0s, SD, and range values for preceding sentences and F0 reduction conditions by statement type
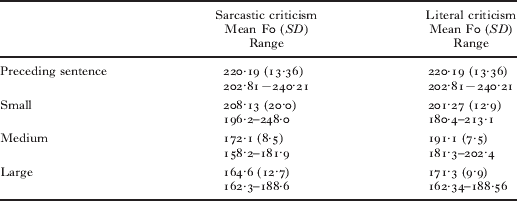
note: Higher frequencies correspond with higher pitches. Means, SDs and ranges for F0s (in Hz) were calculated for the female narrator's voicing of the preceding sentence and the final statement in each F0 Reduction/Statement Type condition. Sarcastic criticisms and literal criticisms were presented with the same preceding sentences.
Bonferroni-corrected paired t-tests were also used to compare mean F0 values for the three conditions within each statement type. The mean F0 for sarcastic criticisms voiced in the small condition was significantly different from the mean F0 for sarcastic criticisms in the medium condition (t(5)=5·54, p=·003). Mean F0s for sarcastic criticisms voiced in medium and large conditions were also significantly different (t(5)=3·96, p=·011). The mean F0 for literal criticisms voiced in the small condition was significantly different from the mean F0 for literal criticisms in the medium condition (t(5)=3·69, p=·016). Literal criticisms in the medium condition had a mean F0 which was significantly larger than literal criticisms in the large condition (t(5)=4·48, p=·007).
RESULTS
Responses for each question were examined with a 2 (age: children, adults)×2 (criticism: sarcastic, literal)×3 (F0 reduction: small, medium, large) mixed-model ANOVA with age as a between-subjects factor and criticism and F0 reduction as within-subjects factors (hereafter referred to as the mixed model). Data for literal compliments were not included in the analyses because they served as positively worded control statements and therefore did not address any central research questions. Partial effect sizes are denoted by η2 and an alpha level of ·05 was adopted for all analyses except for Bonferroni-corrected t-tests.
Speaker belief responses
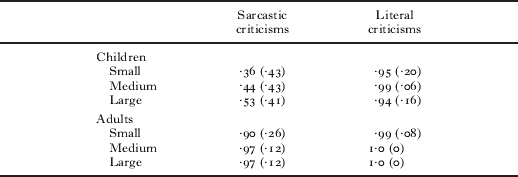
Proportions of correct speaker belief responses (Table 3) were submitted to the mixed model. The effect of criticism (F(1, 94)=84·21, p<·001, η2=·473) and age (F(1, 94)=68·83, p<·001, η2=·423) were each significant, as was their interaction (F(1, 93)=58·90, p<·001, η2=·385). Children showed higher speaker belief comprehension rates for literal criticisms versus sarcastic criticisms, whereas adults showed comparable rates for literal and sarcastic criticisms. Both the effect of F0 reduction (F(2, 93)=5·12, p=·007, η2=·052) and the criticism×F0 reduction interaction were significant (F(2, 93)=4·43, p=·013, η2=·045). Paired t-tests showed participants having a higher proportion of correct speaker belief responses for ironic criticisms in the large F0 reduction condition than in the small F0 reduction condition (t(108)=3·23, p=·002). The proportion of correct responses for medium F0 reductions did not differ from either small (t(108)=2·22, p=·029) or large reductions (t(108)=1·30, p=·196) after a Bonferroni correction was applied. Speaker belief comprehension levels were at ceiling for literal criticisms in the three F0 reduction conditions. Neither the 3-way interaction (F(1, 94)=1·78, p=·171, η2=·019) nor the age×F0 reduction interaction was significant (F(1, 94)=·643, p=·425, η2=·007).
Mean (SD) proportions of correct speaker belief responses by age group as a function of statement type and F0 reduction
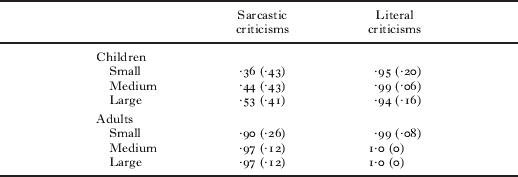
note: Speaker belief responses were considered correct when sarcastic criticisms and literal criticisms were interpreted as negative evaluations or literal compliments were interpreted as positive evaluations.
Speaker attitude ratings
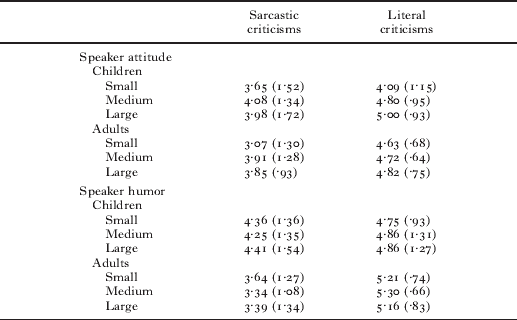
Mean speaker attitude ratings (Table 4) were submitted to the mixed model. The criticism×F0 reduction interaction was significant (F(2, 52)=3·21, p=·044, η2=·058), because ironic criticisms voiced with large F0 reductions (M=3·92, SD=1·33) were rated as significantly more mean than ironic criticisms voiced with small F0 reductions. Ironic criticisms with medium F0 reductions were also rated as more mean than ironic criticisms with small F0 reductions. In contrast, literal criticisms were rated as equally mean in the small, medium, and large F0 reduction conditions. The main effects of criticism (F(1, 52)=46·78, p<·001, η2=·474) and F0 reduction (F(2, 51)=5·75, p=·004, η2=·100) were also significant. Neither the 3-way interaction nor the remaining interactions were significant (Fs<1). Lastly, the main effect of age was not significant (F(1, 52)=1·58, p=·215, η2=·977).
Mean (SD) speaker attitude and mean speaker humor ratings by age group as a function of statement type and F0 reduction condition
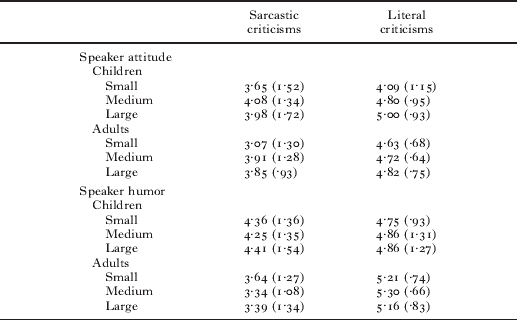
note: Ratings were calculated when participants correctly answered the speaker belief question.
Speaker humor ratings
When mean speaker humor ratings (see Table 4) were submitted to the mixed model, the criticism×age interaction was significant (F(1, 55)=4·68, p=·035, η2=·078). Children rated both sarcastic criticisms (M=4·34, SD=·23) and literal criticisms as slightly serious, whereas adults rated sarcastic criticisms as funnier than literal criticisms. The main effect of criticism was significant (F(1, 55)=29·69, p<·001, η2=·351), but the main effects of age and F0 reduction were not (both Fs<1). Lastly, the 3-way, the age×level, and the criticism×level interactions were not significant (all Fs<1).
DISCUSSION
A speaker's intention can be gleaned through a number of sources including the linguistic content (what is said) and the context (when/where it is said), as well as the paralinguistic cues (how it is said). Regarding the latter cue, previous work has demonstrated that preschool-aged children are able to use intonation cues to interpret unclear language, such as ambiguous referential statements (Berman, Chambers & Graham, Reference Berman, Chambers and Graham2010). However, in situations where the linguistic cues conflict with paralinguistic cues, four-year-olds tend to rely more heavily on the linguistic interpretation (Friend, Reference Friend2000). Sarcasm poses an interesting challenge for children, given that successful interpretation depends on attending closely to paralinguistic cues. The present work examined whether exaggerated intonation cues facilitated more successful interpretations. This question addresses several theoretical issues that have posed some controversy in both the child and adult literature, including whether intonation is relied on as a cue to interpreting sarcasm, and if so, whether an exaggerated form provides children and adults with greater access to a sarcastic speaker's intentions.
Our main objective was to determine whether children's interpretations of sarcastic criticisms would be influenced by variation in the speaker's mean reduction in F0 relative to preceding sentences. Five- to six-year-olds better understood the non-literal meaning of sarcastic criticisms when the speaker's pitch had the largest F0 contrast with an earlier sentence. Contrary to our expectations, adults also showed increased comprehension rates for sarcastic criticisms in the large F0 reduction condition compared to the small F0 reduction condition. This finding highlights speaker intonation as a helpful cue even for adults who generally possess a sophisticated understanding of sarcasm. We also examined whether the speaker's magnitude of F0 reduction would influence participants' interpretations of the sarcastic speaker's attitude. Children's and adults' ratings of speaker's intent to criticize were modulated by condition: sarcastic and literal criticisms made in the large F0 reduction condition were rated as more mean than sarcastic/literal criticisms made in the medium and small conditions. Neither group modulated ratings of speaker humor according to the size of the contrast in the speaker's voice pitch relative to preceding sentences for sarcastic criticisms. In general, adults rated sarcastic criticisms as funnier than literal criticisms while children rated both criticism types as being equally serious. These findings are consistent with previous claims that five- to six-year-old children do not appreciate sarcastic speakers' humorous intent (Glenwright & Pexman, Reference Glenwright, Pexman, Gibbs and Colston2007).
Controversy exists in the adult literature as to how the acoustic features of sarcastic speech affect interpretation. Our stimuli were constructed according to the majority of empirical reports indicating that sarcastic messages are characterized by a reduction in the speaker's pitch relative to the preceding sentence (e.g., Cheang & Pell, Reference Cheang and Pell2008; Milosky & Ford, Reference Milosky and Ford1997; Rockwell, Reference Rockwell2000, Reference Rockwell2003, Reference Rockwell2007; Voyer & Techentin, Reference Voyer and Techentin2010). In support of this claim, the present study found that child and adult participants were more likely to interpret the sarcastic speaker's non-literal meaning when the speaker's pitch was significantly lower than her preceding sentence (high F0 reduction condition) compared to when her pitch was comparable to her preceding sentence (low F0 reduction condition).
These findings also verify previous reports that middle-school-aged children attend to the speaker's intonation when determining the non-literal meaning of sarcastic criticisms (Ackerman, Reference Ackerman1983; Laval & Bert-Erboul, Reference Laval and Bert-Erboul2005; Winner & Leekam, Reference Winner and Leekam1991) using acoustical analysis of the magnitude of pitch reduction in sarcastic criticisms.
Given that children encounter sarcastic language frequently in their everyday experiences (Recchia, Howe, Ross & Alexander, Reference Recchia, Howe, Ross and Alexander2010), there is social risk associated with misinterpretation. Indeed, children who demonstrate more socially withdrawing behaviors attribute more negative intentions to sarcastic speakers (Mewhort-Buist & Nilsen, Reference Mewhort-Buist and Nilsen2012). Moreover, more general pragmatic language skills have been found to moderate the relationship between social withdrawal and subsequent social and emotional difficulties (Coplan & Weeks, Reference Coplan and Weeks2009), suggesting that appreciating the function of various language forms, including sarcasm, may be important for social adjustment. Our findings demonstrate that speaker intonation is a helpful cue for children and adults when understanding the sarcastic speaker's critical attitude. In addition to theoretical implications, our findings imply that children who have difficulties in appreciating paralinguistic cues, such as tonality, may be more prone to miss or misinterpret sarcasm. Furthermore, findings suggest that exaggerating intonation may be a useful tool in teaching comprehension of sarcasm and other figurative language forms.