INTRODUCTION
Estuaries along the coast of Paraíba State are inhabited by several species of bivalves, including oysters Crassostrea gasar (Adanson, 1757) and Crassostrea rhizophorae (Guilding, 1828), clams Anomalocardia brasiliana (Gmelin, 1791) and mangrove mussels Mytella falcata (Orbigny, 1846) and Mytella guyanensis (Lamarck, 1819). In these ecosystems, the bivalves are used as food and a source of income for the local population. Such species are a promising economic alternative through a regular production system, as they grow fast (Lopes et al. Reference Lopes, Gomes, Tureck and de Melo2013) due to suitable temperatures (25–30 °C) in the Northeastern region, in addition to the presence of an increasing consumer market.
Nowadays, the major impediment to oyster farming is the occurrence of parasites and diseases that hinder the growth and reproduction of cultured organisms and cause, in some cases, mortality events (Bower et al. Reference Bower, McGladdery and Price1994; Figueras and Novoa, Reference Figueras and Novoa2011). Among the known pathogens, the most detrimental for oyster farming are bacteria and protozoa (Figueras and Novoa, Reference Figueras and Novoa2011). Parasites from the genus Perkinsus are a constraint for bivalves cultured worldwide (see reviews of Choi and Park, Reference Choi, Park, Ishimatsu and Lie2010; Villalba et al. Reference Villalba, Reece, Ordás, Casas and Figueras2004, Reference Villalba, Gestal, Casas, Figueras, Figueras and Novoa2011). Two species, Perkinsus marinus Levine, 1978 and Perkinsus olseni Lester and Davis, 1981, are notifiable to the World Organisation for Animal Health (OIE). Perkinsus marinus is responsible for mass mortalities of eastern oysters Crassostrea virginica (Gmelin, 1791) in the United States and Mexico (Burreson and Ragone-Calvo, Reference Burreson and Ragone-Calvo1996; Gullian-Klanian et al. Reference Gullian-Klanian, Herrera-Silveira, Rodríguez-Canul and Aguirre-Macedo2008) and Crassostrea gigas (Thunberg, 1793) in Mexico (Enríquez-Espinoza et al. Reference Enríquez-Espinoza, Grijalva-Chon, Castro-Longoria and Ramos-Paredes2010), whereas P. olseni has been reported in clams Ruditapes decussatus (Linnaeus, 1758) and Ruditapes philippinarum (Adams and Reeve, 1850) from several countries in Europe (France, Spain, Italy, Portugal), Asia and Australia (see reviews of Choi and Park, Reference Choi, Park, Ishimatsu and Lie2010; Villalba et al. Reference Villalba, Gestal, Casas, Figueras, Figueras and Novoa2011; Soudant et al. Reference Soudant, Chu and Volety2013).
In the last 15 years, in Brazil, several studies have been conducted to identify and study parasite species present in wild and cultured bivalve populations. Most studies were focused on cultured oysters, including the Japanese species C. gigas and the native species C. rhizophorae, and mussels Perna perna (Linnaeus, 1758) (da Silva et al. Reference da Silva, Magalhães and Barracco2002, 2012, 2014; Suárez-Morales et al. Reference Suárez-Morales, Scardua and da Silva2010; Sabry et al. Reference Sabry, da Silva, Gesteira, Pontinha and Magalhães2011; Brandão et al. Reference Brandão, Boehs and da Silva2013a , b; Queiroga et al. Reference Queiroga, Marques-Santos, Hégaret, Soudant, Farias, Schlindwein and da Silva2013). But it was only in 2012 that the Brazilian government (Ministry of Fisheries and Aquaculture) created a National Network of Reference Laboratories in order to perform diagnostic testing for diseases of aquatic animals and control disease spread and commercialization of molluscs. This measure was in part a result of the increasing countrywide production of bivalves.
So far, mortality events have been only sporadically reported in bivalves from Brazil, in Santa Catarina State (South Brazil). One occurred in a wild population of stout razor clam Tagelus plebeius (Lightfoot, 1786) associated with a sudden drop in salinity after a flood (da Silva et al. Reference da Silva, Cremonte, Sabry, Rosa, Cantelli and Barracco2009); another affected 20% of a cultured mussel population of P. perna due to a rare infection in the mantle by a larva of the copepod Monstrilla sp. Dana, 1849 (Suárez-Morales et al. Reference Suárez-Morales, Scardua and da Silva2010) and, finally, summer mortality events that occur occasionally in cultured oysters C. gigas.
OIE notifiable parasite species for molluscs (OIE, http://www.oie.int/animal-health-in-the-world/oie-listed-diseases-2014/) were only recently reported in Brazil, P. marinus infecting wild oysters C. rhizophorae (da Silva et al. 2013) and P. olseni infecting cultured and wild populations of the economically important native oyster C. gasar (da Silva et al. Reference da Silva, Scardua, Viana, Mendonça, Vieira, Dungan, Scott and Reece2014). In addition, Perkinsus beihaiensis Moss et al. Reference Moss, Xiao, Dungan and Reece2008 was reported infecting the oyster C. rhizophorae (Sabry et al. Reference Sabry, Rosa, Magalhães, Barracco, Gesteira and da Silva2009, Reference Sabry, Gesteira, Magalhães, Barracco, Guertler, Ferreira, Vianna and da Silva2013) and other Perkinsus spp. remain to be identified (Brandão et al. Reference Brandão, Boehs, Sabry, Ceuta, Luz, Queiroga and da Silva2013 b).
Since C. gasar is the most promising oyster species for husbandry in the northeast region of Brazil and the risk presented by Perkinsus spp., more attention should be given to this oyster species. Therefore, this study aimed to detect and describe the organisms and diseases affecting the oysters C. gasar cultured in the Mamanguape estuary as well as the host reactions and histological changes in the host.
MATERIAL AND METHODS
Study area and experimental design
The coastal region of Paraíba State has a tropical hot-humid climate, with rain in the autumn and winter (May–September) and dry conditions in the spring and summer (October–April), with an annual average rainfall of 1800 mm and air temperature of 26 °C.
Oysters C. gasar over 70 mm in shell height were obtained from a suspended–fixed cultivated system located on the estuary of the Mamanguape River (S 06°47′082″; WO 34°59′467″).
Oyster samplings (N = 40) were performed in the following months: December 2011, March, May, August and October 2012. After each sampling, oysters were distributed into tanks containing seawater from the site in a closed system under constant aeration for a maximum of 48 h. The oyster capture and experimental procedures were authorized by ICMBio (Chico Mendes Institute for Biodiversity Conservation/Authorization under the code: 30718-1).
Histological sections
Oysters were opened (~40/sample) by severing their adductor muscles. A transverse histological sample approximately 5 mm in thickness was excised, fixed in Davidson's solution for 48 h, and embedded in paraffin. Histological sections (5 μm) were stained with Mayer's haematoxylin and eosin (Howard et al. Reference Howard, Lewis, Keller and Smith2004) for examination by light microscopy. Some oysters were lost during histological procedures, and a total of 182 oysters were analysed (December 2011, N = 40; March, N = 39; May, N = 40; August, N = 44 and October 2012, N = 19). Prevalences of parasites and commensal associates were calculated as the proportion of oysters affected in each sample month. The sizes of organisms are shown as Mean±s.e.
Perkinsus sp. diagnosis by Ray's fluid thioglycollate medium (RFTM)
To select oysters infected by Perkinsus sp. for further molecular analyses, 2 gill demibranchs were excised from each oyster for incubation in RFTM (Ray, Reference Ray1966) and a small piece of gill tissue was preserved in 96% ethanol. After 7 days of incubation in RFTM at room temperature (~25 °C) in the dark, the gills were used to determine the presence and intensity of infection by Perkinsus sp. (Ray, Reference Ray1966; da Silva et al. 2013).
PCR assays
Gill samples (50–80 mg) were submitted to DNA extraction with DNAzol (Invitrogen) reagent according to manufacture instructions.
To identify the species of Perkinsus, the internal transcriber spacer (ITS) regions of Perkinsus spp. ribosomal RNA gene complexes were amplified from isolated DNAs, using the genus-specific primers PerkITS-85 and PerkITS-750 (Casas et al. Reference Casas, Villalba and Reece2002). For PCR, 25 μL reactions containing 1 μL of genomic DNA (50–200 ng), 1 × PCR buffer, MgCl2 at 1·5 mm, 0·2 mm nucleotides, 0·4 μ m of each primer and 0·04 U μL−1 of Taq DNA polymerase (da Silva et al. 2013). DNA samples from in vitro cell cultures of P. olseni, from P. marinus (GenBank JX144335; da Silva et al. 2013), and from P. beihaiensis-infected oysters (GenBank FJ472346; Sabry et al. Reference Sabry, Rosa, Magalhães, Barracco, Gesteira and da Silva2009) were used as controls for PCR and PCR–RFLPs analyses.
To identify the species of Crassostrea, PCR reactions were performed as previously described (da Silva et al. 2013) in a total volume of 25 μL, containing 1 μL of genomic DNA (50 ng), PCR 1 × buffer, MgCl2 at 1·5 mm, 0·2 mm nucleotides, 0·4 μ m of each primer and 0·04 U μL−1 of Taq DNA polymerase. The primer pair (16SAR – 16SBR) is targeted to amplify a region of the mitochondrial DNA of the small subunit of ribosomal RNA (16S) (Kessing et al. Reference Kessing, Croom, Martin, McIntosh, Owen and Palumbi1989). DNA samples of oysters C. gasar, C. rhizophorae and C. gigas were used as controls for PCR and PCR–RFLPs analyses.
PCR products were electrophoresed on 1·5% agarose gels, stained with ethidium bromide and visualized by UV illumination.
Restriction fragment length polymorphism (RFLP) analyses
Freshly amplified Perkinsus sp. rDNA ITS-region PCR products from DNA samples of 25 Perkinsus sp.-infected oysters and control DNA samples (P. olseni, P. marinus and P. beihaiensis) were digested separately with the enzymes RsaI and HinfI following manufacturer's protocols (Fermentas) (Abollo et al. Reference Abollo, Casas, Ceschia and Villalba2006). Similarly, PCR–RFLP analysis was performed to identify oyster species among the 39 Perkinsus sp.-infected (34) and uninfected (5) specimens. The freshly amplified 16S mtDNAs were digested with the enzyme AluI (Fermentas). Restriction patterns were compared with those obtained from the control (Perkinsus ssp. and Crassostrea ssp.).
Ten microlitres of digestion products were resolved on an 8% polyacrylamide gel and stained with ethidium bromide.
DNA sequencing and phylogenetic analyses
Freshly amplified Perkinsus sp. rDNA ITS-region PCR products (60 ng) from 15 oyster DNA samples were mixed separately with primers (4·5 pmol), and then dried at 60 °C and send for sequencing at the ACTGene Análises Moleculares Ltd. (Centro de Biotecnologia, UFRGS, Porto Alegre, RS, Brazil). Briefly, samples were labelled with 3 μL of BigDye Terminator v3.1 Cycle Sequencing RR-100 in a final volume of 10 μL. Labelling reactions were performed in a GeneAmp PCR System 9700 thermocycler with an initial denaturing step of 96 °C for 3 min followed by 25 cycles of 96 °C for 10 s, 55 °C for 5 s and 60 °C for 4 min. Labelled samples were analysed using ABI-PRISM 3100 Genetic Analyzer automatic sequencer (Applied Biosystems).
The resulting sequences were compared to those deposited in GenBank using basic local alignment search tool (BLAST; Altschul et al. Reference Altschul, Gish, Miller, Meyers and Lipman1990) of the National Center for Biotechnology Information (NCBI) database. Sequences of rDNA-ITS were aligned using ClustalW (Thompson et al. Reference Thompson, Higgins and Gibson1994) in BioEdit 5.0.9 (Hall, Reference Hall1999). Parsimony bootstrap analysis was done with PAUP*4.0b10 (Swofford, Reference Swofford2002), with 50% deletion and 100 random additions of 1000 replicates. The ITS trees were rooted with the Perkinsus qugwadi Blackbourn et al. 1998 (GenBank no. AF151528) and Parvilucifera infectans Norén et al. 1999 (GenBank no. KF359485) ITS regions sequences. The GenBank accession numbers for the other Perkinsus spp. sequences used in the analyses are annotated in the phylogenetic tree figure (Fig. 7).
Nucleotide sequences reported in this paper are available in GenBank under the accession numbers KP160919 - KP160933
RESULTS
Histopathological analysis
In the present study, histological sections of 182 oysters collected at different times of the year were analysed. Forty-two oysters showed no histopathological changes, whilst the remaining 140 showed different parasitic and commensal organisms.
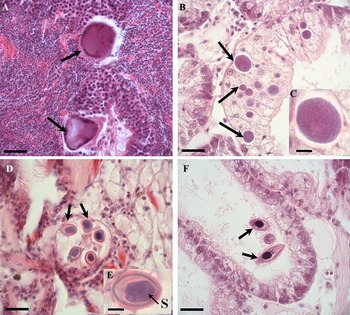
The occurrence of viral gametocytic hypertrophy was characterized by gametes with markedly hypertrophied nuclei (31·0±0·71 μm; range: 28·8 to 31·8 μm; N = 4) in the epithelium of male gonad follicles. The hypertrophied nuclei were basophilic with peripheral heterochromatin (Fig. 1A). This pathology was identified in only 2 oysters; 1 of them showed 3 hypertrophied gametes and the other only 1.
Histological sections of the oyster C. gasar showing parasites and commensals. (A) Male gonad follicle containing 2 altered cells. Note the hypertrophied nuclei and condensed heterochromatin (arrows) at the periphery; (B) epithelial cells of a digestive gland tubule containing various prokaryotic colonies (arrows); (C) magnification of the colony; (D) 5 oocysts (arrows) of Nematopsis sp. in the connective tissue; (E) magnification of 1 oocyst showing the basophilic sporozoite (S); (F) the ciliated Ancistrocoma sp. (arrows) in the lumen of a digestive tubule. Bar = 20 μm for Figures A, B, D and F and 5 μm for Figures C and E.

Prokaryotic colonies were observed as basophilic inclusions in the cytoplasm of epithelial cells of the digestive gland tubules (Fig. 1B). The colonies had a granular appearance and a circular shape of variable size (8·6±0·49 μm; range: 3·8–19·6 μm; N = 79) (Fig. 1C). Infected oysters contained 1–74 colonies per histological section (24±9·1).
The Ancistrocoma sp. Chatton and Lwoff, 1926 (Ciliophora: Ancistrocomidae) had a fusiform shape and measured 8·6–40·6 μm (24·9±7·11 μm; N = 16) (Fig. 1F). One to three (1·0±0·03) Ancistrocoma sp. were observed in the lumen of the digestive tubules and in 1–18 cells (3±0·7) per histological section.
Oocysts of the protozoan Nematopsis sp. Schneider, 1892 (Apicomplexa: Porosporidae) were observed (1–6 oocysts; Fig. 1D) in the connective tissue of all organs of the oysters. The oocysts had a diameter ranging from 8·1 to 13·7 μm (11·7±1·23 μm; N = 23) and contained a basophilic and ellipsoid sporozoite (Fig. 1D and E). The mean intensity of infection was 2·5±0·65 (range: 1–16) oocysts per histological section.
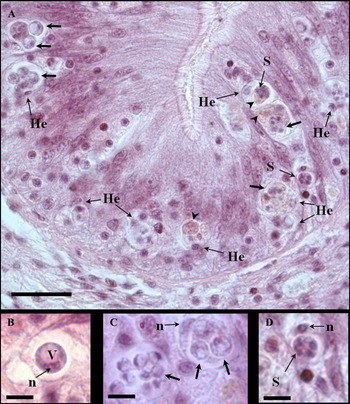
Trophozoites of the protozoan Perkinsus sp. (Perkinsozoa: Perkinsidae) were observed infecting the digestive epithelia of the stomach, intestine and oesophagus. The trophozoites were spherical (3·4±0·12 μm; range: 1·7 to 7·1 μm; N = 87), containing a large vacuole in the cytoplasm, and an eccentric nucleus with a prominent nucleolus (Fig. 2A–C). Occasionally, basophilic schizonts were observed (Figs. 2A and 3D). The trophozoites and, less often, schizonts, were found engulfed by infiltrated haemocytes, which contained 1–9 parasites. The cytoplasm of phagocytic haemocytes occasionally contained a brownish substance (Fig. 2A). Most oysters were lightly infected (1–3 trophozoites in the epithelia), and only 11·2% of the oysters showed a more severe infection (several trophozoites and schizonts engulfed by haemocytes) (Fig. 2A). Those cases were observed in the months of March (10·25%), May (12·5%) and August (2·3%).
Histological sections of a Perkinsus sp.-infected oyster C. gasar. (A) Trophozoites (arrows) and schizonts (S) phagocytosed by haemocytes in the epithelium of the intestine. Note the infiltration by infected haemocytes (He) and the presence of a brownish substance (arrowhead). (B), (C) and (D) Magnification of Perkinsus spp. cells; (B) trophozoite showing a large vacuole (V) and eccentric nuclei with a prominent nucleolus (n); (C) detail of trophozoites of different sizes. Note the eccentric nucleus of the haemocyte (n); (D) phagocytosed schizont showing 4 daughter cells arranged in rosettes. Note the eccentric nucleus of the haemocyte (n). Bar = 20 μm for figure A and 5 μm for figures B, C and D.

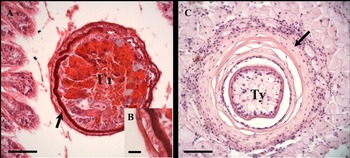
Histological sections of the oyster C. gasar showing metazoans. (A) A cross-section of the turbellarian Urastoma sp. (Ur). Note the ciliated surface (arrow); (B) detail of ciliary margin; (C) cross-section of encapsulated larvae of Tylocephalum sp. (Ty) (arrow). Bar = 50 μm for figures A and C and 10 μm for figure B.

The turbellarian Urastoma sp. Dörler, 1900 (Platyhelminthes) was identified by its round or ellipsoid shape (150·3±23·68 μm; range: 68·0 to 208·7 μm; N = 5) and its surface covered with cilia (Fig. 3A). Urastoma sp. was observed in external spaces between gill lamellae or near gill filaments. Only 1 specimen was observed per histological section, except in 2 cases, in which 2 were observed.
Metazoan Tylocephalum sp. Linton, 1890 (Cestoda: Tetragonocephalidae) larvae were observed encapsulated by haemocytes in the connective tissue near the oesophagus, stomach and intestine (Fig. 3B). Their size ranged from 95·7 to 108·6 μm (103·1±3·74 μm; N = 3). In all cases, there was only 1 encapsulation per histological section.
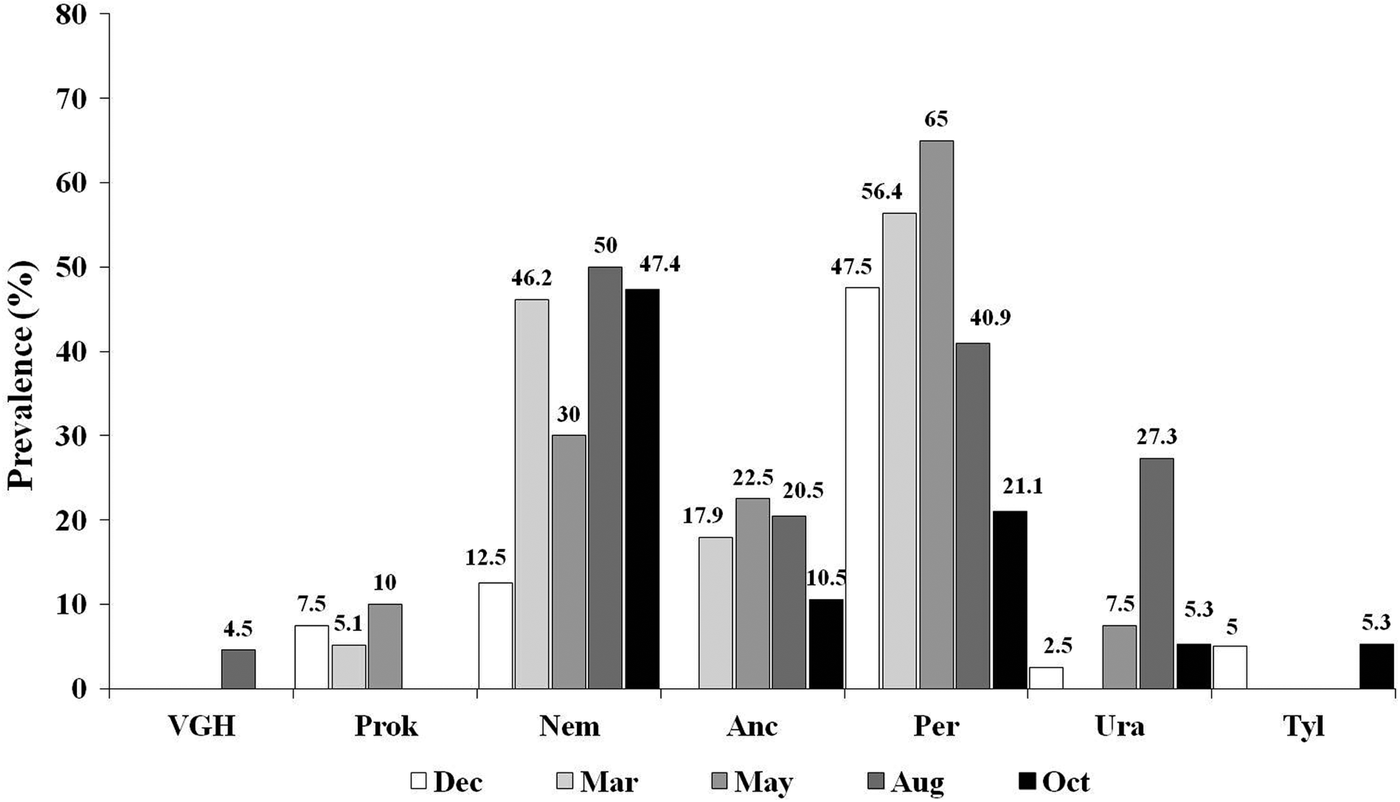
Throughout the study period, the protozoans Perkinsus sp. and Nematopsis sp. were the organisms with the highest overall prevalence, 48·9 and 36·3%, respectively. The remaining organisms were detected with a low mean prevalence: Ancistrocoma sp. (14·8%); Urastoma sp. (9·3%), prokaryotic colonies (4·9%), Tylocephalum sp. (1·6%) and viral gametocytic hypertrophy (1·1%). The monthly prevalence of all organisms is shown in Fig. 4.
Monthly prevalences (%) of parasitic organisms and commensals detected in oysters C. gasar in the months of December 2011, March, May, August and October 2012. VGH: viral gametocytic hypertrophy; Prok: prokaryotic colonies; Nem: Nematopsis sp.; Anc: Ancistrocoma sp.; Per: Perkinsus spp.; Ura: Urastoma sp.; Tyl: Tylocephalum sp.

Identification of oysters Crassostrea spp. by PCR–RFLP
All oysters (N = 39) analysed showed a fragmentation pattern of their 16S mtDNA sequence with the endonuclease AluI identical to the species C. gasar. This pattern had a larger fragment of ~250 bp and a group of smaller fragments less than 100 bp (Fig. 5).
PCR–RFLP for differential diagnosis of Crassostrea spp.. Fragmentation patterns of PCR-amplified products of the mtDNA 16S region from controls C. gigas (Cgi), C. rhizophorae (Cr), C. gasar (Cga) and the Crassostrea sp. samples (S) after digestion with AluI endonuclease. M: 50 bp molecular size marker. All oysters S1–S4 showed fragmentation pattern of C. gasar.

Perkinsus sp. diagnosis by RFTM
Perkinsus sp. infections were detected by RFTM assays in all (4) samples, at prevalences ranging from 80 to 100% (mean = 93·3%) and with sample mean infection intensities of 1·84–2·45 (mean = 2·0), which reflected predominately low and moderate infection intensities.
Identification of protozoans Perkinsus spp. by PCR–RFLP
The rDNA ITS segments amplified by genus Perkinsus–PCR produced 2 different fragmentation patterns when cut with either endonuclease HinfI or RsaI, and those patterns closely corresponded with those of either P. marinus or P. beihaiensis (Fig. 6). In the case of RsaI, for the species P. marinus digestion yielded a group of 3 fragments of very similar size, ~200 bp (triplet), and 1 fragment ~ 60 bp, whereas P. beihaiensis showed 3 well distinguished bands of ~400, ~200 and~ 70 bp (Fig. 6A). In the case of HinfI, for P. marinus the pattern obtained corresponded to 4 easily distinguishable bands of ~400, ~150, ~100 and ~60 bp, whereas P. beihaiensis had a group of 4 fragments with sizes ranging from 150 to 200 bp and 1 smaller of ~10 bp (Fig. 6B).
PCR–RFLP for differential diagnosis of Perkinsus spp. Fragmentation patterns of PCR amplicons of the rDNA ITS region from P. olseni (Po), P. marinus (Pm), P. beihaiensis (Pb) and Perkinsus sp.-infected oysters (S) after digestion with RsaI (A) and HinfI (B) endonucleases. M: 50 bp molecular size marker. PCR amplicons from oysters S1–S3 showed the fragmentation patterns of P. marinus; while those from oysters S4–S6 showed the patterns of P. beihaiensis.

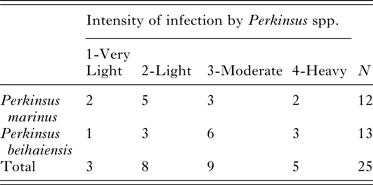
Among 25 RFTM-positive oysters whose DNAs were analysed by PCR–RFLP, 12 were infected by P. marinus and 13 were infected by P. beihaiensis (Fig. 6). The modal (5/12) intensity rank for oysters infected by P. marinus was 2 (light), while the modal (6/13) intensity rank for oysters infected by P. beihaiensis was 3 (moderate) (Table 1).
Number of cases of each of Perkinsus species determined by PCR–RFLP within each intensity of infection (1–4; by RFTM)

Phylogenetic analysis
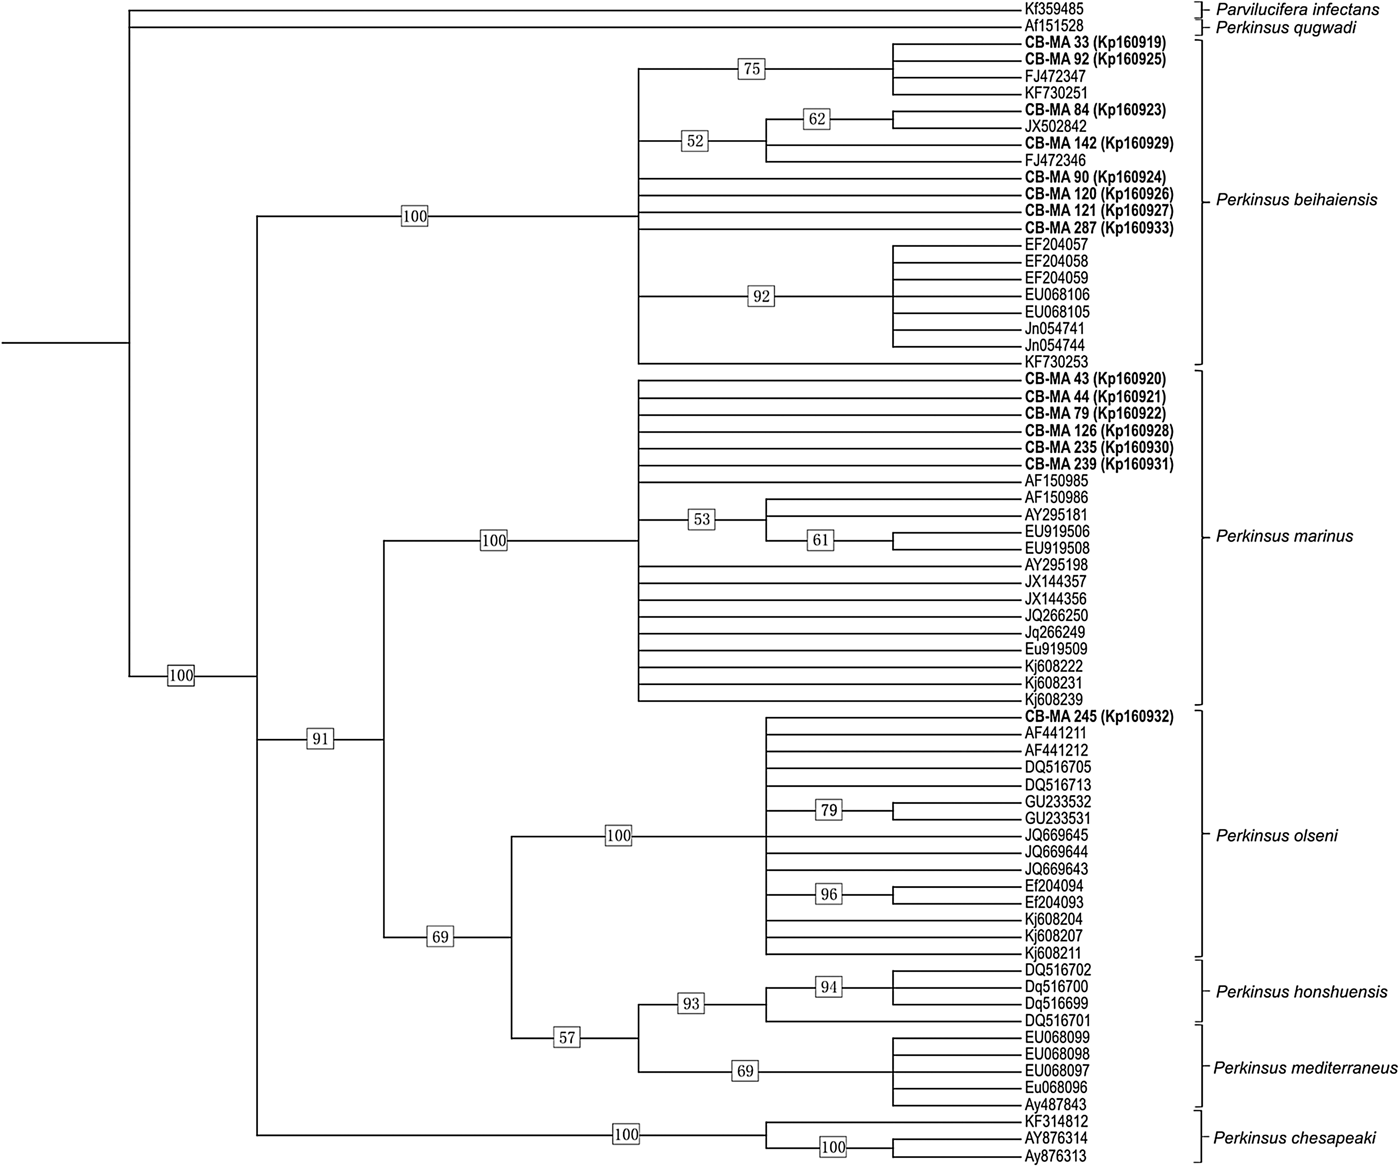
A total of 15 ITS amplicons of Perkinsus spp. were sequenced from 15 individual host samples with different intensities of infection. BLAST analysis of the ITS sequences indicated that P. marinus DNAs had been amplified from 6 oysters (CB-MA43; 44; 79; 126; 235; 239) with 99–100% identity; that P. beihaiensis DNAs had been amplified from 8 oysters (CB-MA33; 84; 90; 92; 120; 121; 142; 287) with 99% identity, and that P. olseni sequence was obtained from 1 oyster (CB-MA245) with 99% identity.
The parsimony topology consisted of 3 clades, one including P. beihaiensis (100%), another (91%) including Perkinsus chesapeaki McLaughlin et al. (2000) (=Perkinsus andrewsi) (100%), and the third containing P. marinus (100%), P. olseni (=Perkinsus atlanticus) (100%), Perkinsus honshuensis Dungan and Reece, 2006 (93%) and Perkinsus mediterraneus Casas et al. 2004 (69%) (Fig. 7). Results of phylogenetic analyses of the ITS sequences were consistent with the species identification from BLAST analyses. The P. marinus (6), P. beihaiensis (8) and P. olseni (1) sequences grouped in clades, with bootstrap support values of 100% (Fig. 7).
Cladogram showing results of maximum parsimony analyses on Perkinsus spp. ITS region sequences. Bootstrap support values are indicated at nodes. Previously determined sequences are indicated by Genbank accession numbers only. Sequences from this study are indicated in bold, with the oyster sample number followed by the Genbank accession number.

DISCUSSION
Histopathological analysis
This study describes the organisms found in the oyster C. gasar cultured in the Mamanguape estuary (NE, Brazil). The most important finding was infection by the protozoan Perkinsus spp., although viral gametocytic hypertrophy (VGH), prokaryotic colonies and other protozoa (Nematopsis sp. and Ancistrocoma sp.) and metazoa (Urastoma sp. and Tylocephalum sp.) were also detected.
The hypertrophy of male gametes, possibly the nuclei, with a basophilic inclusion and peripheral heterochromatin suggests a disease caused by a virus of the Papillomaviridae and Polyomaviridae families that affects bivalve gonads (Garcia et al. Reference Garcia, Robert, Arzul, Chollet, Joly, Miossec, Comtet and Berthe2006; Cheslett et al. Reference Cheslett, McKiernan, Hickey and Collins2009). Viral gametocytic hypertrophy, as the disease is called, has been reported in both gametes of C. gigas (Garcia et al. Reference Garcia, Robert, Arzul, Chollet, Joly, Miossec, Comtet and Berthe2006; Cáceres-Martínez et al. Reference Cáceres-Martínez, Vásquez-Yeomans and Padilla-Lardizábal2010), but only in males of C. rhizophorae (da Silva et al. Reference da Silva, Magalhães and Barracco2012).
The basophilic inclusions with granular appearance in the epithelial cells of the digestive tubules resembled those of prokaryotic colonies, which are commonly found infecting several bivalve species worldwide (Romalde and Prado, Reference Romalde, Prado, Figueras and Novoa2011). In some cases, this infection induced haemocytic infiltration into organs of oysters Crassostrea corteziensis (Hertlein, 1951) (Cáceres-Martínez et al. Reference Cáceres-Martínez, Vásquez-Yeomans and Padilla-Lardizábal2010). Sporadically, associated mortalities are reported, such as in oysters Crassostrea ariakensis (Fujita, 1913) from China (Sun and Wu, Reference Sun and Wu2004) and C. rhizophorae from Brazil (Azevedo et al. Reference Azevedo, Mendonça and Matos2005). Sabry et al. (Reference Sabry, da Silva, Gesteira, Pontinha and Magalhães2011) reported a low intensity of infection (1–5 colonies/histological section) in oysters C. rhizophorae and C. gigas from southern Brazil, contrasting with the more intense cases (up to 74 colonies/histological section) diagnosed in C. gasar from the current investigation.
Ciliates Ancistrocoma sp. are common commensals of oysters and usually do not cause deleterious effects on bivalves (Bower et al. Reference Bower, McGladdery and Price1994).
Nematopsis sp. was the second most prevalent protozoan found, but showed low intensities of infection. Nematopsis sp. has also been identified with varying prevalences throughout the year (20–100%) in oysters C. rhizophorae from Bahia (NE Brazil). The lowest prevalences could be associated with the decreased salinity that occurs during periods of high rainfall in winter (Brandão et al. Reference Brandão, Boehs and da Silva2013a ). In the present study, the occurrence of Nematopsis sp. also followed this pattern, with the highest prevalence in May, the period with high rainfall. However, the low prevalence in December 2011 could not be similarly explained. Thus, a longer survey is recommended to better understand the influence of environment parameters in the occurrence of this protozoan.
Typical trophozoites of the protozoan parasite Perkinsus sp. were observed phagocytosed by haemocytes in the epithelia of the oesophagus, stomach and intestine of the oyster C. gasar. Interestingly, other tissues showed no cells of the parasite. Digestive epithelia are a common Perkinsus spp. infected site in its hosts, including Brazilian oysters (C. rhizophorae and C. gasar) (Moss et al. Reference Moss, Xiao, Dungan and Reece2008; Sabry et al. Reference Sabry, Rosa, Magalhães, Barracco, Gesteira and da Silva2009; Brandão et al. Reference Brandão, Boehs, Sabry, Ceuta, Luz, Queiroga and da Silva2013b ; da Silva et al. Reference da Silva, Scardua, Viana, Mendonça, Vieira, Dungan, Scott and Reece2014). The location of this parasite in host tissue may be associated with the mechanism of entry via food particle capture (Mackin, Reference Mackin1951). Indeed, granulocytes are able to cross the digestive epithelium reaching the lumen of gut where they capture, digest food particles and cross back transporting nutrients to oyster tissues (Kennedy, Reference Kennedy, Newell and Eble1996). Accordingly, granulocytes of C. virginica produce and secret galectins (CvGal), that interacts with algal food and strongly with P. marinus in the gut lumen, function as opsonin and leading to phagocytosis, contributing to spreading the pathogen into host (Tasumi and Vasta, Reference Tasumi and Vasta2007). However, mucus and pseudofaeces may also be considered an entrance for P. marinus to cross the epithelial layer of the mantle (Allam et al. Reference Allam, Carden, Ward, Ralph, Winnicki and Espinosa2013).
Most trophozoites and schizonts were found phagocytosed by haemocytes of the oyster C. gasar infiltrated in digestive epithelia. This finding suggests phagocytosis is an important defence mechanism of the oyster against the parasite Perkinsus sp. In the current investigation, Perkinsus sp. infections were predominantly light. This might be a result of an efficient intracellular lytic mechanism triggered by the host after the phagocytic defence process, which therefore acts to control the spread of disease. The appearance of a brown substance inside infected haemocytes may indicate the involvement of phenoloxidase enzyme (PO). This enzyme is activated by proteolytic cleavage initiated by a cascade of serine proteases that produce various cytotoxic compounds, including quinones (Cerenius and Söderhall, Reference Cerenius and Söderhall2004). The implication of phenoloxidase as a defence mechanism has been suggested in clams R. decussatus infected by P. olseni (Muñoz et al. Reference Muñoz, Meseguer and Esteban2006) and in oysters C. gasar infected by P. marinus/olseni (da Silva et al. Reference da Silva, Scardua, Viana, Mendonça, Vieira, Dungan, Scott and Reece2014). In addition, there is some evidence indicating PO mediates phagolysosomal killing of the protozoan Marteilia sydneyi Perkins and Wolf, 1976, which is phagocytosed by haemocytes of the oyster Saccostrea glomerata (Gould, 1850) (Kuchel et al. Reference Kuchel, Aladaileh, Birch, Vella and Raftos2010). Nevertheless, some oysters (11·2%) harbouring advanced intensities of Perkinsus sp. were also identified. We believe the parasite may also be able to evade the host defence mechanism. Several evasion mechanisms are known for the P. marinus–C. virginica model, such as secretion of serine proteases that act by inhibiting haemocyte function (mobility, agglutination, lysozyme, etc.) and anti-oxidant enzyme activities (acid phosphatase, superoxide desmutases and dependent ascorbate peroxidase) (see review of Soudant et al. Reference Soudant, Chu and Volety2013). Some of these mechanisms could be occurring in the present model and must be elucidated.
The prevalence of Perkinsus sp. in C. gasar determined by histological sections was high during the whole studied period, except in October (21·1%). May was the month with the highest prevalence and frequency of specimens with severe infection. Although May is the month that marks the beginning of the rainy season (April, 5·6 mm against May 116·4 mm), the sampling was taken early (6th) in this month. Thus, the high prevalence in this month reflects the cumulative effect of the dry season, when the highest water temperatures and salinities are recorded. It was in May that these oysters started to suffer an impairment of the immune system (Queiroga et al. Reference Queiroga, Marques-Santos, Hégaret, Soudant, Farias, Schlindwein and da Silva2013). Perkinsus marinus and P. olseni are strongly associated with high temperatures and salinities (see reviews of Villalba et al. Reference Villalba, Reece, Ordás, Casas and Figueras2004, Reference Villalba, Gestal, Casas, Figueras, Figueras and Novoa2011; Choi and Park, Reference Choi, Park, Ishimatsu and Lie2010). Studies conducted to explore the influence of such abiotic parameters on the prevalence of Perkinsus sp., have been performed only for the latter species (see review of Villalba et al. Reference Villalba, Gestal, Casas, Figueras, Figueras and Novoa2011). In Brazil, recently, a seasonal pattern of Perkinsus sp. prevalence and intensity of infection was demonstrated in cultured and wild oyster C. gasar populations from Sergipe State, which is located 450 km south of Paraíba State. An abrupt drop in prevalence was observed in winter (July), when salinity was the lowest (24‰) compared to summer's 34‰ (da Silva et al. Reference da Silva, Scardua, Viana, Mendonça, Vieira, Dungan, Scott and Reece2014). However, more confident environmental data (daily and continuous temperature and salinity monitoring) must be collected in order to study their influence on the dynamics of infection by Perkinsus spp. in tropical hosts.
The turbellarian Urastoma sp. showed a very low prevalence and intensity in the oyster C. gasar, as observed for oysters in Brazil (Sabry et al. Reference Sabry, da Silva, Gesteira, Pontinha and Magalhães2011, Reference Sabry, Gesteira, Magalhães, Barracco, Guertler, Ferreira, Vianna and da Silva2013; da Silva et al. Reference da Silva, Magalhães and Barracco2012). Urastoma sp. are free-living organisms and can inhabit the body cavities and gills of bivalves, not penetrating the tissues. As a result of environmental changes, they may become abundant and over-inhabit, causing disruption of oysters C. corteziensis gills (Cácerez-Martínez et al. Reference Cáceres-Martínez, Vásquez-Yeomans and Padilla-Lardizábal2010).
Cestode larvae of Tylocephalum sp. were observed encapsulated with no damage to the host tissue, as reported before (Sabry et al. Reference Sabry, da Silva, Gesteira, Pontinha and Magalhães2011, Reference Sabry, Gesteira, Magalhães, Barracco, Guertler, Ferreira, Vianna and da Silva2013; da Silva et al. Reference da Silva, Magalhães and Barracco2012; Dang et al. Reference Dang, Cribb, Cutmore, Chan, Hénault and Barnes2013).
Identification of the Perkinsus sp.
The PCR–RFLP analysis confirmed oysters cultivated in the estuary of the Mamanguape River belong to the species C. gasar. The oysters were infected by P. marinus and P. beihaiensis, both parasites having already been reported on the northeastern coast of Brazil (Sabry et al. Reference Sabry, Rosa, Magalhães, Barracco, Gesteira and da Silva2009; da Silva et al. 2013). Although P. marinus is considered a dangerous species for oyster health, here the majority of P. marinus-infected oysters showed light infection (level 2). In contrast, the impact of P. beihaiensis on its hosts has not yet been studied. Our results showed P. beihaiensis mostly occurred with moderate infection (level 3). Perhaps this explains why, despite the high prevalence Perkinsus sp. achieved in the C. gasar population, its impact seemed to be very low and no mortality event was reported (data from the oyster producer). This result provides insights for future studies on the differential susceptibility of the oysters C. gasar to Perkinsus spp. A previous study showed P. olseni, P. marinus and dual-infection among oysters C. gasar from Sergipe State (da Silva et al. Reference da Silva, Scardua, Viana, Mendonça, Vieira, Dungan, Scott and Reece2014).
Phylogenetic analyses based on nucleotide sequences of the ITS region consistently placed all sequences within the genus Perkinsus. Sequences studied corresponded to 3 known Perkinsus spp. It was not a surprise to find P. marinus infecting oysters in the estuary of the Mamanguape River, which is located around 40 km from the estuary of Paraíba do Norte, where P. marinus was recently reported for the first time infecting C. rhizophorae in Brazil (da Silva et al. 2013). Concerning the host studied, P. marinus was also recently reported in this oyster C. gasar species, from Sergipe State (da Silva et al. Reference da Silva, Scardua, Viana, Mendonça, Vieira, Dungan, Scott and Reece2014). However, to date, P. beihaiensis has been reported in the oyster C. rhizophorae (Sabry et al. Reference Sabry, Rosa, Magalhães, Barracco, Gesteira and da Silva2009) and the clam A. brasiliana (Ferreira et al. in press) from Brazil, Crassostrea madrasensis Preston, 1916 from India (Sanil et al. Reference Sanil, Suja, Lijo and Vijayan2012), and Crassostrea hongkongensis Lam and Morton, 2003 and C. ariakensis from China (Moss et al. Reference Moss, Xiao, Dungan and Reece2008).
Concluding remarks
The majority of organisms found in the cultured oyster C. gasar were rare or occasionally observed and showed low pathological potential. Only the protozoan Perkinsus sp. and Nematopsis sp. occurred with moderate monthly prevalence. The protozoan Perkinsus sp. showed light intensity in the tissue; thus, the host defence response might control the spread of the parasite. Three species of Perkinsus were identified in oyster C. gasar: P. marinus and P. beihaiensis were more abundant than P. olseni. Some evidences suggest that this oyster species might be differentially susceptible to P. marinus and P. beihaiensis.
ACKNOWLEDGEMENTS
We thank the Conselho Nacional de Desenvolvimento Científico e Tecnológico (CNPq) for financial support to the projects No. 474976/2011-4 and CNPq/MPA No. 406170/2012-6. We sincerely appreciate the scholarships provided for F. R. Queiroga (CAPES/UFPB), C. B. Vieira and N. D. Farias (CNPq/UFPB). We are also grateful to the oyster producer Sebastião L. da Costa.