


Introduction
Xinjiang Uygur Autonomous Region of China lies in central Asia. Due to the continental climate and sparse rainfall, the land is dry and parched. More than 80% of the total area of Xinjiang is arid or semiarid. The water supply, especially for irrigation of farmland, of which over 90% of the total area is irrigated, depends strongly on the rivers which originate in high mountains and are fed in large part by snow and glacier meltwater runoff. Because of the uneven distribution in time and space of runoff from melting of snow and ice, on which processes information is lacking, serious consequences such as drought and flood disasters occur frequently. These problems are becoming increasingly urgent for the development of agriculture and other economic activities.
The runoff arising from melting glaciers and snowpack is responsible for both the annual instantaneous maximum discharge and a large portion of the total annual flow in Xinjiang. The contribution of snowmelt runoff to river flow usually occurs in the months from March to May, but the quantities vary from year to year and from place to place. On the average, it is in the range of 40 to 70% of the total in the Altay mountains, over 20% in the Tien Shan mountains, and close to 20% in the Kunlun mountains.
Although the investigation of glacier meltwater runoff has received a good deal of attention since the 1950s, e.g. the hydrology studies on Glacier No. 1 at the headwater of Ürümqi River in 1959, on Tuomuer Glacier in 1977, on Bogeda Glacier in eastern Tien Shan in 1981, and on glaciers in the Altay mountains in 1981 (Reference YangYang, 1988), runoff from snowmelt has not been fully studied in Xinjiang, and studies based on physical principles were only started in the late 1980s. The present study was therefore carried out in order to enable an understanding of the energy supplies to and losses from a snow cover and to determine the feasibility of using the surface energybalance approach for estimating the rate of snowmelt in the area of the western Tien Shan mountains.
Surface Energy Balance
During snowmelt period, the energy balance at the snow surface is given by

where Qm is the energy available for melting, Qn is the net radiation flux, Qh is the sensible heat flux, Qe is the latent heat flux, Qp is the heat flux due to rain-on-snow, and Qgis the ground heat flux.
The terms on the righthand side of Equation (1) are to be evaluated or measured in order to obtain Qm. The net radiation flux can be measured with a radiometer. Evaluation of Qh and Qe requires measurements of temperature, humidity and wind speed at two or more levels above the snow surface. However, during the melt period, the snow surface is nearly 0°C and the surface humidity is close to 100% (Liu Zongchao, unpublished report, 1988; personal communication from Bai Zhong-yuan). This permits the use of the bulk transfer approach to calculate the fluxes of sensible and latent heat


where
θs and θz are temperatures at the snow surface and at a height z meters above the surface (K),
esand ez are vapour pressures at the snow surface and at a height z meters above the surface (Pa),
ρα is the air density (kg m−3),
Ca is the specific heat of air at a constant pressure (J kg−1 K−1),
L is the latent heat of vaporization (J kg−1),
ε is the ratio of the molecular weights of water and air (dimensionless),
Ρ is the atmospheric pressure (Pa),
Uz is the wind speed at height z (m s−1),
D is the drag coefficient under neutral conditions (dimensionless).
The drag coefficient is obtained by
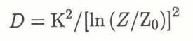
where Κ is von Karman’s constant, and Z0 is the surface roughness, empirically found to be 0.005 m (Reference ChiChi, 1983).
The bulk transfer equations are valid only for neutral atmospheric conditions. If conditions are not neutral, D is adjusted for the stability of the atmosphere using the Richardson number Ri (Reference Price and DunnePrice and Dunne, 1976)

where g is the acceleration due to gravity (m s−2) and Usthe wind velocity at the snow surface (m s−1). For stable conditions (Ri > 0), the drag coefficient is

where σ is a constant with a value of 10 (Reference Price and DunnePrice and Dunne, 1976). Under unstable conditions (Ri < 0), the drag coefficient can be modified by

In the western Tien Shan, rainfall is usually light during the snowmelt period, and the contribution of Qp is negligible. The ground heat flux is also small by comparison with the energy fluxes at the snow surface. During the melt period of 1987, for example, the measured ground heat flux was in the range from 0.2 to 0.7 W m−2. Hence the ground heat flux Qg can be considered as zero.
Study Site And Data Collection
The study site was located on an open, south-facing gentle slope of about 7°, near the Tianshan Snow and Avalanche Research (TSAR) Station (43°16′N, 84°24′E; 1776 m a.s.l.) of the Xingjiang Institute of Geography, Chinese Academy of Sciences, in the mid-mountain zone of the Tien Shan. The station lies in the upper reaches of the Gongnisi River, a tributary of the Yili River. This area, referred to locally as the “wet island in arid lands”, has a temperate and humid climate. Mean annual air temperature recorded at the TSAR Station is 1.3°C (1973–86), and average annual maximum and minimum temperatures are 12.6 and −14.5°C in July and January, respectively. Mean annual precipitation is 827.3 mm with a maximum of 1139.7 mm. This area has a mean winter snow depth of 0.84 m with a maximum of 1.52 m. It is estimated that snowfall accounts for about 30% of annual precipitation. Winter lasts for about 4 to 5 months. Snowmelt usually begins in late March and is completed within three weeks.
This study was carried out from 26 March to 13 April 1987. Measurements for energy-balance calculations included net radiation, air temperature, humidity and wind speed. Temperatures, from which vapour pressures were then calculated, were measured with dry- and wet-bulb thermometers. Wind speed was measured with cup-type anemometers. Temperatures and wind speeds were measured every two hours at 1 m above the snow surface. Net radiation was measured hourly with a Swissteco net radiometer at a height of 1.5 m above the snow surface, signals being recorded by a microcomputer through A/D conversion. The heights of all instruments were frequently adjusted to ensure a constant distance above the snow surface. Atmospheric pressure was obtained from the TSAR Station located 50 m south of the study site.
The lowering of the snow surface was measured with reference to five marked stakes dispersed over 400 m2 and daily ablation determined by averaging the measurements of daily changes in the snow depth, and converting the average snowmelt depth into water equivalent using daily measured average surface densities of snow.
Snow-surface energy balance was calculated to provide an estimate of Qm. Daily snowmelt, Md, was determined from daily Qm

expressed in water equivalent units as

where Md is amount of snowmelt (m d−1), Mw is snowmelt expressed as water equivalent (m d−1), Lf is latent heat of fusion (0.333 MJ kg−1), ρ is daily average density of snow, and ρw is density of water (1000 kg m−3). Calculated values of snowmelt, Hc, were then compared with the ablation measurements, Hm, made at the study site.
Results And Discussion
The measurements of microclimatological elements and the surface energy balance at 2-hourly intervals throughout the melt season are shown in Figure 1. The components of energy-balance calculated on a daily basis are tabulated in Table 1 where heat received at the snow surface is given a positive sign. During the melt period, which lasted for about three weeks, albedo decreased gradually as the snow cover thinned because there was an accumulation of dust and changes of crystal form at the snow surface. Relatively high albedo occurred following snowfall but decreased rapidly due to sustained melting (Reference Zongchao, Li and GuotangLiu and others, 1989).
The results are given in Figure 1 and Table 1. Daily energy balance varied considerably since no weather pattern dominated for any great length of time. For example, a few days with high net radiation fluxes were frequently succeeded by a period of one or two days with much lower contributions under overcast or snowy conditions. This variability is typical of spring synoptic conditions in the area (Reference Ruji and WenshouHu and Wei, 1987).
Sensible heat flux, Qh, showed no increase as the season progressed. Significant contributions were received during sunny, warm and windy days. Qh inputs tended to be low and some losses from the snow cover occurred during overcast or snowy days.
In the early part of the melting season, Qe inputs to the snow cover dominated, indicating that Qe inputs to snow overwhelmed Qe losses, or surface condensation greatly exceeded evaporation. Qe losses from the snow surface mainly occurred in the latter part of the study period, and proved to be more significant during the days with strong wind. Qe inputs to and losses from the snow cover were relatively small throughout the melt period as compared with Qn and Qh, which indicates the unimportance of Qe as a source or sink of energy in the longer term.
Measured and calculated microclimalological elements at the study site between 26 March and 13 April 1987.

Three types of weather conditions were common during the study period. The dominant condition was clear days with high air temperatures and low wind speeds, which occupied about half of the 19-day study period. On these days, wind speeds were normally less than 2 m s−1 and air temperatures often reached 10°C during the day. Under such conditions, the drag coefficient for stable conditions, Ds, is well under D (neutral) and the stability correction factors Cs (+ Ds/D) calculated from Equations (4), (5) and (6) are less than 0.54, so that both Qh and Qe are much reduced. The second type was cloudless days with high air temperatures and higher wind speeds. Although wind speeds over 3 m s−1 were observed on only five days (26, 27 March and 5, 6, 9 April) with a maximum of 4.6 m s−1 on 27 March, they can produce sizeable turbulent exchanges because Csvalues under these conditions are much higher (in the range from 0.78 to 0.96). The third type of weather condition was overcast days, some with snowfall. During these days, both air temperature and wind speeds were usually relatively low and Cs values varied greatly, being especially sensitive to wind-speed changes. During the entire melt period, stable and neutral atmospheric conditions occurred 98% of the total period of measurement, and unstable conditions for the remaining 2% only.
Components of energy balance and the measured (Hm) and calculated (Hc) snowmelt during the study period in 1987

Table 1 indicates that Qn was the dominant energy source over the snow cover, and that Qh and Qe were of secondary importance. Calculations for the snow cover as a whole show that Qn accounted for 76.9% of the net heat input and net Qh for 23.1%. 97.1% of the energy absorbed at the snow surface was used for melting while Qe consumed 2.9% (Table 1). One of the factors which may have contributed to the increased importance of Qn is the distinctive spring weather. During the melt period, air temperatures are often relatively high in the daytime and sizeable transfers of Qh and Qe can occur. However, as the season progresses, unsettled weather often reduces turbulent exchange, increasing the importance of Qn. Another factor affecting Qn is the change in albedo during sustained melting. For example, albedo decreased from 0.82 (measured at 12.00 h, Local Standard Time) on 31 March to 0.43 on 2 April, and from 0.78 on 7 April (snowfall) to 0.31 on 9 April.
Diurnal variation of energy fluxes for two contrasting days are shown in Figures 2 and 3. On cloudless days with high wind speeds, there were sizeable Qn contributions to the snow cover, large Qh inputs and some Qe losses. On 1 April, for example, a clear day with maximum air temperature of 15.9°C and average wind speed of 1.1 m s−1, Qn became positive at about 07.00 h (LST) and the peak input (287.8 W m−2) occurred at 12.00 h (Fig. 2). Qh was positive throughout the day with a maximum 61.5 W m−2 at 14.00 h, lagging Qn by about two hours. Qe showed net loss (−3.2 W m−2) but appeared positive during the latter half of the day.
On overcast days with low wind speed, energy inputs to the snow cover were lower. On 8 April, which was overcast with average air temperature of 3.6°C and average wind speed of 0.7 m s−1, there were small Qn contributions to the snow cover, and minor Qe losses (Fig. 3). Higher values of Qh and Qe occurred only once when the wind speed reached 1.4 m s−1 at 10.00 h, illustrating immediate response to changes in weather conditions.
Diurnal variations of the surface energy balance components on 1 April 1987, under clear conditions (Local Standard Time).

Diurnal variations of the surface energy balance components on 8 April 1987, under overcast conditions (Local Standard Time).

Comparison of cumulative calculated snowmelt (dashed line) and cumulative measured ablation (solid line).

Plot of total daily observed snowmelt against total daily calculated ablation.

Cumulative daily melt values obtained from energy-balance calculations correspond closely to the cumulative measured ablation curve (Fig. 4), indicating the suitability of the energy-balance approach for estimating snowmelt. Maximum daily ablation for the snow cover was 31.3 mm of water equivalent. Snowfall led to total suppression of melt on 10 April. The total ablation measured in the entire period was 211.4 mm but the calculated value was 243.1 mm, a discrepancy explained by divergence during the last few days of the melt period when the snow cover became patchy and large snow-free areas appeared. These errors probably reflect the underlying principle of the energy-balance approach, which assumes a vertical, one-dimensional flux, which is not valid at the margins of snow patches. When, on 13 April, only 350 mm of snow remained, net surface energy of 13.09 MJ m−2 would have been able to melt more snow than was available, which explains the significant difference between measured and calculated ablation on that day. In general, calculated snowmelt is greater than that measured (Fig. 5).
Conclusions
Snowmelt in the western Tien Shan mountains can be successfully calculated by the energy-balance approach. Overall, net radiation was the dominant energy source, accounting for 76.9% of the net energy absorbed by snow cover, while sensible heat contributed 23.1%. There was a net loss of latent heat from the snow cover during the study period. Because warm air temperature and low wind speeds characterize the weather conditions in the mid-mountain zone of the western Tien Shan during the snowmelt season, vapour pressure of the air was often close to or above the saturation vapour pressure for melting snow. This steep temperature gradient and limited vapour gradient above the snow lead to a great transfer of sensible heat but a trivial latent heat flux. Sizeable transfers of sensible and latent heat were observed only under cloudless skies with high wind speed. Such transfers were often reduced because of unsettled weather in the area.



