Introduction
The Indo-Pacific biogeographic region is an important global biodiversity hotspot, particularly the Indonesia–Philippines archipelago (Mora et al., Reference Mora, Chittaro, Sale, Kritzer and Ludsin2003; Tittensor et al., Reference Tittensor, Mora, Jetz, Lotze, Ricard, Berghe and Worm2010). Algae, molluscs, fishes, arthropods and corals all have their maximum diversity in this region (Hoeksema, Reference Hoeksema and Renema2007). However, despite considerable research efforts in this area, not all ecosystems have been equally studied. Seagrasses in particular have been poorly studied (Waycott et al., Reference Waycott, Duarte, Carruthers, Orth, Dennison, Olyarnik, Calladine, Fourqurean, Heck, Hughes, Kendrick, Kenworthy, Short and Williams2009; Ooi et al., Reference Ooi, Kendrick, Van Niel and Affendi2011), despite the Indo-Pacific region having the highest seagrass diversity in the world (Short et al., Reference Short, Carruthers, Dennison and Waycott2007).
Seagrass meadows have a wide range of functional roles, including supporting extensive primary and secondary production (Duarte & Cebrián, Reference Duarte and Cebrián1996), habitat provision (Heck et al., Reference Heck, Hays and Orth2003), facilitating sediment accumulation and stabilization (Orth et al., Reference Orth, Carruthers, Dennison, Duarte, Fourqurean, Heck, Hughes, Kendrick, Kenworthy, Olyarnik, Short, Waycott and Williams2006) and nutrient cycling (Romero et al., Reference Romero, Lee, Mateo, Alcoverro, Larkum, Orth and Duarte2006; McGlathery et al., Reference McGlathery, Sundbäck and Anderson2007). As a result, human food security is very dependent on seagrass health, particularly for industrial- and small-scale fisheries production (Unsworth et al., Reference Unsworth, Nordlund and Cullen-Unsworth2019). Therefore, it is critical to maintain the ecological function of seagrass meadows, particularly in the Indo-Pacific (Unsworth et al., Reference Unsworth, Ambo-Rappe, Jones, La Nafie, Irawan, Hernawan, Moore and Cullen-Unsworth2018).
The resilience of seagrass ecosystems is influenced by the interaction of three main factors: the biological features of the seagrass, the supporting ecosystem and the biophysical environment (Unsworth et al., Reference Unsworth, Collier, Waycott, McKenzie and Cullen-Unsworth2015). Furthermore, Unsworth et al. (Reference Unsworth, Collier, Waycott, McKenzie and Cullen-Unsworth2015) identified seagrass species diversity, seagrass cover, macroalgal cover, epiphyte cover and water transparency as the five most-used resilience parameters that have been incorporated into seagrass monitoring guidelines (e.g. McKenzie et al., Reference McKenzie, Campbell and Roder2001; Short et al., Reference Short, Coles and Short2015), since these data are easy and cheap to collect. Seagrass species life-history traits have also been used to classify seagrass resilience modes (e.g. Carruthers et al., Reference Carruthers, Dennison, Longstaff, Waycott, Abal, McKenzie and Long2002, Reference Carruthers, Dennison, Kendrick, Waycott, Walker and Cambridge2007; Waycott et al., Reference Waycott, McKenzie, Mellors, Ellison, Sheaves, Collier, Schwarz, Webb, Johnson and Payri2011). Based on seagrass growth forms and reproductive strategies that may contribute to resilience, seagrass species have been categorized into colonizing, opportunistic and persistent species (Kilminster et al., Reference Kilminster, McMahon, Waycott, Kendrick, Scanes, McKenzie, O'Brien, Lyons, Ferguson, Maxwell, Glasby and Udy2015). Colonizing species have a short turnover time (<months) of ramets, quickly reach (<month) sexual maturity and produce dormant seeds. In contrast, persistent species have a long turnover time (months–years) of ramets, a very long time to reach sexual maturity (years), and do not typically form seed banks. Opportunistic seagrass species combine the core features of these previous two groups to colonize quickly, produce seeds or seedlings and maintain persistent biomass, and rapidly recover from seeds if needed. These sets of traits lead to different responses to disturbance.
Despite the identification of resilience features of seagrass species, little is known about the role of seagrass-associated benthic communities (Unsworth et al., Reference Unsworth, Collier, Waycott, McKenzie and Cullen-Unsworth2015). Sponges are major components of benthic communities across the globe, including seagrass meadows (Van Soest et al., Reference Van Soest, Boury-Esnault, Vacelet, Dohrmann, Erpenbeck, De Voogd, Santodomingo, Vanhoorne, Kelly and Hooper2012; Bell et al., Reference Bell, McGrath, Kandler, Marlow, Beepat, Bachtiar, Shaffer, Mortimer, Micaroni, Mobilia, Rovellini, Harris, Farnham, Strano and Carballo2020). For example, Barnes (Reference Barnes1999) reported that sponges were the dominant sessile form in the seagrass meadows of the Quirimba Archipelago in East Africa. Sponges were also reported as one of the dominant benthic organisms in a Posidonia australis seagrass meadow in south-eastern Australia (Demers et al., Reference Demers, Knott and Davis2015). However, the ecology of seagrass sponges has generally been poorly studied compared with coral reef sponges, and there is a paucity of information on whether the drivers of sponge and seagrass assemblage composition are the same. This information is important for the development of appropriate and scale-dependent management strategies.
Sponges are sessile suspension feeders that have many functional roles (Bell, Reference Bell2008), including impacts on the substrate (see review by Schönberg et al., Reference Schönberg, Fang, Carballo, Carballo and Bell2017), carbon and nitrogen cycling (e.g. Jiménez & Ribes, Reference Jiménez and Ribes2007; Hadas et al., Reference Hadas, Shpigel and Ilan2009; Hoffmann et al., Reference Hoffmann, Radax, Woebken, Holtappels, Lavik, Rapp, Schlappy, Schleper and Kuypers2009; Hoer et al., Reference Hoer, Gibson, Tommerdahl, Lindquist and Martens2018), and facilitating primary production (e.g. Wilkinson, Reference Wilkinson1983; Erwin & Thacker, Reference Erwin and Thacker2008). A number of biotic and abiotic factors have been identified as controlling spatial and temporal variability in sponge assemblages and species, although these drivers are often species-specific (e.g. Ramsby et al., Reference Ramsby, Hoogenboom, Whalan, Webster and Thompson2017; Beepat et al., Reference Beepat, Woods, Davy, Jhugroo and Bell2020) due to the adaptive plasticity of sponges to environmental factors (Carballo et al., Reference Carballo, Sanchez-Moyano and Garcia-Gomez1994). Morphological variation is an important adaptation mechanism found in sponges in responses to changes in the environmental conditions (Palumbi, Reference Palumbi1984). For example, elephant-ear and vase-like morphologies have been reported to strongly correlate with local water movement and sedimentation rate (Pronzato et al., Reference Pronzato, Bavestrello and Cerrano1998).
Few studies have described spatial variation in sponge abundance and diversity in the Indo-Pacific region, and most of the available studies have been on coral reef sponges and have highlighted the importance of environmental conditions as the major drivers (e.g. de Voogd et al., Reference de Voogd, Cleary, Hoeksema, Noor and van Soest2006; Cleary & de Voogd, Reference Cleary and de Voogd2007; de Voogd et al., Reference de Voogd, Becking and Cleary2009; Madduppa et al., Reference Madduppa, Schupp, Faisal, Sastria and Thoms2015; Utami et al., Reference Utami, Zamani and Madduppa2018). For example, Bell & Smith (Reference Bell and Smith2004) reported that depth, surface angle and sedimentation rates were important drivers for sponge assemblages at two reefs in the Wakatobi National Park, Indonesia. Meanwhile, from the western part of the Indonesia Archipelago, de Voogd & Cleary (Reference de Voogd and Cleary2008) reported 118 sponge species inhabited the reefs across Jakarta Bay to the north part of Seribu Islands (60 km away from the mainland Jakarta). These authors observed increased sponge diversity further offshore from the Jakarta mainland, where the water quality improved. Meanwhile, a longitudinal pattern was described in a study from the south coast of Java Island, where sponge species and morphological diversity gradually increased from the west to the east of the island (Hadi et al., Reference Hadi, Hafizt, Hadiyanto, Budiyanto and Siringoringo2018).
Despite the paucity of information on the ecology of seagrass sponge assemblages in the Indo-Pacific, some studies have revealed what might drive abundance and diversity patterns. For example, Wulff (Reference Wulff1995) suggested that top-down processes prevent reef-sponges from occupying the adjacent seagrass meadows in San Blas Islands, Republic of Panama. However, sponges can also form intra-phyletic mutualistic relationships to overcome predators and increase sponge diversity in seagrass meadows (Wulff, Reference Wulff2008). Biophysical features may also be important drivers of seagrass abundance and diversity patterns. Attrill et al. (Reference Attrill, Strong and Rowden2000) suggested that seagrass structural complexity did not determine the size and composition of the associated macroinvertebrates, including sponges, but the abundance of the seagrass plants did. Furthermore, a study in the Gulf of Mexico suggested that the proportion of coarse particles in the substrate was the best variable to explain sponge distribution in seagrass meadows (Ávila et al., Reference Ávila, Ávila-García and Cruz-Barraza2015). Finally, ambient nutrient availability has also been reported as a driver in the outcome of sponge–seagrass interactions in the Bahamas (Archer et al., Reference Archer, Hensel and Layman2018).
In the Indo-Pacific region, particularly in the Indonesia Archipelago, ecological studies on seagrass sponges are scarce, and they have all concentrated on Java Island. Ismet et al. (Reference Ismet, Bengen, Radjasa and Kawaroe2017) reported 18 sponge species inhabiting a multispecies seagrass meadow in the Seribu Islands National Park, Jakarta, which had species-specific correlations with each seagrass species cover in the meadow. Meanwhile, 16 sponge species were recorded in two seagrass meadows in the Gulf of Pacitan, East Java, where the assemblages were dominated by the boring sponge Spheciospongia inconstans (Setiawan et al., Reference Setiawan, Chodiantoro, Insany, Subagio, Dewi and Muzaki2021). There are still major gaps in our knowledge of the ecology of sponge assemblages in seagrass ecosystems.
Detailed surveys are the first step in understanding ecological processes and the drivers of abundance and diversity patterns, which is crucial for effective management plans. Based on sites and zones within our studied seagrass meadow (Hoga Island in the Wakatobi National Park), we recorded the seagrass species diversity, seagrass cover, canopy height, macroalgal cover, epiphytes cover and water transparency. For the sponge assemblage, we recorded the sponge diversity and abundance, and determined the growth form for each sponge species. In this study we aimed to: (1) determine the ecological status of the seagrass meadow and its resilience capacity by measuring habitat resilience parameters (utilizing the Seagrass Ecological Quality Index developed by Hernawan et al., Reference Hernawan, Rahmawati, Ambo-Rappe, Sjafrie, Hadiyanto, Yusup, Nugraha, La Nafie, Adi, Prayudha, Irawan, Rahayu, Ningsih, Riniatsih, Supriyadi and McMahon2021) and by classifying the seagrass species composition (grouped by their response to disturbances; after Kilminster et al., Reference Kilminster, McMahon, Waycott, Kendrick, Scanes, McKenzie, O'Brien, Lyons, Ferguson, Maxwell, Glasby and Udy2015); (2) investigate spatial distribution patterns of the seagrass and sponge assemblages in the seagrass meadow; (3) consider the importance of sponge morphology in driving distribution and abundance patterns; and (4) explore the potential drivers of sponge and seagrass assemblages.
Materials and methods
Study site and design
Our study was conducted in a seagrass meadow on the western side of Hoga Island in the Wakatobi National Park, Indonesia, which lies within the Coral Triangle region. The fieldwork was carried out during June–July 2019. The Wakatobi National Park (WNP) experiences semidiurnal tides with a maximum amplitude of 2.3 m, whereby much of the seagrass in the area is exposed to air during a low spring tide (Unsworth et al., Reference Unsworth, De León, Garrard, Jompa, Smith and Bell2008; personal observation). The region's seagrass meadows are dominated by Thalassia hemprichii and Enhalus acoroides, with minor floral coverage (i.e. under 5% coverage) of three other seagrass species – Cymodocea rotundata, Halophila ovalis and Halodule uninervis (Unsworth et al., Reference Unsworth, Wylie, Smith and Bell2007). A seagrass survey in 2006 reported that the studied seagrass meadow had an average seagrass cover of 70 ± 3.2%, and 1.8 ± 0.1 mm sized coral sand substrate (Unsworth et al., Reference Unsworth, De León, Garrard, Jompa, Smith and Bell2008). Across the study area, the seagrass and substrate were visible through the water column from the surface, which is likely due to the very shallow water depth (especially at the high-shore zone).
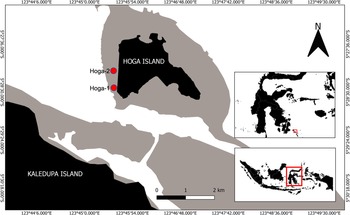
The seagrass meadow was a continuous meadow, and as a spatially separated replicate, we categorized the study area into two sites and three zones. The sites were separated into Hoga-1 (5°28′27″S 123°45′57″E) and Hoga-2 (5°28′07″S 123°45′35″E), and the zones within each site were categorized as high shore (HS), middle shore (M) and near-reef-flat (NRF) zones (Figure 1). Hoga-1 was at the southern part of the meadow, close to the canal between Kaledupa Island and Hoga Island, while Hoga-2 was further north. The categorization of the zones was based on the distance to shore, whereby during high tide, the water depth of high-shore, middle and near-reef-flat zone was ~0.5, 1.2, and 1.9 m depth, respectively. Three transects were used at each zone at each site, and a tape measure was laid perpendicular to the shoreline, resulting in nine transects (N = 9) at each site (across all zones), and six transects (N = 6) in each zone (across both sites). The transect length was 50 m, and the distance between the parallel transects in the same zone was ~150 and 300 m for Hoga-1 and Hoga-2, respectively. In the high-shore zone, the transect began at 5 m after the seagrass edge, perpendicular to the shoreline towards the sea. In the near-reef-flat zone, the transect began at ~5–10 m from the reef-flat boundaries towards the island (i.e. shore). In the middle zone, the transect was placed approximately halfway between the two other zones.
Location of the two study sites on the west side of Hoga Island's seagrass meadow, Wakatobi National Park, South-east Sulawesi – Indonesia.

Estimation of site area
We used aerial images to calculate the areal coverage of the sites and zones following the methods of Subhan et al. (Reference Subhan, Arafat, Santoso, Madduppa, Prabowo, Yugiswara, Hakim, Susilo, Khairudi, Awak and Khair2018). A drone (DJI Mavic Air 2) shot multiple vertical aerial images from 150 m height in the morning (before 10 am) to avoid glare. We used Pix4Dcapture (PIX4D, accessed online 22 July 2019) to create a route for the drone to take orthophotos for building up an orthomosaic map of the study site. We set the route to take images resulting in an overlap of 80% to merge the pictures afterwards. All the pictures were merged using Agisoft Metashape, and we then calculated the area covered by seagrass from the merged image with QGIS 3.18 (QGIS, accessed online 14 February 2020).
Hoga-1 was a seagrass meadow between two jetties, while the meadow between the north jetty and the national park's field office was considered Hoga-2 (see Supplementary Figure S1). The high-shore zone covered the area where the seagrasses started to occur to the point where there was a depth change. The zone was always exposed to air during low tide. From the authors’ observations, the boundary was 70 m from the shoreline, confirmed by the orthophotos, where a change in seagrass density was observed. The near-reef-flat (NRF) zone was the seagrass-dominated area just behind the reef flat. From the orthophoto, we drew the boundaries from the point where seagrasses started to dominate the reef-flat, extrapolated to the point where coral reefs were no longer observed. The middle zone was between the high-shore and near-reef-flat zones, where seagrasses entirely dominated the meadow.
Seagrass and sponge assemblage composition and abundance
We surveyed the seagrass meadow following the methods of Seagrass Watch (McKenzie et al., Reference McKenzie, Campbell and Roder2001). Using a 0.25 m2 metal quadrat, we recorded the seagrass species and measured the seagrass cover and canopy height, and macroalgal and epiphyte cover at 5 m intervals along the transect, resulting in 11 observations for each transect. We used the seagrass guidebook produced by the Indonesia National Institute of Sciences (Rahmawati et al., Reference Rahmawati, Irawan, Supriyadi and Azkab2014) to identify seagrass species, which was based on Kuo & Hartog (Reference Kuo, Hartog, Short and Coles2001). We used the percentage cover standards provided by the Seagrass Watch (McKenzie et al., Reference McKenzie, Campbell and Roder2001) for seagrass and macroalgal cover. In each quadrat, which was placed haphazardly, we measured the length of five leaf-blades and averaged the measurements for the quadrat's canopy height. The epiphyte cover was estimated as the percentage of covered blades. For the seagrass composition, we assigned each species into one of the three groups based on its life-history traits: colonizing, opportunistic and persistent species (after Kilminster et al., Reference Kilminster, McMahon, Waycott, Kendrick, Scanes, McKenzie, O'Brien, Lyons, Ferguson, Maxwell, Glasby and Udy2015) to understand how the meadow might respond to disturbance.
For the sponge survey, we recorded the volume of sponges that we encountered within 2.5 m either side of the transect, resulting in total coverage of 250 m2 per transect. The water-displacement method (after Rützler, Reference Rützler, Stoddart and Johannes1978) was used to measure the sponge volume, whereby we used either a graduated cylinder or measuring cup, depending on the size and shape of the sponge, with a volumetric resolution of 10 ml. We put the sponge in the cylinder or cup and topped it up with seawater to the full volume scale. Then, we took the sponge out and recorded the volume lost as the sponge volume. All sponges were returned to their original location and position in the seagrass meadow after their volume was measured. Sponge volume is the best abundance metric for sponge assemblages with diverse morphologies as it provides a more appropriate measure of the sponge-related ecological process (e.g. feeding rate, respiration rate and gross productivity) compared with other sponge abundance metrics (Bell et al., Reference Bell, Biggerstaff, Bates, Bennett, Marlow, McGrath and Shaffer2017).
To better understand sponge adaptations to living in seagrass ecosystems, we qualitatively assessed sponge morphological variation. We determined the morphology of each sponge species based on the classification of Schönberg (Reference Schönberg2021). Schönberg (Reference Schönberg2021) divided sponge growth forms into four basic morphologies: crusts, massive, cups and erect sponges. For finer resolution, Schönberg (Reference Schönberg2021) further divided these basic morphologies into: (1) crust – true crusts, endolithic-bioeroding, and creeping sponges; (2) massive – simple massive, globular massive, composite-massive, and fistular sponges; (3) cups – cups, tubes, and barrels; (4) erect – one-dimensionally, two-dimensionally and three-dimensionally erect forms, stalked, and carnivorous sponges. Not all these morphologies were found in our study system. The finer resolution sponge morphological classification was used as it is thought to provide a better proxy for environmental conditions (Schönberg, Reference Schönberg2021).
Data analysis
Habitat and sponge assemblage structure
We averaged the abundance of each seagrass and sponge species in all areas (i.e. every zone in both sites) and used the mean to calculate the species composition in each area. We also averaged the five habitat resilience parameters: the seagrass species richness, seagrass cover, canopy height, macroalgal cover and epiphytes cover. We did not average the water transparency since all the areas experienced the same conditions.
The state of seagrass meadow
We used the seagrass Ecological Quality Index (SEQI) to describe the health status of our seagrass beds, allowing us to make comparisons with other locations, especially in Indonesia. We calculated the index following the methods described by Hernawan et al. (Reference Hernawan, Rahmawati, Ambo-Rappe, Sjafrie, Hadiyanto, Yusup, Nugraha, La Nafie, Adi, Prayudha, Irawan, Rahayu, Ningsih, Riniatsih, Supriyadi and McMahon2021). The index uses five parameters standardized to each maximum possible value; the parameters are the seagrass species richness, seagrass cover, macroalga cover, epiphyte cover and water transparency. The equation to calculate the SEQI was as follows:

where, S t = seagrass species richness observed; S ref = max value of seagrass species richness (9); C t = seagrass per cent cover observed; C ref = max value of seagrass cover (100); W t = water transparency observed; W ref = max value of water transparency (2); M t = macroalga per cent cover observed; M ref = max value of macroalga per cent cover (100); E t = epiphyte per cent cover observed; E max = max value of epiphyte cover (100).
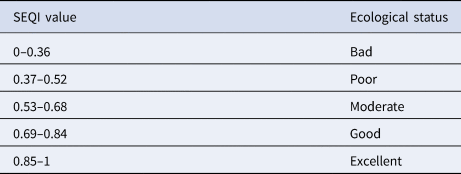
Since we could see the seagrass and the seafloor on all our transects, according to the scoring guide by Hernawan et al. (Reference Hernawan, Rahmawati, Ambo-Rappe, Sjafrie, Hadiyanto, Yusup, Nugraha, La Nafie, Adi, Prayudha, Irawan, Rahayu, Ningsih, Riniatsih, Supriyadi and McMahon2021), the water transparency score for all stations was two (W t = 2; i.e. the max possible value). Based on SEQI values, seagrass ecological status can be categorized into five levels: bad, poor, moderate, good and excellent (see Table 1 for the SEQI threshold value).
The seagrass ecological state category based on the value of SEQI (after Hernawan et al., Reference Hernawan, Rahmawati, Ambo-Rappe, Sjafrie, Hadiyanto, Yusup, Nugraha, La Nafie, Adi, Prayudha, Irawan, Rahayu, Ningsih, Riniatsih, Supriyadi and McMahon2021)

Statistical analysis
Permutational multivariate analysis of variance (PERMANOVA) was used to determine any differences between zones, sites and their interactions, for the seagrass and sponge assemblage composition data. The sponge and seagrass abundance data were log-transformed to reduce the effect of rare species. Meanwhile, square-root transformation was applied to the habitat resilience parameter data to reduce the effect of the wide range of values among the parameters. Differences in the assemblage structure were graphically plotted using non-metric multidimensional scaling based on Bray–Curtis similarities. When we found any differences in the multivariate data (i.e. significantly different in PERMANOVA analysis), similarities percentage (SIMPER) analyses were run to identify the species that characterized the differences between zones and sites. All statistical analyses were performed by the software PRIMER v6 (with the PERMANOVA+ add-on; Anderson et al., Reference Anderson, Gorley and Clarke2008).
Results
Habitat and seagrass assemblage structure
The total areas of the two studied seagrass meadows were 0.151 and 0.213 km2 for Hoga-1 and Hoga-2, respectively. Meanwhile, the high-shore, middle and near-reef-flat zone coverage across both sites were 0.064, 0.213 and 0.087 km2, respectively.
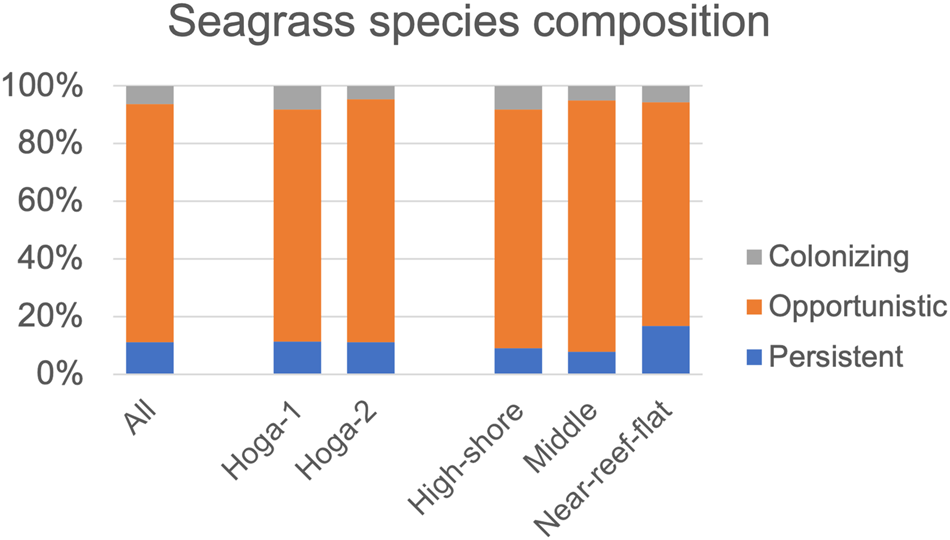
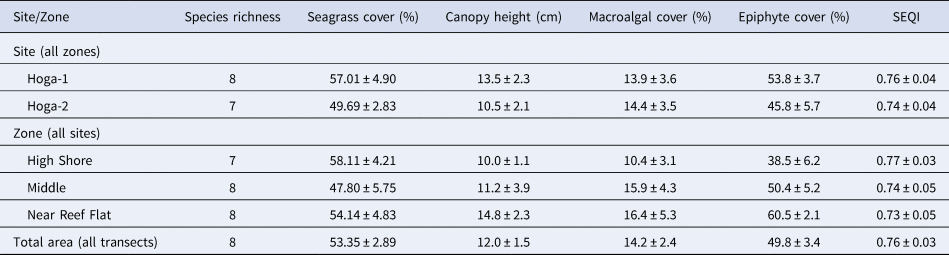
The seagrass cover of the studied meadow ranged between 48–58%, with an overall average of 53 ± 3% (see Table 2). We recorded eight seagrass species at our study site, which was composed of two persistent species (Enhalus acoroides (Linnaeus f.) Royle and Thalassia hemprichii (Ehrenberg) Ascherson in Petermann); four opportunistic species (Cymodocea rotundata Ehrenberg & Hemprich ex Ascherson, Cymodocea serrulata (R.Brown) Ascherson & Magnus, Halodule uninervis (Forsskål) Ascherson and Syringodium isoetifolium (Ascherson) Dandy); and two colonizing species (Halophila minor (Zollinger) den Hartog, Halophila ovalis (R.Brown) J. D. Hooker). We found all the seagrass species at all sites and all zones, except for Syringodium isoetifolium, which was only found in the middle and near-reef-flat zones of Hoga-1. Opportunistic species dominated the seagrass assemblage, contributing 77–84% of the total seagrass cover (Figure 2). Both sites were dominated by Cymodocea rotundata, which contributed 48 ± 8 and 65 ± 9% of the seagrass cover at Hoga-1 and Hoga-2, respectively.
The seagrass species composition of the studied seagrass meadow, grouped into three categories based on its life-history traits: colonizing, opportunistic and persistent species (after Kilminster et al., Reference Kilminster, McMahon, Waycott, Kendrick, Scanes, McKenzie, O'Brien, Lyons, Ferguson, Maxwell, Glasby and Udy2015).

Seagrass species richness, cover, canopy height, macroalgal and epiphyte cover, and seagrass ecological quality index (SEQI) of Hoga Island's seagrass meadow, Wakatobi National Park, Indonesia

Means are expressed ± SE.
The macroalgal cover in the seagrass sites was relatively low, ranging between 10–16% with an average of 14.2 ± 2.4 for the entire meadow. The epiphyte cover in the seagrass meadow ranged between 39–61% with an average of 49.8 ± 3.4%. Based on the five measured parameters, the SEQI of the meadow ranged between 0.73–0.77, with an average of 0.76 ± 0.03 for the entire meadow. Based on SEQI, the studied seagrass meadow was categorized as being in good condition.
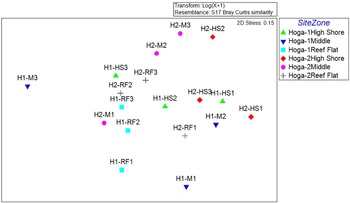
Seagrass assemblages were highly variable among sites and zones (Figure 3). However, the two-way PERMANOVA test did not show significant differences in seagrass assemblage composition between sites, zones and their interactions (see Supplementary Table S1). Of the seagrass habitat's resilience parameters (i.e. seagrass cover, seagrass diversity, canopy height, macroalgal cover and epiphytes cover), we did not observe any significant difference between sites and zones, or for any interactions (see Supplementary Table S1), suggesting a homogeneous seagrass meadow.
Non-metric Multidimensional Scaling (MDS) plot of seagrass assemblage structure for both sites and all three zones.

Sponge assemblage structure
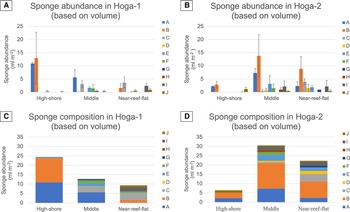
We recorded 10 sponge species across the studied seagrass meadow: Spongia sp., Spheciospongia sp., Phyllospongia foliascens, Haliclona koremella, Amphimedon sp., Dactylospongia elegans, Axinella sp., Clathria reinwardti, Siphonodictyon mucosum and Rhopaloeides sp. (see Supplementary Figure S2 for the sponges' photographs), which had a species-specific abundance at each site and zone (Figure 4A, B). We found all 10 sponges at both sites. However, while we found all 10 sponges in the middle and near-reef-flat zones, only five sponge species inhabited the high-shore zone: Spongia sp., Spheciospongia sp., Amphimedon sp., Siphonodictyon mucosum and Rhopaloeides sp. The most sponge-abundant (litre sponge per m2) zone in Hoga-1 and −2 were the high shore and middle zone, respectively (Figure 4C, D). As the zone covered the largest area of the meadow, the middle shore zone was estimated to have the highest total sponge biomass in Hoga-1 and -2, where sponge biomass could reach 1458 and 6181 litres, respectively (see Supplementary Table S2).
Sponge abundance (A and B) and species composition (C and D) at each zone at Hoga-1 and Hoga-2. Sponge species key: A, Spongia sp.; B, Speciospongia sp.; C, Phyllospongia foliascens; D, Haliclona koremella; E, Amphimedon sp.; F, Dactylospongia elegans; G, Axinella sp.; H, Clathria reinwardti; I, Rhopaloeides sp.; J, Siphonodictyon mucosum.

We found all four basic growth forms in the sponge assemblage, whereby six sponges had a massive growth form, two sponges had an erect growth form, one sponge had a cup-like form and there was one sponge crust-like growth form (Supplementary Table S3). In the more refined classification, we found seven morphologies out of 14 growth forms. There were three sponges with fistular–endopsamnic morphology, two sponges with massive composite morphologies, and the other five morphologies were only represented by one sponge species.
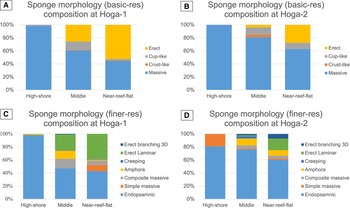
Based on the basic growth form classification, we found that massive morphologies dominated the seagrass meadow at all sites and zones (Figure 5A, B). However, its contribution decreased further away from the shore. At the high-shore zones (both sites), almost 100% of the sponges were massive morphologies, declining to 60 and 80% at Hoga-1 and -2, respectively, in the middle zone. The abundance of this morphology further decreased to 44 and 63% in the near-reef-flat zone at Hoga-1 and -2, respectively. The massive morphologies were dominated by endopsamnic sponges – sponges where most of their body is buried under the substrate, at both sites and all zones (Figure 5C, D). We also observed an increase in erect growth forms, dominated by erect-laminar morphology, towards the near-reef flat zone shore at both sites. Meanwhile, cup-like growth forms, represented only by the amphora morphology, were most common in the middle zone at both sites.
Sponge morphology composition at Hoga-1 (A and C) and Hoga-2 (B and D) in basic (A and B) and more refined (C and D) resolution based on the classification by Schönberg (Reference Schönberg2021).

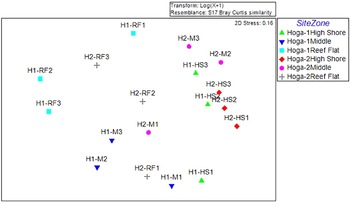
The sponge assemblage in our studied seagrass meadow varied with each combination of site and zone (Figure 6). The two-way PERMANOVA test showed that the sponge species composition was significantly different between sites (Pseudo-F = 2.7285, P < 0.05), zones (Pseudo-F = 5.2376, P = 0.001) and there was an interaction between sites and zones (Pseudo-F = 3.4014, P = 0.003). The significant zone–site interaction for the sponge species composition means that the way the factor zone influenced the sponge assemblages was different between sites. Therefore, sponge assemblages at Hoga-1 and -2 had different zonation patterns. The n-MDS plot (Figure 6) showed that while the sponge assemblage at every zone in Hoga-1 was different, the sponge assemblage in the high-shore and middle zone of Hoga-2 were much more similar to each other.
Ordination of sponge assemblage structure for each site and zone based on non-metric multidimensional scaling.

The similarities percentage (SIMPER) analysis showed that Spongia sp. characterized Hoga-1 similarities (44%), while at Hoga-2, both Spongia sp. and Spheciospongia sp. were similarly representative of the site (35 and 34%, respectively). Based on zones (across sites), Spongia sp. contributed 62% to the high-shore zone's similarities (across sites). Spongia sp. contributed 40% in the middle zone, followed by Spheciospongia sp. by 19% to the zone's similarities. In the near-reef-flat zone, Phyllospongia foliascens and Rhopaloeides sp. were the most contributing sponges to the zone's similarities by 36 and 22%, respectively (see Supplementary Table S4 for full results of SIMPER).
Discussion
Very little is known about the ecology of sponge assemblages in Indo-Pacific seagrass ecosystems, including the drivers of abundance and distribution patterns, their interactions with seagrass species, and whether the drivers of seagrass and sponges are the same and co-dependent. This information is important for developing effective conservation management plans. Our study is the first to show how sponge assemblages change across seagrass zones from the shore to the reef. We found that even though seagrass beds were generally homogeneous between sites and zones, the sponge assemblage compositions were significantly different between the zones, suggesting they have different drivers. We propose that these patterns are at least partly driven by morphological adaptation to the local environmental conditions. Our study also revealed that sponge assemblages varied significantly between two sites in a continuous seagrass meadow with little spatial separation (i.e. based on sites across all zones), suggesting that water depth or level of aerial exposure area is not the only driver of sponge assemblage patterns.
The state of the seagrass meadow
Our survey found that the meadow had 53.35 ± 2.89% seagrass cover, and we recorded eight seagrass species. This is considerably different from the results from previous studies on the same seagrass meadow ~13–14 years earlier, where the meadow was reported to have ~70% seagrass cover and was occupied by only five seagrass species (Unsworth et al., Reference Unsworth, Wylie, Smith and Bell2007, Reference Unsworth, De León, Garrard, Jompa, Smith and Bell2008). The sampling effort is likely the reason for the higher seagrass diversity in our study since our sampling effort was about 10 times the sampling effort of the previous study, which increased our ability to find more seagrass species. Our study showed a decline of almost 20% seagrass cover from these previous studies across 2005 and 2006 (i.e. Unsworth et al., Reference Unsworth, Wylie, Smith and Bell2007, Reference Unsworth, De León, Garrard, Jompa, Smith and Bell2008). Even though our study is only a snapshot of the seagrass meadow condition, it suggests a large decline in seagrass cover over the last 13–14 years.
Our study also showed that the meadow has experienced a shift in assemblage composition. The seagrass bed was dominated by Thalassia hemprichii and Enhalus acoroides in 2005–2006 (Unsworth et al., Reference Unsworth, Wylie, Smith and Bell2007, Reference Unsworth, De León, Garrard, Jompa, Smith and Bell2008), but is now dominated by Cymodocea rotundata (the present study). Based on seagrass life-history traits, Thalassia hemprichii and Enhalus acoroides are persistent seagrass species, while Cymodocea rotundata is an opportunistic seagrass (Kilminster et al., Reference Kilminster, McMahon, Waycott, Kendrick, Scanes, McKenzie, O'Brien, Lyons, Ferguson, Maxwell, Glasby and Udy2015). Coupled with Cymodocea serrulata, Halodule uninervis and Syringodium isoetifolium, opportunistic seagrasses dominated the meadow consistently across sites and zones accounting for over 80% of the cover. The decline in seagrass cover and the shift in assemblage composition may have resulted from environmental pressures on the seagrass meadow. With respect to local disturbances, there has been no intensive local coastal development that might have directly affected the seagrass meadow in our studied area. The clear water transparency that we observed during our survey reflected this condition. However, we did observe considerable invertebrate gleaning activities in our studied seagrass meadow. Invertebrate gleaning is a small-scale fishery that is mostly unreported and unregulated globally, including Indonesia (Unsworth et al., Reference Unsworth, Nordlund and Cullen-Unsworth2019). Therefore, the impacts of this fishing method are mostly unknown despite its direct effect on the seagrass habitat (Nordlund et al., Reference Nordlund, Erlandsson, de la Torre-Castro and Jiddawi2011). Nordlund et al. (Reference Nordlund, Erlandsson, de la Torre-Castro and Jiddawi2011) reported that the people who have been doing this fishing method for 5–10 years observed a 30% decline in harvest and ~60% decline after three decades. This indicates how severe and chronic invertebrate gleaning impacts could be to the seagrass and its inhabitant macrofauna.
The seagrass cover of our studied meadow fell in the range of the national park's average seagrass cover. The periodic monitoring programme by the Indonesian Institute of Sciences reported an average of 55.28 and 53.28% seagrass cover in 2015 and 2018, respectively, across the Wakatobi National Park (Sjafrie et al., Reference Sjafrie, Hernawan, Prayudha, Supriyadi, Iswari, Anggraini, Rahmat Anggraini, Rahmawati and Suyarso2018; Hernawan et al., Reference Hernawan, Rahmawati, Ambo-Rappe, Sjafrie, Hadiyanto, Yusup, Nugraha, La Nafie, Adi, Prayudha, Irawan, Rahayu, Ningsih, Riniatsih, Supriyadi and McMahon2021). Our studied meadow's seagrass ecological quality index (SEQI) score ranged between 0.73–0.77, similar to the national park's SEQI score (SEQI = 0.75; Hernawan et al., Reference Hernawan, Rahmawati, Ambo-Rappe, Sjafrie, Hadiyanto, Yusup, Nugraha, La Nafie, Adi, Prayudha, Irawan, Rahayu, Ningsih, Riniatsih, Supriyadi and McMahon2021), and was therefore categorized as a ‘good’ seagrass meadow. Indonesia's national average SEQI is currently 0.68 ± 0.02 with 39 ± 4% seagrass cover, which puts our seagrass meadow's condition as one of the best seagrass meadows. However, considering the considerable decline in seagrass cover (~20%) and the shift in seagrass composition in about a decade experienced in our studied meadow, it seems that the SEQI score does not necessarily reflect a high resilience capacity that might be expected from a ‘good’ seagrass meadow. We suggest applying different weights to each parameter to give a better indication of the seagrass condition, such as those used in the calculation of coral reef and mangrove health indices (Kaufman et al., Reference Kaufman, Obura, Rohwer, Sala, Sandin and Tschirky2011; Faridah-Hanum et al., Reference Faridah-Hanum, Yusoff, Fitrianto, Ainuddin, Gandaseca, Zaiton, Norizah, Nurhidayu, Roslan, Hakeem, Shamsuddin, Adnan, Awang Noor, Balqis, Rhyma, Siti Aminah, Hilaluddin, Fatin and Harun2019). We also argue that the seagrass composition based on life-history traits categories (i.e. persistent, opportunistic and colonizing seagrass) may be better to describe seagrass meadow condition, rather than the seagrass diversity (i.e. the number of seagrass species) alone. In addition, water transparency did not differentiate our seagrass sites and may not be that useful as an assessment parameter for intertidal seagrass meadows with relatively very shallow water depth.
Seagrass assemblage patterns
Our studied meadow was a 1.1 km long continuous seagrass meadow that covered ~0.364 km2 area. The two-way PERMANOVA test did not show any significant differences in the abundance or assemblage composition between zones or sites (Supplementary Table S1), suggesting that the meadow was a homogeneous seagrass meadow. The spatial scale of seascape studies is critical to understanding the ongoing physical and biological processes that drive the organism distributions (Boström et al., Reference Boström, Pittman, Simenstad and Kneib2011). In our case, the scale of spatial separation between sites and zones was not large enough to capture major drivers of biological patterns for the seagrass species.
Sponge species richness and abundance
We found 10 sponge species in our studied seagrass meadow, similar to other studies. For example, 9–11 sponge species were reported inhabiting seagrass meadows in East Java – Indonesia (Setiawan et al., Reference Setiawan, Chodiantoro, Insany, Subagio, Dewi and Muzaki2021). One to 10 sponge species were also found in sub-temperate seagrass meadows on the south-eastern Australia coast (Demers et al., Reference Demers, Knott and Davis2015). However, compared with the adjacent coral reefs in the Wakatobi, the sponge species richness in our studied seagrass meadow was much lower. There are over 140 sponge species reported on the coral reefs adjacent to our studied seagrass meadow (Rovellini et al., Reference Rovellini, Dunn, Fulton, Webster, Smith, Jompa, Haris, Berman and Bell2019). A similar ratio was observed in Seribu Islands National Park – Jakarta, where 118 sponge species were recorded in the coral reefs (de Voogd & Cleary, Reference de Voogd and Cleary2008), while the seagrass meadows were inhabited by only 13–15 sponge species (Ismet et al., Reference Ismet, Bengen, Radjasa and Kawaroe2017). The extreme conditions of salinity, temperature, sedimentation and air exposure that seagrass meadows experience likely explain the much lower species richness of the sponges in seagrass beds compared with coral reefs (Pawlik et al., Reference Pawlik, McMurray and Henkel2007).
Despite much lower sponge species richness than on the local coral reefs, our studied seagrass meadow had considerable sponge biomass. We estimated that the total sponge biomass across the entire meadow (in volume) was 2938 and 7681 litres at Hoga-1 (0.151 km2) and Hoga-2 (0.213 km2), respectively (Supplementary Table S4; see Figure 4 for the average sponge biomass per m2). This sponge biomass would be expected to have a substantial impact on the seagrass meadow environment. Sponges can efficiently remove particulate (POM) and dissolved organic matter (DOM) from the water column (e.g. de Goeij et al., Reference de Goeij, van den Berg, van Oostveen, Epping and van Duyl2008; Hadas et al., Reference Hadas, Shpigel and Ilan2009) and potentially affect the picoplankton abundance (e.g. Pile et al., Reference Pile, Patterson and Witman1996; Perea-Blazquez et al., Reference Perea-Blazquez, Davy and Bell2012). Some sponges also facilitate primary production by hosting phototrophic symbionts that can support their nutritional needs (Wilkinson, Reference Wilkinson1983; Erwin & Thacker, Reference Erwin and Thacker2008). These interactions have the potential to affect the flow of matter and energy in the seagrass beds. Sponges could also potentially contribute to nitrogen cycling, since the sponges may be harbouring high microbial abundance (Southwell et al., Reference Southwell, Weisz, Martens and Lindquist2008; Ribes et al., Reference Ribes, Jimenez, Yahel, Lopez-Sendino, Diez, Massana, Sharp and Coma2012).
Unfortunately, only a few studies have reported sponge biomass (Bell et al., Reference Bell, McGrath, Kandler, Marlow, Beepat, Bachtiar, Shaffer, Mortimer, Micaroni, Mobilia, Rovellini, Harris, Farnham, Strano and Carballo2020), making it difficult to compare our results. The one study that did record sponge volume in seagrass meadows was Demers et al. (Reference Demers, Knott and Davis2015) in Jervis Bay, south-eastern Australia Demers et al. (Reference Demers, Knott and Davis2015). These authors reported that the total sponge volume at their most abundant site was 4.4 ± 0.8 ml m−2. Meanwhile, in the middle zone of Hoga-2, the sponge abundance (expressed in volume) was about 30 ml m−2 (Figure 4), about six times higher. Further research will be required to understand these biogeographic patterns.
Sponge assemblage patterns and morphological variation
Sponges had considerable biomass at both sites and all zones of our studied seagrass (Figure 4). We found that sites, zones and their interactions in a continuous seagrass meadow affected sponge assemblage distribution (see full PERMANOVA in Supplementary Table S3). Five sponge species inhabited the high-shore zone, while the other two zones had 10 sponge species. The high-shore zone is likely only habitable for sponges that can survive extended periods of aerial exposure. The zonation down the shore is likely based on the water depth during low tide, resulting in a different period of exposure to air.
Morphological adaptation plays an important role in the survival of sponges to different environmental conditions (e.g. Palumbi, Reference Palumbi1984; Bell & Barnes, Reference Bell and Barnes2000; Rützler et al., Reference Rützler, Duran and Piantoni2007). The high-shore zone was characterized by Spongia sp. and Speciospongia sp. (see full SIMPER in Supplementary Table S4), with their biomass contributing more than 90% of the total sponge biomass (Figure 4). These two sponges were endopsamnic sponges and are mostly buried in the sediment, which is thought to be an adaptation to aerial exposure (e.g. Schönberg, Reference Schönberg2000; Vinod et al., Reference Vinod, George and Manisseri2009). By having most of their tissue buried in the sediment, the sponges can reduce water loss due to aerial exposure and prevent overheating. The sponges' convex or erect parts (i.e. fistulas) also avoid sediment build-up on their surfaces and prevent blocking of the sponge's aquiferous system. The middle zone was characterized by Spongia sp., Speciospongia sp. and Amphimedon sp. (Supplementary Table S4). While Spongia sp. and Speciospongia sp. are endopsamnic sponges, Amphimedon sp. occurs in an amphora or sack-like morphology, hollow inside, with a narrowed apical osculum that increases the oscular size and prevents sediment settlement (Krautter, Reference Krautter1998; Bell, Reference Bell2004). Schönberg (Reference Schönberg2021) suggested that amphora or sack-like morphology is suited to moderate sedimentation levels. Meanwhile, the near-reef-flat zone was characterized by erect-laminar sponge Phyllospongia foliascens, which dominated the sponge biomass (Figure 4). This sponge has a flexible and vertically flattened morphology with high spongin content that can bend when it experiences strong water movement. These features are well suited to areas that experience considerable water movement, which is often experienced in this zone as waves break over the reef crest (Schönberg & Fromont, Reference Schönberg and Fromont2011).
Sponge assemblages were also significantly different between sites. However, no single sponge species contributed substantially to this difference (i.e. more than 30% of contribution) (see Supplementary Table S4 for SIMPER results). We also found a significant difference in the interaction between site and zone, meaning the way that zones influence the sponge assemblage varied between the sites. The sponge biomass in each zone at each site showed different patterns. At Hoga-1, the high-shore had the highest sponge biomass, followed by the middle and near-reef-flat zones. In contrast, the high-shore zone at Hoga-2 had the lowest sponge biomass among the three zones. The pattern at Hoga-2 was similar to what was reported from a seagrass meadow in the Gulf of Mexico, where sponge abundance and biomass was relatively higher at the most distant sites from shore (>150 m) (Ávila et al., Reference Ávila, Ávila-García and Cruz-Barraza2015). However, this was not the case at Hoga-1. This shows that the zonation based on shore height is not the only driver of the sponge assemblages in the studied seagrass meadow. Other factors that might explain these patterns include differences in shore slope, seafloor sediment composition and nutrient supply (Bell & Smith, Reference Bell and Smith2004; Hunting et al., Reference Hunting, Franken, Knopperts, Kraak, Vargas, Röling and van der Geest2013; Archer et al., Reference Archer, Hensel and Layman2018). It is also possible that biological processes may also influence sponge distribution patterns, particularly variability in recruitment patterns. For example, some sponges (e.g. Ettinger-Epstein et al., Reference Ettinger-Epstein, Whalan, Battershill and de Nys2008) have been shown to exhibit gregarious settlement behaviour, which has the potential to result in patchy distribution patterns.
Conclusion
Our studied seagrass meadow was in good condition based on the SEQI despite having undergone a major loss of seagrass cover over the last 15 years. Sponges appeared to have considerable biomass across the meadow and are an important benthic component. Importantly, while we found no difference in seagrass assemblages between sites or zones, sponge assemblage compositions were significantly different, suggesting these assemblages have different environmental or biological drivers. We propose that the degree of aerial exposure is an important driver of the differences between zones to which sponges show some degree of morphological adaptation. The differences between sites are harder to explain and will require a further detailed examination of the differences in the physical conditions at the two sites.
Supplementary material
The supplementary material for this article can be found at https://doi.org/10.1017/S002531542200087X.
Data
The data that support the findings of this study are available from the corresponding author, R.B., upon reasonable request.
Acknowledgements
A permit to carry out research in the national park (SIMAKSI) was issued to Ramadian Bachtiar (permit number S.456/T.21/TU/REN/3/2019) by the Wakatobi National Park Authority, the Ministry of Environment and Forestry of Republic of Indonesia. Ramadian Bachtiar also held a special permit to collect biological samples from the wild (permit number S.1011/T.21/TU/REN/7/2019) and to transport biological samples to New Zealand (export permit number S.46/KKH/MJ/KSA.2/10/2019), issued by the Directorate General of Ecosystem and Natural Resources Conservation, the Ministry of Environment and Forestry of Republic of Indonesia. Operation Wallacea supported the accommodation, travel and logistics of this study in Hoga Island. We would like to thank Muhammad Wijdan Taqiyuddin for the assistance with the orthophotos and map. We are very grateful for the staff and volunteers of the Hoga Island Marine Research Station. We thank the anonymous reviewers for the constructive comments and feedback to this manuscript. This paper is dedicated to Hawis H. Madduppa – one of the co-authors of this paper, who passed away in May 2022, who guided us in navigating the research landscape in Indonesia.
Author contributions
All authors contributed to the study conception and design. Material preparation, data collection and analysis were performed by Ramadian Bachtiar. The first draft of the manuscript was written by Ramadian Bachtiar and all authors commented on previous versions of the manuscript. All authors read and approved the final manuscript, except for Hawis H. Madduppa who passed away in early May 2022.
Financial support
This work was funded by the Indonesia Endowment Fund for Education (LPDP), The Ministry of Finance of Republic of Indonesia, awarded to Ramadian Bachtiar (grant number 201710223011515).
Conflict of interest
The authors declare that they have no conflict of interest.
Ethical standards
Not applicable.