Introduction
The order Isoptera arose around 150 Myr ago in the late Jurassic/Early Cretaceous period (Engel et al., Reference Engel, Grimaldi and Krishna2009). At present, seven families are recognized; they comprise around 280 genera for a total of over 2600 diplo-diploid species (Engel & Krishna, Reference Engel and Krishna2004). Isopterans are particularly interesting for their behavior, reproductive biology and ecological roles (Inward et al., Reference Inward, Vogler and Eggleton2007). The typical population structure of these insects consists of colonies, each composed of various castes. Colony foundation is often linked to a single pair of reproducing individuals. Over time, secondary males and females may be produced within the colony, increasing the reproductive output, but this closed system clearly lacks panmixia. Colony defense is performed by soldiers, while foraging and nursing are carried out by workers. In basal termite species (the so-called ‘lower termites’, as for example Kalotermitidae), workers are actually nymphs (named ‘pseudoergates’) and are characterized by the ability to differentiate either into soldiers or reproductives (Korb, Reference Korb2007, Reference Korb2008).
From an ecological point of view, termites represent one of the most important degraders in tropical and temperate forest ecosystems, their diet being principally soil and wood based. Termites digest plant material (cellulose) with the help of symbiotic bacteria and protozoans in their guts.
Two genera are native in Europe: Reticulitermes and Kalotermes. They show differences in ecology, habitat preference and colony dynamics; while Reticulitermes species are subterranean and build colonies of thousands of individuals with different reproductive centers in the soil, Kalotermes spp. produce smaller colonies, generally formed by few hundred individuals that do not have a strictly subterranean reproduction (Prota, Reference Prota1962). The two genera also belong to different lifetypes. Kalotermes species (and more generally Kalotermitidae) are classified as ‘one-piece’ nesters; individuals nest and feed in the same substrate, i.e. dry wood. A different lifetype is proposed for Reticulitermes species, in which the nesting and the feeding areas are separated, forcing the individuals to forage away from the nest (Eggleton & Tayasu, Reference Eggleton and Tayasu2001).
Hitherto, biodiversity and evolutionary researches have mainly focused on the Reticulitermes genus, which, according to recent data, consists of eight taxa of species level in Europe (Clément et al., Reference Clément, Bagnères, Uva, Wilfert, Quintana, Reinhard and Dronnet2001; Austin et al., Reference Austin, Szalanski, Uva, Bagnères and Kence2002; Marini & Mantovani, Reference Marini and Mantovani2002; Luchetti et al., Reference Luchetti, Bergamaschi, Marini and Mantovani2004a,b, 2007; Uva et al., Reference Uva, Clément, Austin, Aubert, Zaffagnini, Quintana and Bagnères2004; Velonà et al., Reference Velonà, Ghesini, Luchetti, Marini and Mantovani2010). In contrast, the genus Kalotermes has been poorly studied and is believed to comprise only one species in Europe, K. flavicollis (Fabricius, 1793) (Clément et al., Reference Clément, Bagnères, Uva, Wilfert, Quintana, Reinhard and Dronnet2001; Luchetti et al., Reference Luchetti, Bergamaschi, Marini and Mantovani2004a). Yet, physiological, morphometric and reproductive biology data suggest that there may be some degree of geographic differentiation, e.g. between French and Sardinian colonies on one side, and colonies from the Italian peninsula on the other (Luscher, Reference Luscher1956; Springhetti, Reference Springhetti1967; Rossi & Springhetti, Reference Rossi and Springhetti1983). Currently available mtDNA sequence data (910 bp fragment of COI/tRNALeu/COII) suggest that there is no genetic structuring in K. flavicollis across Italy, the Balkans and Greece (Luchetti et al., Reference Luchetti, Bergamaschi, Marini and Mantovani2004a). In contrast, within the same area, the genus Reticulitermes shows at least six lineages (Luchetti et al., Reference Luchetti, Marini and Mantovani2007; Velonà et al., Reference Velonà, Ghesini, Luchetti, Marini and Mantovani2010).
In this paper, we present a molecular analysis of K. flavicollis colonies sampled from France, Italy, the Balkans and Greece. Both mitochondrial (part of the control region and the COI/tRNALeu/COII fragment) and nuclear (microsatellites and Inter-SINE loci) markers are used. In particular, five new polymorphic microsatellite loci are here characterized for K. flavicollis and the use of Inter-SINEs fingerprinting (Shafer & Stewart, Reference Shafer and Stewart2007) is explored for the first time in Kalotermitidae.
SINEs (Short INterspersed Elements) are non-autonomous nuclear retrotransposons, usually present with more than 105 copies (Kostia et al., Reference Kostia, Ruohonen-Lehto, Väinölä and Varvio2000; Ohshima & Okada, Reference Ohshima and Okada2005). The power of SINEs in phylogenetics is that their insertion is random and unidirectional, so that the absence of a SINE is always an ancestral condition (Nishihara & Okada, Reference Nishihara, Okada and Murphy2008). In this analysis, we used a primer designed on the SINE Talua, and we amplified the region between two copies of the SINE (Luchetti, Reference Luchetti2005; Luchetti & Mantovani, Reference Luchetti and Mantovani2009) to produce a presence/absence matrix.
The aim of the present analysis is to infer genetic relationships between Mediterranean populations of K. flavicollis and to correlate these with the history of the basin. Results are also compared with those previously obtained for Reticulitermes spp. (Luchetti et al., Reference Luchetti, Marini and Mantovani2005, Reference Luchetti, Marini and Mantovani2007; Velonà et al., Reference Velonà, Ghesini, Luchetti, Marini and Mantovani2010) in order to evaluate the contribution of the historical events that have shaped the present-day biodiversity in this geographic area.
Methods
Sampling
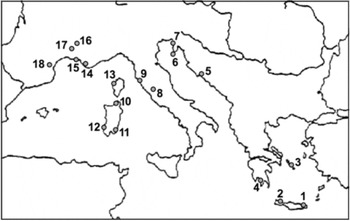
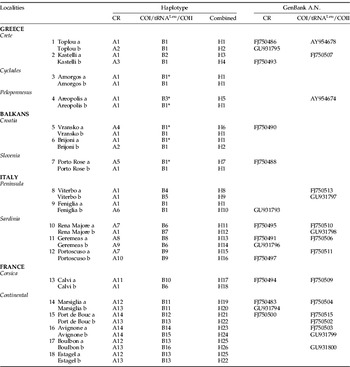
Present work was carried out on 18 colonies collected in Greece, the Balkans, Italy and France (fig. 1, table 1). Five of these samples (Amorgos, Areopolis, Vransko, Brijoni and Porto Rose) were already analyzed for the COI/tRNALeu/COII fragment in Luchetti et al. (Reference Luchetti, Bergamaschi, Marini and Mantovani2004a) (table 1).
Sampling localities of Kalotermes flavicollis populations. Numbers refer to table 1.

Sampling sites, scored haplotypes and GenBank accession numbers for each mitochondrial sequence.

Numbers before each population are the same as for fig. 1. Asterisks indicate sequences drawn from Luchetti et al. (Reference Luchetti, Bergamaschi, Marini and Mantovani2004a).
At each sampling site, two individuals were sequenced at two mitochondrial loci, and 8–10 specimens were genotyped for both microsatellites and I-SINE markers (with the exception of the Estagel population, for which only four individuals were available). Total DNA was extracted from the head of each termite using the CTAB protocol (Doyle & Doyle, Reference Doyle and Doyle1987).
Mitochondrial markers
A portion of 303 bp of the control region (CR), homologous to the region surveyed by Jenkins et al. (Reference Jenkins, Basten, Dean, Mitchell, Kresovich and Forschler1999) for Reticulitermes taxa, and a 912 bp fragment, spanning from the 3′ end of the cytochrome oxydase sub. I (COI) to the cytochrome oxydase sub. II (COII) gene, including the tRNALeu in between, were PCR amplified with the primer pairs AT-KR (5′-GTG GCT ATA CCC ACT ATA AA-3′)/TM-N-193 (5′-TGG GGT ATG AAC CAG TAG C-3′), and C1-J-2797 (5′-CCT CGA CGT TAT TCA GAT TAC C-3′)/TK-N-3785 (5′-GTT TAA GAG ACC AGT ACT TG-3′), respectively.
PCR amplifications were performed in a 50 μl reaction using Taq DNA polymerase PCR kit (Invitrogen), following the kit protocol. The amplification conditions were: 30 cycles of denaturation at 94°C for 30″, annealing at 48°C for 30″ and extension at 72°C for 30″, plus an initial denaturation at 94°C for 5′ and a final extension at 72°C for 7′. The amplified products were purified with the Wizard SV Gel and PCR Clean-up System kit (Promega, Milan, Italy) and both strands were sequenced at Macrogen Inc. (Korea). GenBank accession numbers are reported in table 1.
Microsatellites markers
A microsatellite-enriched genomic library was obtained using the F.I.A.S.CO. protocol (Zane et al., Reference Zane, Bargelloni and Patarnello2002; Velonà et al., Reference Velonà, Luchetti, Scanabissi and Mantovani2009).
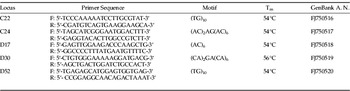
Microsatellite loci were identified using the tandem repeat finder software (Benson, Reference Benson1999). PCR primers were then designed using the primer3 online software (Rozen & Skaletsky, Reference Rozen, Skaletsky, Misener and Kravetz2000). Each primer pair was optimized for PCR amplification by testing over a range of annealing temperatures. The amplification conditions were 94°C for 5′ for the initial denaturation, 35 cycles at 94°C for 30″, annealing for 30″ (see in table 2 the temperature utilized for each locus) and 72°C for 30″, plus a final extension at 72°C for 7′.
List of primers for the five microsatellite loci here isolated.

Motifs, annealing temperatures and Genbank accession numbers of sequenced alleles are also given.
The 10 μl PCR reactions included 8 ng of genomic DNA, 10 μM of each primer, 1.5 mM MgCl2, 200 μM dNTPs, 10 mM of buffer 10× (Invitrogen kit), 1 μl BSA 0.2% and 1 U of Taq polymerase (Invitrogen). Genotyping was performed in a Beckman CEQ8000, using 5’-labelled forward primers (Sigma).
Inter-SINE markers
This method is based on the PCR amplification of sequences comprised between two copies of a SINE retrotransposon. The SINE used here was isolated in the subterranean termite species Reticulitermes lucifugus, and its presence was also confirmed within the Kalotermitidae family, in both Cryptotermes secundus and K. flavicollis (Luchetti, Reference Luchetti2005; Luchetti & Mantovani, Reference Luchetti and Mantovani2009). Two primers were tested, TaF (5′ - AGT GGC CGT GCG GTC TAA G - 3′) and TaR (5′- CGT CGC AGA GAC CTC TAC CTG - 3′). The first anneals at the 5′ end of the SINE, priming upstream, the second anneals within the SINE, priming downstream. Only the TaF primer generated a repeatable fingerprinting pattern, using the following amplification conditions: 94°C for 5′ for the initial denaturation, 35 cycles at 94°C for 30″, 42°C for 30″ and 72°C for 30″, plus a final extension at 72°C for 7’. The 10 μl PCR reactions included 8 ng of genomic DNA, 10 μM of primer, 1.5 mM MgCl2, 200 μM of dNTPs, 10 mM of buffer 10× and 1 U of Taq polymerase (Invitrogen). PCR products were resolved in 2% agarose gels in a TAE buffer 1× and bands were used to create a presence (1)/absence (0) matrix.
Statistical analyses
Sequences were aligned with clustalw algorithm implemented in mega4 (Tamura et al., Reference Tamura, Dudley, Nei and Kumar2007); this software was also used to calculate the number of variable sites.
The Shimodaira-Hasegawa test (Shimodaira & Hasegawa, Reference Shimodaira and Hasegawa1999) was performed with paup* 4.0b (Swofford, Reference Swofford2001) to determine if the two isolated mitochondrial fragments could be analyzed in a combined dataset; significance of P was computed after 1000 replicates. The test resulted significant (P<0.05), impeding the use of the combined dataset for the phylogenetic analysis. So, through the software modeltest 3.06 (Posada & Crandall, Reference Posada and Crandall1998), we determined the best substitution model for both the control region (TrN+Γ, Γ=1.6368) and the COI/tRNALeu/COII (TIM+I, I=0.7794).
The Bayesian phylogenetic analysis was carried out using mrbayes 3.01 (Huelsenbeck & Ronquist, Reference Huelsenbeck and Ronquist2001), partitioning the total dataset and setting the ML parameters (lset) as follows: for the control region nst=6, rates=gamma and for the COI/tRNALeu/COII nst=6, rates=propinv. The Markov Chain Monte Carlo process was set so that two runs of four chains ran simultaneously for 106 generations, when the two runs converged onto stationary distribution (standard deviation of split frequencies<0.01); trees were sampled every 100 generations, for a total of 10,001 trees. Burnin was set to 25% of sampled tree, so that a consensus tree was calculated on 7501 trees. A parsimony network was inferred using tcs 1.21 (Clement et al., Reference Clement, Posada and Crandall2000), with gaps considered as 5th state characters. A pairwise divergence matrix was calculated using paup* (Swofford, Reference Swofford2001).
For microsatellite markers, the presence of null alleles was tested with microchecker 2.2.1 (Van Oosterhout et al., Reference Van Oosterhout, Hutchinson, Wills and Shipley2004). The allele number, allelic richness and Weir and Cockerham F-statistics were calculated with fstat 2.9.3.2 (Goudet, Reference Goudet2002). Expected and observed heterozygosities were computed with genetix 4.05 (Belkhir et al., Reference Belkhir, Borsa, Chikki, Raufaste and Bonhomme2003). The software genepop 1.2 (Raymond & Rousset, Reference Raymond and Rousset1995) was utilized for linkage disequilibrium analysis and to calculate the probability to fit to the Hardy-Weinberg equilibrium (HWE).
For the analysis of Inter-SINE (I-SINE) markers, we calculated the Shannon Index using famd 1.108b (Schlüter & Harris, Reference Schlüter and Harris2006) and the genetic diversity using hickory 1.1 (Holsinger et al., Reference Holsinger, Lewis and Dey2002) as measures of variability within populations. hickory uses a Bayesian approach without assuming Hardy-Weinberg equilibrium. The analysis was performed first by testing all the models implemented in the software. To select the best model, we used the Deviance Information Criterion (DIC: Spiegelhalter et al., Reference Spiegelhalter, Best, Carlin and van der Linde2002), an analogue of the Akaike Information Criterion. The model with the lowest DIC value was chosen as the best one. The same analysis evaluated inbreeding (f) and differentiation (θ) coefficients.
For both microsatellite and I-SINE markers, the multivariate dataset was reduced into a two-dimensional space through a principal components analysis (PCA) performed with past 1.76 (Hammer et al., Reference Hammer, Harper and Ryan2001).
Results
Mitochondrial DNA
The CR amplified fragment showed 15 variable sites out of 303, leading to 14 haplotypes. In the COI/tRNALeu/COII fragment, 16 out of the COI 178 bp were variable (six at the first, three at the second and seven at the third codon position), while the COII sequence showed 32 variable sites out of 662 bp (six at the first, five at the second and 21 at the third codon position); the tRNALeu, 72 bp long, showed only one variable site across its length. The total number of haplotypes for the COI/tRNALeu/COII fragment is 16.
The alignment (CR+COI/tRNALeu/COII) showed 64 variable sites in 1215 bp, leading to 26 haplotypes. Only the two individuals of the Amorgos sample shared the same haplotype H1, which is also the most common combined haplotype present in six other populations, spanning from Greece to Croatia and peninsular Italy (table 1).
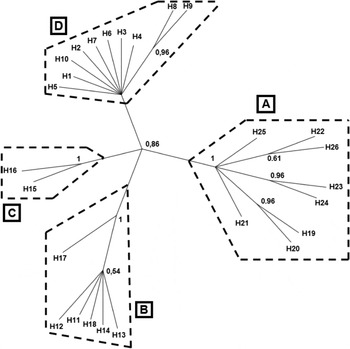
The Bayesian phylogenetic analysis (fig. 2) showed three distinct clades: the first (A) includes all the specimens from continental France, the second clade (B) embodies the specimens from Corsica and Sardinia, except Portoscuso (Sardinia), which constitutes the third clade (C). All the specimens from the area spanning from Crete to the peninsular Italy constitute an unresolved polytomic group (D).
Bayesian analysis performed on mitochondrial markers. Numbers indicate bayesian posterior probability values. Capital letters indicate the three lineages identified (A–B–C) and the unresolved polytomy (D).

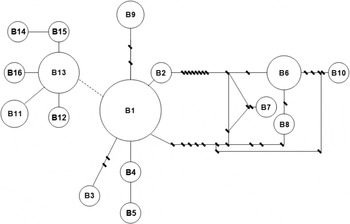
The haplotype parsimony network, built only on the more variable COI/tRNALeu/COII fragment, partially agrees with the phylogenetic inference (fig. 3). The analysis splits the haplotypes into two networks; the first includes all the continental French samples (B11–B16), and the second includes all the other colonies. The polytomy seen in the phylogenetic tree (D) is a star-like network connected, albeit with a certain number of missing haplotypes, both to the Portoscuso lineage (B9) and to the much more differentiated Corsica-Sardinian clade (B6–B8, B10).
Parsimony network built on COI/tRNALeu/COII sequences. Haplotype designation is as in table 1; the small lines across branch connections represent possible missing/ideal haplotypes. Dotted branch connection is not supported by parsimony 95% limit. Circle magnitudes are proportional to scored haplotype frequency.

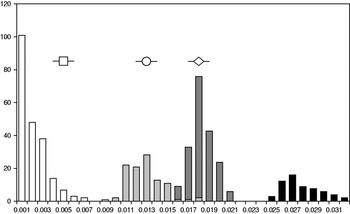
The genetic diversity within each of the four identified groups is up to 0.7% (average=0.2%) and does not overlap the range of between-group distances (fig. 4). The highest values of divergence are found in the comparison between the continental France lineage and the Corsica-Sardinia clade but Portoscuso (from 2.5% to 3.2%). Portoscuso haplotypes are less differentiated from the peninsular Italy, the Balkans and the Greece populations (0.5%; square in fig. 4) than from the Corsica/Sardinian (1.3%; circle in fig. 4) and the continental France ones (1.8%; diamond in fig. 4; see also table S1 in supplementary materials).
Histogram representing the frequency of pairwise sequences divergence among analyzed samples. Each bin represents the 0.1% of sequence divergence. Within group variability – white bars. Inter-group variability – light grey: peninsular Italy/Balkans/Greece polytomy (D) vs Corsica/Sardinia (clade B); dark grey: peninsular Italy/Balkans/Greece polytomy (D) vs Continental France (clade A); black: continental France (clade A) vs Corsica/Sardinia (clade B).

Microsatellites markers
The enriched library screening produced a total of 70 positive clones, but only nine of them allowed primer design, and five were found to be polymorphic after population PCR assay. In particular, locus C22 was polymorphic in all populations, while C24 in only half of them (table 3). The linkage-disequilibrium analysis did not show any significant association between loci (see table S2 in supplementary materials).
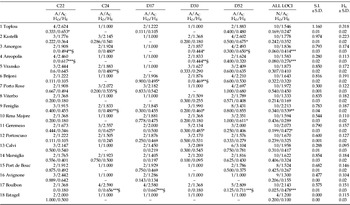
Number of alleles (A), allelic richness (AC), number of individuals (N), observed (HO)/expected (HE) heterozygosity per locus and per population over all loci are given for the five microsatellite loci.

§ possible presence of null alleles;
* P<0.05;
** P<0.01;
*** P<0.001.
Shannon Index (S.I.), genetic diversity (HS) and their standard deviations are computed on I-SINE marker.
Five populations (Feniglia, Geremeas, Portoscuso, Marsiglia and Boulbon) were polymorphic at all loci, while Estagel and Avignone samples were polymorphic only at one (C22) or two (C22, D17) loci, respectively (table 3). Allelic richness values per population ranged from 1.000 to 3.431; the range was 1.200–2.213 over all loci per population. On the whole, the number of alleles per locus ranged from eight (C24 and D17) to 13 (D52), with an average allele number per locus of 9.8 (not shown). Considering the total number of loci analyzed over all populations, 29% of the polymorphic loci (20 out of 68) showed significant deviations from Hardy-Weinberg equilibrium (HWE); null alleles may explain 55% (11 out of 20) of these deviations. Considering all loci, five populations (Amorgos, Areopolis, Feniglia, Geremeas and Boulbon) did not match the HWE (table 3).
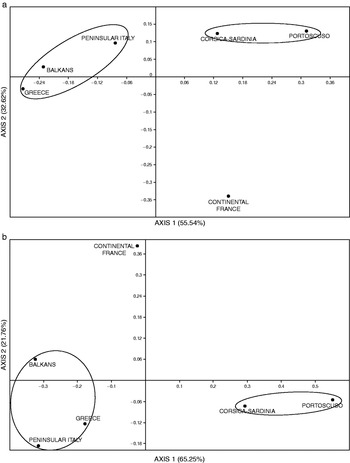
The Weir and Cockerham F-statistic showed a relatively low F IS (0.285; P<0.001; 95% confidence interval=0.123–0.536) and a high F ST (0.376; P<0.001; 95% confidence interval=0.259–0.461); this is reflected by significant F ST in the majority of pairwise population comparisons (see table S3 in supplementary materials). In the PCA analysis (axis 1+axis 2=88.16% of the total variance), colonies from peninsular Italy, the Balkans and Greece cluster together, as well as Portoscuso sample with the other colonies from Sardinia and Corsica; the continental France samples were the most differentiated (fig. 5a).
Principal component analysis (PCA) built on (a) microsatellite dataset and (b) I-SINE dataset. In parenthesis the percentage of variance for each axis is reported.

Inter-SINE markers
The 20 loci detected were polymorphic throughout the entire dataset. The model choice analysis indicated the ‘full model’ as the best one to describe our dataset (DIC=563.944).
Shannon index ranged between 0 (Estagel) and 1.160 (Toplou), while the genetic diversity range is 0.095 (Calvi)–0.318 (Toplou; table 3). The inbreeding coefficient analysis showed a low value (f=0.168; 95% confidence interval=0.006–0.541), while the inter-population divergences were higher (θ=0.418; 95% confidence interval=0.373–0.463). The PCA analysis (axis 1+axis 2=87.01% of the total variance) depicts a picture highly congruent with the one obtained from the microsatellite data. Samples from Greece, the Balkans and peninsular Italy form one group, and the samples from Portoscuso and Corsica-Sardinia form another one; the continental France colonies are the most divergent (fig. 5b).
Discussion
The very first mtDNA analysis of K. flavicollis (Luchetti et al., Reference Luchetti, Bergamaschi, Marini and Mantovani2004a) did not reveal any structuring of COI/tRNALeu/COII haplotypes over a geographic area comprising peninsular Italy, Sicily, the Balkans, the Peloponnesus and the Cyclades. The results here presented, obtained from the same mitochondrial marker with the addition of the CR fragment, are in line with this previous analysis. Yet, the wider geographic area surveyed showed a more defined structuring due to the divergent and well-defined lineages present in Corsica/Sardinia, Portoscuso and continental France.
The range of within-group variability is, in all comparisons, separated by a large gap from the between-group divergence range; this recalls a ‘barcoding’ gap (Hebert et al., Reference Hebert, Stoeckle, Zemlak and Francis2004). Even considering the limits that the evolutionary history of each taxon imposes on these threshold estimates, the mean within- vs between-group divergences here observed are well above the conventional DNA barcode gap (Hebert et al., Reference Hebert, Stoeckle, Zemlak and Francis2004). With respect to the Hebert et al. (Reference Hebert, Stoeckle, Zemlak and Francis2004) dataset, our estimates are based on fewer samples and on different mtDNA genes; nevertheless, present values suggest that the here scored mtDNA variability could not represent a mere population-level divergence. With respect to our analysis, comparable results can also be found in other insect groups, such as Hemiptera (Žurovcová et al., 2010) and Lepidoptera (Hajibabaei et al., Reference Hajibabaei, Janzen, Burns, Hallwachs and Hebert2006).
A high level of differentiation is also supported by the microsatellite and I-SINE data, which suggest a clear-cut differentiation at the regional scale, with the French continental colonies being the most divergent. The existence of different entities in France and Italy was already hypothesized on physiological grounds (Luscher, Reference Luscher1956) and present molecular data support this possibility. Still other geographic taxa were suggested based on soldier morphometry, reproductive biology, and crossing experiments (Springhetti, Reference Springhetti1967; Rossi & Springhetti, Reference Rossi and Springhetti1983); these data evidenced a significant divergence of Sardinian and Corsican colonies. Accordingly, the data presented here indicate that the Corsican and Sardinian colonies constitute a separate lineage that is differentiated from the continental France and peninsular Italy colonies. A more complex situation emerges when considering the Portoscuso sample. In our mitochondrial phylogeny, it seems to represent a separated lineage, but the level of divergence in the Portoscuso vs peninsular Italy, Balkans and Greece population comparison is low and falls in the within-species range. On the other hand, both nuclear markers define a strict relationship between Portoscuso and the Corsica-Sardinia lineage. On the whole, the data could be explained by a recent introduction of this population from peninsular Italy, followed by outbreeding events with local demes.
The Mediterranean basin's fauna shows a high level of diversity in several hotspots, as well as a number of endemic taxa, owing to various paleogeographic/paleoclimatic events. The range of sequence divergence observed among K. flavicollis clades points to roughly contemporary cladogenetic events. Quaternary climatic oscillations have been one of the major forces driving taxa evolution and distribution (Hewitt, Reference Hewitt2004; Schmitt, Reference Schmitt2007); during the glacial periods, Mediterranean peninsulas provided refugia for a number of organisms, while successive climate warming allowed northward recolonization. From present results, K. flavicollis colonies from the Balkans and peninsular Italy do not show the expected divergence, as populations lack mitochondrial lineage break across the entire area; only nuclear data suggest some degree of divergence. This agrees with the pattern observed, for example, in Maniola jurtina where the eastern European lineage spans from Italy to Balkans (Schmitt, Reference Schmitt2007). Therefore, during the last glacial phase, an extensive gene flow within the Adriatic-Pontic area is suggested to have occurred, while the most western taxa remained isolated (Schmitt et al., Reference Schmitt, Rober and Seitz2005a). Data here presented may reflect a comparable situation.
The continental French clade may represent the leading edge of a northward recolonization from a glacial refugium. Since the scored genetic divergence (average ∼1.8%) excludes a close affinity with the Italian peninsular clade, the recolonization route may have initiated from an Iberian refugium. For example, this route has been followed by another European termite species, Reticulitermes banyulensis (Kutnik et al., Reference Kutnik, Uva, Brinkworth and Bagnères2004) and by other strictly Mediterranean insects, such as the stick-insect Leptynia hispanica (Ghiselli et al., Reference Ghiselli, Milani, Scali and Passamonti2007) or the butterfly Polyommatus hispana (Schmitt et al., Reference Schmitt, Varga and Seitz2005b). However, the possibility of a refugial area in southern France, as hypothesized for other insects (Vasconcelos et al., Reference Vasconcelos, Horn, Lieutier, Branco and Kerdelhué2006; Wahlberg & Saccheri, Reference Wahlberg and Saccheri2007), cannot be ruled out. Further sampling in north-western Italy and, especially, in the Iberian peninsula will obviously highlight this point.
As for the origin of the Corsica-Sardinian colonies, except Portoscuso, the genetic divergence observed between this clade and the other eastern populations (∼1.3%) well correlates with the Pliocene-Quaternary transgression, which, as argued for Solatopupa spp. (Ketmaier et al., Reference Ketmaier, Giusti and Caccone2006), may have caused the speciation by vicariance.
As proposed by Arbogast & Kenagy (Reference Arbogast and Kenagy2001), the comparative phylogeography approach is a good tool in detecting historical biogeography. The comparison of present results with those from the sympatric Reticulitermes spp. termites is of interest since, despite their largely overlapped distribution, these two groups show differences in present-day biodiversity. Taking into account the area considered in this paper, Reticulitermes spp. comprises eight species (Clément et al., Reference Clément, Bagnères, Uva, Wilfert, Quintana, Reinhard and Dronnet2001; Luchetti et al., Reference Luchetti, Trenta, Mantovani and Marini2004b, Reference Luchetti, Marini and Mantovani2007; Uva et al., Reference Uva, Clément, Austin, Aubert, Zaffagnini, Quintana and Bagnères2004; Velonà et al., Reference Velonà, Ghesini, Luchetti, Marini and Mantovani2010), while K. flavicollis shows only a half of lineages.
In the western part of the examined area, the biodiversity level of the two termite genera is similar. This does not necessarily mean that they share the same biogeographic history, but geological and paleoclimatic events might have similarly affected their diversity. K. flavicollis populations from Sardinia and Corsica are differentiated from the peninsular Italy ones, but with a level of divergence that could be associated with a relatively recent event. Differently, a speciation event may have originated in the same area, in a vicariance context, Reticulitermes lucifugus corsicus from R. lucifugus lucifugus around 9 million years ago (Velonà et al., Reference Velonà, Ghesini, Luchetti, Marini and Mantovani2010).
On the other hand, east of Italy, K. flavicollis is genetically more homogeneous than Reticulitermes. The Aegean area is known as a hotspot of high biodiversity (Sfenthourakis & Legakis, Reference Sfenthourakis and Legakis2001), mainly because of a complex paleogeographic history (Perissoratis & Conispoliatis, Reference Perissoratis and Conispoliatis2003); this also has been demonstrated in a number of animal systems (see for example Parmakelis et al., Reference Parmakelis, Stathi, Chatzaki, Simaiakis, Spanos, Louis and Mylonas2006 and references therein). Accordingly, Reticulitermes spp. show a consistent degree of diversification; in particular, known diversity hotspots, such as Peloponnesus, Cyclades Islands and Crete (Sfenthourakis & Legakis, Reference Sfenthourakis and Legakis2001), show their own subterranean termite lineages (Luchetti et al., Reference Luchetti, Marini and Mantovani2007; Velonà et al., Reference Velonà, Ghesini, Luchetti, Marini and Mantovani2010). At the same localities, K. flavicollis diversity is limited to a population level of differentiation. Therefore, in the eastern Mediterranean range, the two termite taxa do not share the same taxon radiation. The explanation is probably linked with the different colonization histories. In fact, K. flavicollis species could have colonized this area later with respect to Reticulitermes spp.; in this way, it was not processed by the geological/paleoclimatic events shaping eastern biodiversity (see Velonà et al., Reference Velonà, Ghesini, Luchetti, Marini and Mantovani2010 and references therein).
Considering our results and those obtained in a previous paper (Velonà et al., Reference Velonà, Ghesini, Luchetti, Marini and Mantovani2010), it is possible to hypothesize that K. flavicollis species colonized recently the European area, and this event was followed by a diversification in at least three lineages.
Acknowledgements
We wish to thank Anne-Geneviève Bagnères and Simon Dupont for kindly providing samples from southern France, Megan Maurano for the linguistic revision and Federico Plazzi for statistical support. This work has been funded by Canziani donation and RFO (University of Bologna) to B.M.
Supplementary Material
The online tables can be viewed at http://journals.cambridge.org/ber