INTRODUCTION
Worldwide, various protein evaluation systems for ruminants based on digestible crude protein (DCP) as a measure of amino acids (AA) available to the animal have been replaced by systems that estimate the supply and requirements of AA available for absorption from the small intestine. These latter systems consider the supply of rumen-undegraded feed protein and of microbial protein synthesized in the rumen separately. In the Netherlands, the current protein evaluation system (the DVE/OEB1991 system) was introduced in 1991 and fully described by Tamminga et al. (Reference Tamminga, van Straalen, Subnel, Meijer, Steg, Wever and Blok1994). Because the DVE/OEB1991 system describes nitrogen (N) digestion and N metabolism, and also quantifies N losses in various parts of the gastro-intestinal tract, this system has been implemented by dairy farmers, feed advisers and feed manufacturers. A number of other protein evaluation systems have been published that are conceptually similar to each other but differ in actual calculation procedures and parameter values (e.g. Madsen et al. Reference Madsen, Hvelplund, Weisbjerg, Bertilsson, Olsson, Spörndly, Harstad, Volden, Tuori, Varvikko, Huhtanen and Olafsson1995; NRC 2001).
Critical aspects of various ruminant protein evaluation systems have been reviewed in the light of new research knowledge and developments (Huhtanen Reference Huhtanen2005). Further improvement of the DVE/OEB1991 system was also inspired by more recent international advances in feed evaluation including the Cornell Net Carbohydrate and Protein System (CNCPS) in the USA (Fox et al. Reference Fox, Tedechi, Tylutki, Russell, Van Amburgh, Chase, Pell and Overton2004) and the Feed into Milk (FiM) system in the UK (Offer et al. Reference Offer, Agnew, Cottrill, Givens, Keady, Mayne, Rymer, Yan, France, Beever, Thomas, Garnsworthy and Wiseman2002; Thomas Reference Thomas2004). Major elements for improvement of the DVE/OEB1991 system and similar protein evaluation systems include the representation of chemical components in feed, the rumen degradation characteristics of these components, the efficiency of microbial protein synthesis (MPS) and the fractional passage rates of various components (reviewed by Dijkstra et al. Reference Dijkstra, France and Davies1998a).
The aim of this paper is to describe the updated protein evaluation system, hereafter referred to as the DVE/OEB2010 system, and to discuss relevant differences from other extant protein evaluation systems for dairy cows. Detailed aspects of the development of the DVE/OEB2010 system have been described by Tamminga et al. (Reference Tamminga, Brandsma, Dijkstra, Van Duinkerken, Van Vuuren and Blok2007).
OUTLINE OF THE DVE/OEB2010 SYSTEM
DVE components
As with the DVE/OEB1991 system, the DVE/OEB2010 system calculates two characteristics for each feed: true protein digested in the small intestine (DVE) and degradable protein balance in the rumen (OEB). Of these, DVE represents the amount of true protein from various sources digested in the small intestine, and requirements of dairy cows are also expressed in units of DVE, whereas OEB represents the difference in MPS potentially possible from available rumen degradable crude protein (RDP) and that potentially possible from energy extracted from rumen fermented organic matter (FOM). The DVE is separated into three components: (i) feed crude protein not degraded in the rumen but digested in the small intestine (DVBE), (ii) microbial true protein synthesized in the rumen and digested in the small intestine (DVME) and (iii) net endogenous crude protein lost in the digestive processes (DVMFE).
Endogenous protein losses mainly comprise digestive enzymes, desquamated epithelial cells and mucus. Although endogenous protein originates from the animal itself, it causes a loss assumed to be related to the flow of undigested dry matter (UDM) through the gastro-intestinal tract. Hence, the DVE value of a feed can be represented as

Each of these DVE components will be described in more detail in the following paragraphs in combination with an outline of the chemical components distinguished and their degradation and digestion characteristics.
Chemical components in feedstuffs
In feedstuffs for ruminants, organic matter (OM) contains the chemical components crude protein (CP), starch, sugars, glucose-oligosaccharides (GOS), crude fat (CFAT), neutral detergent fibre (NDF), fermentation products (FP) and a residual fraction (RNSP).
The main contributors to FP in (fermented) feeds are lactic acid (LA) and volatile fatty acids (VFA), the sum of acetic acid, propionic acid and butyric acid.
RNSP can be calculated as (all fractions in g/kg DM):
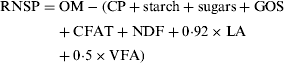
In Eqn (2), CP does not include ammonia (NH3) and GOS are fragments (soluble in 0·4 m ethanol) of incomplete starch degradation, present in some high-moisture by-products (CVB 2007).
Depending on drying conditions, the proportion of FP that is lost in the drying process varies per component of FP. In a study by Porter & Murray (Reference Porter and Murray2001), alcohols (ALC) and NH3 were evaporated almost completely, whereas only 0·55–0·90 VFA and 0·10–0·40 LA were evaporated. In the DVE/OEB2010 system, it is assumed that 0·08 of LA, 0·50 of VFA and 1·00 of ALC and NH3 evaporate during the drying process (CVB 1991). If information on individual FP is lacking, an estimate of total FP may be obtained from standard table values (e.g. CVB 2007) and for silages, the equations of CVB (1991) can be used. In such situations, the term ‘0·92×LA+0·5×VFA’ in Eqn (2) can be replaced by these tabulated or calculated FP. When no information on the level of FP is available, it is assumed that the feed does not contain FP.
The nature of the fraction RNSP is not well defined, but is assumed to contain mainly non-starch polysaccharides (NSP) such as pectins, arabans, xylans and beta-glucans. In some feedstuffs, organic acids (e.g. oxalic acid in sugar beets) may also contribute to RNSP.
Microbial protein digestible in the small intestine
Introduction
In the DVE/OEB1991 system (Tamminga et al. Reference Tamminga, van Straalen, Subnel, Meijer, Steg, Wever and Blok1994), it was assumed that a fixed amount of 150 g of microbial crude protein (MCP)/kg of FOM in feed is produced. However, the amount of microbial biomass produced may differ between bacterial strains and between different growing conditions in the rumen (Russell & Strobel Reference Russell, Strobel, Dijkstra, Forbes and France2005). Moreover, the adenosine tri-phosphate (ATP) generated from fermented feed differs between various feed components.
For the development of the DVE/OEB2010 system and in order to calculate the amount of microbial protein digestible in the small intestine several aspects of the DVE/OEB1991 system were re-evaluated: (i) the degradation of feed components in the rumen, (ii) the fractional degradation rates of the non-washout potentially degradable fraction (D), the water soluble fraction after filtration or centrifugation (S) and the insoluble washout fraction (W−S), respectively, (iii) the efficiency of MPS, (iv) the fractional passage rates of various components, (iv) the proportion of AA in microbial CP and (vi) the behaviour of fats and long-chain fatty acids (FA) in nylon bag incubations. Each of these aspects is described separately below.
Degradation of feed components in the rumen
It is assumed that the proportions of the various chemical feed components that are degraded in the rumen result from the combination of fractional degradation and passage rates per fraction within the component as outlined in Eqn (3):
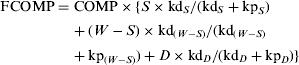
where FCOMP is a component fermented in the rumen (g/g DM), COMP is content of the relevant component (g/g DM), S is the water soluble fraction after filtration or centrifugation (g/g), kdS is the fractional rate of degradation of fraction S (/h), kpS is the fractional rate of passage out of the rumen of fraction S (/h), W is the fraction washed out of nylon bags (g/g), (W−S) is the insoluble washout fraction (g/g), kd(W−S) is the fractional rate of degradation of fraction (W−S) (/h), kp(W−S) is the fractional rate of passage out of the rumen of fraction (W−S) (/h), D is the non-washout potentially degradable fraction (g/g), kdD is the fractional rate of degradation of fraction D (/h) and kpD is the fractional rate of passage out of the rumen of fraction D (/h).
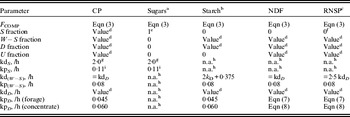
Parameter values for different feed components concerning the estimations for parameters in Eqn (3) are presented in Table 1. This approach differs from the DVE/OEB1991 system, in which only W, D and a non-washout and non-degradable fraction (U) were distinguished and a kp of the D-fraction of 0·045 and 0·060/h for roughage and concentrates, respectively. In general, the degradation characteristics of feed components in the rumen are estimated with the in situ technique (Ørskov & McDonald Reference Ørskov and McDonald1979). This approach assumes that each feed component can be separated into four fractions: S, W, D and U, all expressed as g/g. The size of U is determined as the residue remaining in nylon bags after prolonged rumen incubation (336 h). The size of W is determined as the fraction that is washed out of a nylon bag with a pore size of 35–45 μm in a washing machine. The S fraction is considered to be part of the W fraction, but is determined separately through filtration or centrifugation. The (W−S) fraction is the washout fraction minus the soluble fraction and consists of particles smaller than the pore size of the nylon bag and susceptible to fluid instead of particle outflow. The size of D is calculated as 1−W−U. Degradation of D, (W−S) and S, respectively, as well as passage behaviour of each fraction is assumed to follow first-order kinetics described by the equation:

where R t is the residue of the feed component at time t (g/g), R 0 is the residue of the feed component at time 0 (g/g), k is fractional rate of degradation (kd) or passage (kp) (/h) and t is time (h).
Overview of parameter values for different feed components fermented in the rumen (F COMP)

a Sugars (according to Luff Schoorl (PDV 2006))+glucose oligosaccharides (GOS) soluble in 0·40 m ethanol.
b To account for the effect of pelleting, effective degradation of starch in concentrates is increased by reducing the size of D with a fraction of 0·25, with a concomitant increase of fraction W.
c For RNSP the size of W, U and D is calculated as OM − (CP+CFAT+sugars+GOS+starch+NDF+FP) for each incubation time by using Eqn (3). For time points other than t=0 h for sugars, GOS and FP the value is 0. Of the CFAT fraction in the feed, 0·35 is washed out, and so the fat-free D fraction of NSP can be calculated by subtracting a 0·65 fraction of the initial CFAT content. Similarly, the fat-free D fractions of NSP at 3, 6 and 12 h are reduced by a fraction of 0·40, 0·17 and 0·03 of the initial CFAT content.
d ‘Value’ means analysed or derived from feed tables. When S>W, then W=S.
e All sugars are assumed to be in the S fraction.
f Part of the W fraction may be soluble, but this cannot be measured because of ‘contamination’ with soluble ash.
g For products of which the S fraction contains AA (in protein, peptides or free) or soluble sugars, a fractional degradation rate of 2·0/h is used according to Volden et al. (Reference Volden, Mydland and Olaisen2002) for protein and Van Straalen (Reference Van Straalen1995) based on Sniffen et al. (Reference Sniffen, O'Connor, Van Soest, Fox and Russell1992) for sugars.
h n.a.=not applicable.
i Assumptions based on data of Van Vuuren (Reference Van Vuuren1993), Van Straalen (Reference Van Straalen1995), Van Der Honing et al. (Reference Van Der Honing, Gerlofsma and Van Vuuren2004), Pellikaan (Reference Pellikaan2004) and Dijkstra et al. (Reference Dijkstra, Pellikaan and Tamminga2005).
Fractional degradation rates
Fractional degradation rates are applicable to the fractions D (kdD), S (kdS) and W−S (kd(W−S)), respectively. For D, the fractional degradation rates of the different feed components are determined by nylon bag incubations in the rumen, following the procedure of Ørskov & McDonald (Reference Ørskov and McDonald1979) as adapted by CVB (2003b). It is assumed that S is degraded at a fixed fractional rate (kdS) of 2·0/h. This is based on the assumption that a proportion of 0·05 of the fraction S of protein and carbohydrates escapes degradation in the rumen (Van Straalen Reference Van Straalen1995; Volden et al. Reference Volden, Mydland and Olaisen2002), dictating a kpS/(kpS+kdS) ratio of 0·05. In the CNCPS (Fox et al. Reference Fox, Tedechi, Tylutki, Russell, Van Amburgh, Chase, Pell and Overton2004), fractional degradation rates for soluble true protein and soluble carbohydrates in concentrate ingredients were assumed to vary between 1·0 and 4·0/h (Sniffen et al. Reference Sniffen, O'Connor, Van Soest, Fox and Russell1992).
The fractional degradation rate of (W−S) is assumed to be equal to that of D (kd(W−S)=kdD) for all feed components, except for starch. For starch it is assumed that W−S equals W, that the kdW is considerably higher than the kdD and that kdW and kdD are correlated. Based on the results of a variety of regression calculations, the results of which were evaluated with data of in vivo starch degradation collected by Offner & Sauvant (Reference Offner and Sauvant2004), in the DVE/OEB2010 system for starch the kdW is calculated as 2×kdD+0·375. In feeds where starch is analytically determined at <50 g/kg DM, in the DVE/OEB2010 system it is assumed that it is degraded rapidly at a rate of 0·75/h.
In the DVE/OEB2010 system, the effect of processing on the rumen degradation of starch is also taken into account. A widely used processing method for dairy concentrates is pelleting. The size of D with pelleting is 0·84 of the size of D with non-pelleting. Furthermore, the kdD with pelleting is 1·09 of the size of the kdD with non-pelleting (Tamminga et al. Reference Tamminga, Brandsma, Dijkstra, Van Duinkerken, Van Vuuren and Blok2007). To cover both effects of pelleting, the size of the D fraction in pelleted feeds in the DVE/OEB2010 system is 0·75 of the size of the D fraction in non-pelleted feeds, with a concomitant increase of the size of the W fraction compared to feed not pelleted.
Degradation of residual non-starch polysaccharides
To calculate the degradation of the RNSP fraction, the calculations described in the previous section need to be performed for the original feed material as well as its components. However, two aspects need to be taken into account: (i) a correction for CFAT as will be explained in more detail in the paragraph below: The behaviour of fats and long-chain FA in nylon bag incubations, (ii) the fraction RNSP is not analytically determined but calculated (Eqn (2)). This implies that all possible errors of the analytical procedures of all other feed fractions influence the calculated RNSP.
The degradation characteristics of RNSP were calculated for a selected number of 21 feed ingredients with an NDF content of more than 100 g/kg DM and an RNSP/NDF ratio higher than 0·5, and for which in situ degradation characteristics were available (Tamminga et al. Reference Tamminga, Brandsma, Dijkstra, Van Duinkerken, Van Vuuren and Blok2007). Comparing the NDF and RNSP in these ingredients showed that the size of the W fraction of RNSP always exceeded the size of W in NDF (on average 0·165 v. 0·070 g/g, respectively), the size of the U fraction in NDF always exceeded the size of U in RNSP (on average 0·110 v. 0·017 g/g, respectively) and the kdD of RNSP always exceeded the kdD of NDF (on average 0·095 v. 0·051/h, respectively). In a number of feed ingredients the size of W of RNSP was negative, as the total mass balance has to add up to 1·00. Because components in the W fraction of RNSP are most likely (soluble) pectins and oligosaccharides, a negative value of W is set at zero and mass balance is maintained by an equal reduction of the size of the fraction of soluble sugars. If the size of a negative W exceeds that of sugars, maintaining mass balance is achieved by reducing the size of D of RNSP. For kdD of RNSP the values calculated from the Ørskov & McDonald (Reference Ørskov and McDonald1979) model are used. Similar to the assumptions made for starch, a dependency is expected between kdW and kdD. Therefore, in the DVE/OEB2010 system we assume that, for RNSP, kdW is 2·5×kdD.
The Dutch protocol for in situ incubations in the rumen (CVB 2003b) states that NDF has to be determined for feed ingredients with a ratio RNSP/NDF higher than 0·5 and NDF exceeding 100 g/kg. Furthermore, in this protocol it is arbitrarily assumed that in all other cases NDF can be calculated as NDF=OM−CP−starch. It is further assumed that: (i) W of NDF=0, (ii) W of RNSP=W of NSP, (iii) D of NDF=NDF/NSP×D of NSP, (iv) D of RNSP=RNSP/NSP×D of NSP, (v) U of NDF=NDF/NSP×U of NSP, (vi) U of RNSP=RNSP/NSP×U of NSP and (vii) kdD of D of NDF=kdD of D of RNSP=kdD of D of NSP.
Efficiency of MPS
Although the terminology and details differ between protein evaluation systems, they are conceptually similar in their aim to predict the amount of feed and microbial AA N that is available for the host animal metabolism (Dijkstra et al. Reference Dijkstra, France and Davies1998a). The MPS is calculated from the amount of energy generated from FOM, applying either a constant or a variable yield of microbial protein formed per unit energy or OM fermented. Subsequently, the calculated MPS is corrected for a possible shortage of N (Dijkstra et al. Reference Dijkstra, France and Davies1998a). With the DVE/OEB1991 system (Tamminga et al. Reference Tamminga, van Straalen, Subnel, Meijer, Steg, Wever and Blok1994) it was assumed that a fixed amount of 150 g of MCP/kg FOM was produced. However, from a review study of Dijkstra et al. (Reference Dijkstra, France and Davies1998a) it appeared that the efficiency of microbial growth and protein synthesis in the rumen is mainly affected by (i) the type of substrate and its fractional passage rate and (ii) the type of microbes present in the rumen. Both aspects have been reconsidered in the DVE/OEB2010 system.
Type of substrate
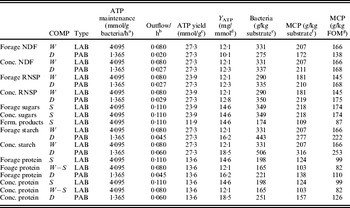
Rumen micro-organisms require ATP for maintenance and biosynthesis of microbial matter and precursors for this biosynthesis. Both precursors and ATP are derived from the utilization of feed substrates in the rumen. The yield of ATP from fermented feed substrates varies between 1·5 and 4·4 mmol ATP per mmol substrate fermented into VFA (Russell & Strobel Reference Russell, Strobel, Dijkstra, Forbes and France2005). The highest yields are derived from fermentation of polysaccharides, containing 6·2 mmol of hexose equivalents and yielding 27·3 mmol ATP/g fermented polysaccharide. In the DVE/OEB2010 system ATP yield is differentiated among different types of fermented substrate, distinguished between (i) structural polysaccharides (NSP), (ii) starch, (iii) mono-, di- and oligosaccharides and (iv) CP, with assumed ATP yields of 27·3, 27·3, 23·9 and 13·7 mmol of ATP/g of substrate fermented into VFA, respectively. The maximum value of 27·3 is applied in the FiM system (Thomas Reference Thomas2004), regardless of the type of carbohydrate fermented. The fermentation of protein yields considerably less ATP/g substrate than that of carbohydrates (Russell & Strobel Reference Russell, Strobel, Dijkstra, Forbes and France2005) and, in the DVE/OEB2010 system, it was set at half the value attributed to polysaccharides. Mono- and disaccharides (sugars) and oligosaccharides (in the W-fraction of RNSP) are degraded rapidly. Owing to their fast rate of degradation, their fermentative metabolic pathways probably also yield less ATP than the maximum value adopted for polysaccharides. This hypothesis is supported by a study of Hall & Herejk (Reference Hall and Herejk2001), in which it was stated that sucrose provides less carbon than an equivalent weight of starch because the hydrolysis of the carbohydrates gives a monomer yield 0·05 higher for sucrose and 0·11 higher for starch. Furthermore, a faster rate of degradation tends towards the formation of products such as ethanol and lactic acid with a lower ATP yield (Russell & Strobel Reference Russell, Strobel, Dijkstra, Forbes and France2005). In the DVE/OEB2010 system, the ATP yield for mono-, di- and oligosaccharides was set arbitrarily at 0·875 of the level for polysaccharides. The approach in the DVE/OEB2010 system to estimate ATP yield from fermented feed substrates resembles that in the FiM system (Thomas Reference Thomas2004), where ATP yield (in mol per kg of DM degraded) is calculated as 27·34−0·0248×CP where CP is the crude protein content of the feed in g/kg DM.
Type of rumen microbes
The rumen microbial population comprises three rather distinct sub-populations: cellulolytic bacteria, amylolytic bacteria and protozoa (Bach et al. Reference Bach, Calsamiglia and Stern2005). Protozoa are assumed to be selectively retained in the rumen. Shabi et al. (Reference Shabi, Tagari, Murphy, Bruckental, Mabjeesh, Zamwel, Celik and Arieli2000) stated that protozoa contribute with a fraction of 0·11 to the flow of CP to the abomasum.
Microbial growth yield is usually expressed as Y ATP or g microbial cells/mol ATP and its maximum is assumed to be 32 g microbial DM/mol ATP generated from substrate fermented into VFA (Russell & Strobel Reference Russell, Strobel, Dijkstra, Forbes and France2005). Because of the energy requirement for maintenance, this maximum is not reached. Actual growth yield can be described with the equation of Pirt (Reference Pirt1965):

where Y is yield of microbial DM (g microbial DM/mmol ATP), M is maintenance requirement of micro-organisms (mmol ATP/h/g microbial DM), kgM is fractional microbial growth rate/h and Y max is theoretical maximum yield of microbial DM without losses in maintenance (g microbial DM/mmol ATP).
In the DVE/OEB2010 system, for reasons of simplicity, it is assumed that the D fraction is fermented by particle-associated bacteria (PAB) and that the S and W fractions are degraded by liquid-associated bacteria (LAB). The PAB and LAB are assumed to have maintenance requirements of 0·05 and 0·15 g carbohydrates/g bacteria/h (Russell et al. Reference Russell, O'Connor, Fox, Van Soest and Sniffen1992; Fox et al. Reference Fox, Tedechi, Tylutki, Russell, Van Amburgh, Chase, Pell and Overton2004), which is equivalent to 1·365 and 4·095 mmol ATP/g bacteria/h, respectively. It should be noted that these values were derived from data of only five bacterial species, each related to substrate preference rather than being free or attached (Russell & Baldwin Reference Russell and Baldwin1979).
The fractional rumen outflow rate is the major determinant of fractional rumen growth rate of micro-organisms (Dijkstra et al. Reference Dijkstra, Kebreab, Mills, Pellikaan, López, Bannink and France2007). This implies that the fractional rumen outflow rate determines the proportion of available ATP used for maintenance. In the DVE/OEB2010 system, precursors for the synthesis of microbial mass are assumed to be always sufficiently available from the intermediates of feed degradation. Hence, variation in MPS is predominantly determined by variation in the amount and type of substrate fermented into VFA (ATP yield) and variation in fractional outflow rate (distinction between PAB and LAB, and ATP required for maintenance of the microbial population present in the rumen). A different approach was used in the CNCPS by assuming that the fractional rate of substrate degradation in the rumen also determines the ratio of energy use for maintenance and for microbial biosynthesis (Russell et al. Reference Russell, O'Connor, Fox, Van Soest and Sniffen1992).
Table 2 presents ruminal degradation characteristics and outflow rates of feed components and allocation of each fraction to LAB or PAB. Actual Y ATP is calculated by taking into account the ATP yield of each feed component and the fractional passage rate, assuming a theoretical maximum yield (Y max) of 0·032 g bacterial DM/mmol ATP (Russell & Strobel Reference Russell, Strobel, Dijkstra, Forbes and France2005). From this, the actual yield of microbial biomass per feed component, and for LAB and PAB, were calculated. According to Clark et al. (Reference Clark, Klusmeyer and Cameron1992), bacterial biomass contains between 0·30 and 0·66 MCP, but similar to the FiM system (Thomas Reference Thomas2004), this fraction was set at 0·625 in the DVE/OEB2010 system. The net production of bacteria is reduced because of extensive predation by protozoa. The CNCPS therefore reduces the theoretical maximum growth yield by a 0·20 fraction for all dietary situations (Russell et al. Reference Russell, O'Connor, Fox, Van Soest and Sniffen1992). For simplicity, this correction factor of 0·20 is also applied in the DVE/OEB2010 system, although it is recognized that the amount of bacterial matter recycled through protozoal predation shows large variation between diets (Dijkstra et al. Reference Dijkstra, France and Tamminga1998b).
Distribution of feed components (COMP) in fermentable organic matter (FOM) over soluble (S), washable (W) and non-washable (D) fractions and between PAB and LAB and ATP yield, and MCP yield

Explanation per column:
a See text.
b See Table 1.
c See text.
d Calculated with the formula of Pirt (Reference Pirt1965) with Y max=0·032 g/mmol ATP.
e ATP yield×Y ATP.
f 0·625×(g bacteria/kg substrate).
g MCP×0·8 (with 0·8=correction for predation).
Fractional passage rates
Fractional passage rates (kpX) of feed particles are important determinants of the availability and utilization of feed substrates by micro-organisms (Russell et al. Reference Russell, O'Connor, Fox, Van Soest and Sniffen1992; Pellikaan Reference Pellikaan2004) and of the efficiency of microbial growth (Dijkstra et al. Reference Dijkstra, Mills and France2002). Fractional passage rates are usually estimated with markers for the liquid and the particulate fraction of rumen contents. Seo et al. (Reference Seo, Tedeschi, Lanzas, Schwab and Fox2006) stated that attempts to predict the passage rate of liquid have not been very successful and that empirical equations failed to explain >0·30 of the variation in experimental observations. Kennedy (Reference Kennedy, Dijkstra, Forbes and France2005) reviewed particle dynamics in ruminants and suggested that the solid particle pool could be classified in large, medium and small particles. Furthermore, Kennedy (Reference Kennedy, Dijkstra, Forbes and France2005) indicated that in most studies, rumen particles are distinguished into large and small particles, based on their rate of clearance from the reticulo-rumen with low and moderate to high probability, respectively.
Several studies (Van Straalen Reference Van Straalen1995; Pellikaan Reference Pellikaan2004; Van Der Honing et al. Reference Van Der Honing, Gerlofsma and Van Vuuren2004; Dijkstra et al. Reference Dijkstra, Pellikaan and Tamminga2005) have shown that not only forages and concentrates differ in their fractional passage rate, but that the contributing components (protein, starch, cell walls) also have different fractional passage rates. Therefore, in the DVE/OEB2010 system, separate fractional passage rates are used for CP and starch, for NDF and for RNSP, in addition to the distinction between liquids, concentrate particles and forage particles.
Fractional passage rates of CP and starch
In the DVE/OEB1991 system, fractional passage rates of CP and starch of 0·045 and 0·060/h were assumed for forages and concentrates, respectively. These values are also adopted for the D-fraction of CP and starch in forages and concentrates, respectively, in the DVE/OEB2010 system. Furthermore, the fractional passage rate of the S-fraction is set at 0·11/h, equal to that of the liquid phase. This value is based on Van Der Honing et al. (Reference Van Der Honing, Gerlofsma and Van Vuuren2004), who estimated in their review that the rate of passage of liquid is 2·5 times higher than the passage rate of forage particles and 1·8 times higher than that of concentrate particles. For the fraction (W−S) the fractional passage rate was set at 0·08/h, an arbitrarily chosen value in between the fractional passage rate of liquid and that of particles of the D fraction of concentrates. The component CP contains a non-degradable (U) fraction, which is only subject to passage.
Fractional passage of NDF
In the DVE/OEB2010 system, several assumptions were made to set the fractional passage rates for NDF. It was hypothesized that NDF comprises a fraction that is available for degradation (DNDF) in the rumen and a fraction that is not available (UNDF). As it is assumed that UNDF is also indigestible in the hindgut, this fraction is only subject to passage and the ingested amount will be quantitatively excreted in the faeces. Of the DNDF, the main part is fermented in the rumen, a much smaller proportion is digested in the hindgut and also a certain proportion will be excreted in the faeces.
The passage behaviour of NDF was extensively discussed and documented by Tamminga et al. (Reference Tamminga, Brandsma, Dijkstra, Van Duinkerken, Van Vuuren and Blok2007). The results of eight studies with dairy cows with a dry matter intake (DMI) of 17·8 (s.d.=3·64) kg/d, in which passage behaviour was measured based on internal markers (lignin or indigestible ADF), showed that the average kp of NDF in forages fed to dairy cows was 0·0278 (s.d.=0·0088)/h. If, as in the DVE/OEB1991 system, a ratio of 0·75 is maintained between the kp of forage and concentrate particles, a fractional passage rate of 0·0371/h for concentrates applies. Tamminga et al. (Reference Tamminga, Brandsma, Dijkstra, Van Duinkerken, Van Vuuren and Blok2007) also argued the presence of a dependency between the kp and kd of DNDF. From the results of two large studies in dairy cows fed high-quality diets (Bosch et al. Reference Bosch, Tamminga, Post, Leffering and Muylaert1992; Valk Reference Valk2002), it was concluded that 0·82 of the DNDF ingested is digested. With respect to the contribution of the hindgut to total tract digestion of NDF, Ulyatt et al. (Reference Ulyatt, Dellow, Reid, Bauchop, McDonald and Warner1975) reported a range of 0·00–0·30 for sheep, while Tamminga (Reference Tamminga, Jung, Buxton, Hatfield and Ralph1993) reported a range of 0·00–0·20 for dairy cows fed diets consisting of long forage and pelleted concentrates. In both sheep and cattle, the importance of hindgut fermentation increases with a decreasing total tract digestibility. As an average value for dairy cows fed good-quality diets, a fraction of 0·10 was adopted in the DVE/OEB2010 system. Consequently, the fraction of DNDF degraded in the rumen is 0·738 [(1·00–0·10)×0·82]. As the degraded fraction is calculated from kd/(kd+kp), the kp:kd ratio is 0·355 [(1–0·738)/0·738]. Both approaches were combined in equations describing the fractional passage rate (kp;/h) out of the rumen for NDF in forages (kpf;/h) and concentrates (kpc;/h) as follows:

in which 0·0139 is half the value of 0·0278, the kp of NDF estimated using internal markers, and 0·1775 is half the value of 0·355, the ratio required between kd and kp.

in which 0·01855 is half the value of 0·0371, the estimated kp of concentrates using internal markers, and 0·1775 is again half the value of 0·355.
In an extensive study, Pellikaan (Reference Pellikaan2004) studied passage behaviour of grass and grass silage particles using stable isotopes. These roughages were labelled with 13C as an internal marker and passage behaviour data of DM, NDF and the non-cell wall fraction were evaluated and compared with behaviour data based on external markers Cr-NDF and Co-EDTA. In all cases, 13C gave slower ruminal passage compared to the external markers, and with respect to the labelled fractions, the 13C-labelled NDF fraction gave the lowest fractional passage rate. The results showed that the fractional passage rate of NDF in forage was, on average, 40% lower than that of non-cell wall components. Furthermore, Pellikaan (Reference Pellikaan2004) showed that reduction of DMI gave slower fractional passage, especially for NDF. Based on the use of 13C as an internal marker, Dijkstra et al. (Reference Dijkstra, Pellikaan and Tamminga2005) recommended fractional passage rates of 0·025 and 0·020/h for NDF in grass silage and maize silage, respectively. However, DMI levels in the experiments reported by Pellikaan (Reference Pellikaan2004) and Dijkstra et al. (Reference Dijkstra, Pellikaan and Tamminga2005) were lower (on average 15·7 kg DM/d) than what is considered common practice in dairy farming in the Netherlands. This would allow somewhat higher fractional passage rates, close to the figures chosen as appropriate in the DVE/OEB2010 system.
AA in rumen microbial protein
In the DVE/OEB1991 system (Tamminga et al. Reference Tamminga, van Straalen, Subnel, Meijer, Steg, Wever and Blok1994), it is assumed that a fraction of 0·75 of the MCP is composed of AA, which is assumed to be absorbed from the intestine with an efficiency of 0·85. These figures are equal to the ones used in the FiM system (Thomas Reference Thomas2004), but slightly deviate from those in the Protéines Digestibles dans l'Intestin grêle (PDI) system that uses 0·80 both for AA content in MCP and for intestinal digestibility of AA in MCP (Vérité & Peyraud Reference Vérité, Peyraud and Jarrige1989).
The behaviour of fats and long-chain FA in nylon bag incubations
FA in the feed are not oxidized by rumen microbes and do not contribute to the energy supply for rumen micro-organisms (Dijkstra et al. Reference Dijkstra, France and Davies1998a). Fat is assumed to be non-degradable in the rumen and to be washed out rapidly and completely from the nylon bags during in situ incubation (Tamminga et al. Reference Tamminga, van Straalen, Subnel, Meijer, Steg, Wever and Blok1994). However, fat-rich products like oilseeds are expected to block the pores of nylon bags and may impair the degradation of the other fractions and give unrealistic results. To prevent such blocking, the Dutch protocol for in situ incubations in the rumen (CVB 2003b) recommends that ingredients with CFAT exceeding 100 g/kg DM should be extracted gently prior to rumen incubations.
Chouinard et al. (Reference Chouinard, Levesque, Girard and Brisson1997) and Enjalbert et al. (Reference Enjalbert, Eynard, Nicot, Troegeler-Meynadier, Bayourthe and Moncoulon2003) studied the fate of fats and FA in the rumen during nylon bag incubations of raw and treated full fat oilseeds such as soybeans (Chouinard et al. Reference Chouinard, Levesque, Girard and Brisson1997) and canola seed (Enjalbert et al. Reference Enjalbert, Eynard, Nicot, Troegeler-Meynadier, Bayourthe and Moncoulon2003). The results of the above studies showed that, on average, 0·27–0·46 of the FA are immediately washed out. The remaining FA disappeared from nylon bags 2–4 times faster than DM. Apparent disappearance of polyunsaturated FA (PUFA) was faster than that of saturated FA, not only because PUFA leave the bags with feed particles, but also because they are bio-hydrogenated into more saturated FA. Fractional rates of the disappearance of FA varied between 0·10 and 0·25/h and processing (extrusion, roasting and moist heat treatment) decreased the fractional disappearance rate.
The behaviour of CFAT in the rumen affects the calculated rumen degradability of NSP. Assuming the W and D fractions for CFAT to be 0·35 and 0·00, respectively, and the average fractional disappearance rate for the U fraction of CFAT to be 0·15/h, enables a correction of the W and D fractions of NSP in the DVE/OEB2010 system. Assuming a disappearance rate of 0·15/h and a W fraction of 0·35, CFAT remaining at 3, 6 and 12 h is 0·41 (=0·65×e−3×0·15), 0·26 (=0·65×e−6×0·15) and 0·11 (=0·65×e−12×0·15) of its original value. Thus, the D fraction of NSP is being calculated assuming these fractions of fat to have disappeared.
Intestinal digestible rumen-undegraded feed protein
The amount of DVBE is estimated from the amount of feed protein that escapes degradation in the rumen (BRE) and the intestinal digestibility of this rumen-undegraded feed protein. Hence, DVBE is calculated from the CP content of a feed, multiplied by the fraction escaping degradation (%BRE), the fraction of AA in BRE and the true absorption coefficient of AA from the intestine. The %BRE is based on the results of nylon bag incubations in the rumen using Eqn (3) and applying assumptions on fractions, fractional degradation and fractional passage rates of those fractions of protein as described previously.
Intestinal digestion of BRE is derived from the results of the mobile nylon bag technique as described by Van Straalen (Reference Van Straalen1995). If no such results are available, intestinal digestion of BRE is calculated as (BRE−U)/BRE. As in the DVE/OEB1991 system, it is assumed that BRE consists totally of AA. Hence, the amount of DVBE equals the amount of intestinal digested feed AA. The relative amount of DVBE (%DVBE) is the official feed characteristic (national standard) in the Dutch protein evaluation system and listed in the national feed tables of CVB. Values can be obtained from these CVB feeding tables for forages (CVB 2003a), for raw materials and by-products (CVB 2005) or in the integrated feeding tables for ruminants (CVB 2007). DVBE is calculated as

In the DVE/OEB1991 system (Tamminga et al. Reference Tamminga, van Straalen, Subnel, Meijer, Steg, Wever and Blok1994), BRE was corrected with a factor 1·11, derived from the French PDI system for protein evaluation (Vérité et al. Reference Vérité, Michalet-Doreau, Chapoutot, Peyraud and Poncet1987). In the DVE/OEB1991 system, the W-fraction of protein was assumed to be completely degraded in the rumen. In the DVE/OEB2010 system, the fraction W is separated in the fractions S and (W−S). Of the S fraction, a proportion of 0·05 is assumed to escape degradation in the rumen. Similarly, a significant but variable proportion of the W−S fraction will escape. These two fractions hence add to the calculated BRE and roughly match the upward correction of BRE by the factor 1·11. For this reason, the latter factor was abandoned in the DVE/OEB2010 system.
Endogenous losses in digestion
The digestive process is associated with endogenous CP losses. These losses include digestive enzymes, desquamated epithelial cells, bile and mucus. Although the losses originate from the animal, they are thought to be caused more by the characteristics of the feed than of the animal (Tamminga et al. Reference Tamminga, van Straalen, Subnel, Meijer, Steg, Wever and Blok1994). In the DVE/OEB1991 system, it was assumed that each kg of DM excreted in the faeces caused a (crude) protein loss of 50 g. It is further assumed that the re-synthesis of endogenously excreted protein occurs with an efficiency of 0·67. Hence, the replacement of endogenous protein excreted in the faeces is similar to the approach used in the DVE/OEB1991 system (Tamminga et al. Reference Tamminga, van Straalen, Subnel, Meijer, Steg, Wever and Blok1994) and requires 75 g of DVE/kg of UDM:

Rumen degradable protein balance
The OEB is defined as the difference in MPS potentially possible from available RDP and that potentially possible from energy extracted from FOM. Van Vuuren & Tamminga (Reference Van Vuuren and Tamminga2001) indicated that farmers should in practice try avoiding a negative OEB at any time to prevent a decrease in MPS and a subsequent decrease in milk protein yield. This recommendation is maintained in the DVE/OEB2010 system.
AA composition of DVE
The AA composition of DVE is determined by the AA pattern of the underlying DVE components: DVBE, DVME and DVMFE. A crucial question is whether the degradative behaviour in the rumen of the total AA or individual AA differs from that of protein in the rumen. This question was addressed by Van Duinkerken & Blok (Reference Van Duinkerken and Blok1998) and restricted to lysine (LYS) and methionine (MET). Their conclusion was that total AA, LYS and MET in concentrate ingredients follow the same pattern of degradation as protein. For forages, they concluded that the rumen degradation of individual AA may significantly deviate from that of protein, but that the database that led to this conclusion was too small and inadequate to derive reliable correction equations to estimate rumen degradation for individual AA in forages. Subsequently, it was also assumed that AA in forages have the same degradation pattern as protein. Van Duinkerken & Blok (Reference Van Duinkerken and Blok1998) also addressed possible differences in the digestive behaviour in the intestine between individual AA and AA in protein. On the basis of regression analysis, they concluded that the intestinal digestion of LYS was equal to that of protein, but that the digestion of MET was underestimated by a fraction of 0·04. In the FiM system (Thomas Reference Thomas2004), LYS and MET have the same intestinal absorption coefficients as total BRE.
In the DVE/OEB2010 system, the equations of Van Duinkerken & Blok (Reference Van Duinkerken and Blok1998) are adopted for rumen-undegraded feed methionine (DVBMET) and rumen-undegraded feed lysine (DVBLYS):


with MET and LYS in g/100 g CP.
For DVME, an average AA pattern was calculated by Van Duinkerken & Blok (Reference Van Duinkerken and Blok1998); LYS and MET were 77 and 25 g/kg total microbial AA, respectively, which is virtually identical to that in the FiM system (Thomas Reference Thomas2004). The values reported by Van Duinkerken & Blok (Reference Van Duinkerken and Blok1998) are adopted in the DVE/OEB2010 system for microbial MET and LYS digestible in the intestine:


Van Duinkerken & Blok (Reference Van Duinkerken and Blok1998) estimated the contribution of LYS and MET to DVMFE from the endogenous excretion found in sheep by Van Bruchem et al. (Reference Van Bruchem, Bongers, Van Walsem, Onck and Van Adrichem1985). These values were also adopted in the DVE/OEB2010 system:


The combination of Eqns (10), (12) and (14) results in the equation for total ileal digestible MET:

Combination of Eqns (11), (13) and (15) results in the equation for total ileal digestible LYS:

Protein requirements
As in the DVE/OEB1991 system, the DVE/OEB2010 system distinguishes protein requirements for maintenance, milk protein production, changes in body protein balance and foetal growth. Each of these four components is clarified in a separate section.
Maintenance
A significant proportion of inevitable protein losses in faeces are not used for maintaining the organs and tissues, but result from endogenous losses which are more related to the undigested feed residues than to the metabolism in organs and tissues other than the gastro intestinal tract. As discussed earlier, endogenous losses were assumed not to be a part of maintenance requirements, but directly subtracted from the gross supply of DVE. The requirements for maintenance were restricted to those necessary to compensate for losses in urine and in hair and skin. Both are related to the body weight (BW; kg) and can be calculated from the equation that was already utilized in the DVE/OEB1991 system:

Milk yield
The protein requirement for milk yield in general can be calculated from the milk protein yield and the efficiency in which absorbed AA are used for milk protein production. Initially, the DVE/OEB1991 system (CVB 1991) assumed a constant efficiency of 0·64. Later research (Hof et al. Reference Hof, Tamminga and Lenaers1994; Subnel et al. Reference Subnel, Meijer, Van Straalen and Tamminga1994) showed that this efficiency is variable and influenced by the ratio between DVE and net energy for lactation (NEL; MJ) as well as by the fat- and protein-corrected milk (FPCM) production level. According to Subnel et al. (Reference Subnel, Meijer, Van Straalen and Tamminga1994), this efficiency could adequately be described by the equation:

where DVE/NEL=ratio between DVE and net energy (g/MJ), and FPCM=fat- and protein-corrected milk (kg/d).
The inclusion of milk production in Eqn (19) is at least partly the result of the way the NEL system (VEM system) is used for formulating energy requirements (Van Es Reference Van Es1978). This system also gives a decreasing efficiency of energy utilization with increasing milk production. This decrease is primarily thought to be the result of a reduced digestion. In Eqn (20), the protein requirements for milk protein production, based on Subnel et al. (Reference Subnel, Meijer, Van Straalen and Tamminga1994), are described and this equation was also adopted in the DVE/OEB2010 system:

where MiP=milk protein (MiP) in g/d.
Body protein mobilization and deposition
In the DVE/OEB1991 system (Tamminga et al. Reference Tamminga, van Straalen, Subnel, Meijer, Steg, Wever and Blok1994), it was assumed that energy mobilized from the body yields 45 g of DVE/1000 VEM (127 g DVE/kg BW loss) and that the re-deposition of energy in the body requires 57 g DVE/1000 VEM (200 g DVE/kg BW gain). However, later research (Gibb et al. Reference Gibb, Ivings, Dhanoa and Sutton1992; Tamminga et al. Reference Tamminga, Luteijn and Meijer1997; Van Knegsel et al. Reference Van Knegsel, Van Den Brand, Dijkstra, Van Straalen, Heetkamp, Tamminga and Kemp2007) indicated that protein balance and energy balance do not follow the same pattern. Protein balance remains negative for only to 2–3 weeks after calving, whereas the energy balance remains negative up to 8–12 weeks after calving. The re-deposition of protein in 75 kg body weight gain would require 15 kg DVE. At the same time, the production of protein in 8000 kg of milk with 34 g protein/kg milk requires a minimum of 425 kg of DVE. The requirement for re-deposition is less than 0·035 of the requirement for milk protein production, the majority of which is deposited during the second half of the lactation period; no extra requirement is allocated for this. Therefore, in the DVE/OEB2010 system no corrections were made for available DVE due to body protein mobilization and deposition.
Pregnancy
The DVE/OEB1991 system recommends an extra DVE allowance during the last 4 months of pregnancy. These requirements were updated by Van Den Top et al. (Reference Van Den Top, Schonewille and Beynen2000) for a cow of 650 kg and a calf birth weight of 44 kg. These DVE allowances for pregnancy are adopted by the DVE/OEB2010 system and measure 62, 107, 177 and 278 g/day, for 6, 7, 8 and 9 months of pregnancy, respectively. For cows pregnant with twins, the allowances are multiplied by a factor of 1·8.
DISCUSSION
Other current protein evaluation systems
Nutritional models can serve as a farm management tool by predicting animal requirements for a certain production or by predicting nutrient excretion. Furthermore, such models enable the assessment of diet adequacy under a range of management and feeding situations (Fox et al. Reference Fox, Tedechi, Tylutki, Russell, Van Amburgh, Chase, Pell and Overton2004). Some other, older, studies (Van Straalen et al. Reference Van Straalen, Salaun, Veen, Rijpkema, Hof and Boxem1994; Tuori et al. Reference Tuori, Kaustell and Huhtanen1998) have reviewed and/or compared different protein evaluation systems. Therefore, in this section, model comparisons have been limited to two other recently published protein evaluation systems, the CNCPS in the USA (Fox et al. Reference Fox, Tedechi, Tylutki, Russell, Van Amburgh, Chase, Pell and Overton2004) and the FiM system in the UK (Offer et al. Reference Offer, Agnew, Cottrill, Givens, Keady, Mayne, Rymer, Yan, France, Beever, Thomas, Garnsworthy and Wiseman2002; Thomas Reference Thomas2004). These two systems are summarized and some conceptual differences with the DVE/OEB2010 system are highlighted. Some former protein evaluation systems that are being utilized in common dairy farming practice, i.e. the Nordic AAT/PBV protein evaluation system (Madsen et al. Reference Madsen, Hvelplund, Weisbjerg, Bertilsson, Olsson, Spörndly, Harstad, Volden, Tuori, Varvikko, Huhtanen and Olafsson1995) and the French PDI system (Vérité et al. Reference Vérité, Michalet-Doreau, Chapoutot, Peyraud and Poncet1987; Vérité & Peyraud Reference Vérité, Peyraud and Jarrige1989), are not discussed.
FiM system
The FiM system (Thomas Reference Thomas2004) comprises a complete set of mathematical equations to apply as a nutrition model for the estimation of voluntary feed intake, energy requirement and supply and protein requirement and supply. Some main characteristics of the system are: (i) a variable estimate of the amount of metabolic energy that microbes derive from degradation of feeds, (ii) quantification of the energy supply to microbes in terms of ATP, (iii) partitioning of feed dry matter in three pools depending on particle size, (iv) diet-dependent estimates of ATP yield per unit degraded DM, (v) variable estimates of microbial efficiency and predictions of microbial growth efficiency derived from in vivo observations and (vi) a factorial approach to distinguish protein requirements for maintenance and endogenous losses, milk production, pregnancy and body weight change.
CNCPS
The CNCPS (Fox et al. Reference Fox, Tedechi, Tylutki, Russell, Van Amburgh, Chase, Pell and Overton2004) predicts nutrient supply, nutrient requirements, feed utilization and nutrient excretion in a variety of production settings. The CNCPS uses fractional degradation and passage rates for feed carbohydrate and protein for predicting ruminal fermentation, MPS, post-ruminal absorption, and total supply of metabolizable energy and protein to the animal. Energy and protein requirements are predicted by taking into account lactation performance, pregnancy, growth, body reserves and environmental factors.
The CNCPS (Fox et al. Reference Fox, Tedechi, Tylutki, Russell, Van Amburgh, Chase, Pell and Overton2004) fractionates CP into five fractions based on solubility in protein precipitant agents, buffers and detergent solutions. The system accounts for the effects of variation in feed protein fractions in predicting metabolizable protein supply, rumen N balance and AA balances. Lanzas et al. (Reference Lanzas, Broderick and Fox2008) evaluated the original CNCPS protein fractionation concept, reviewed several studies that reported limitations of this concept and developed and evaluated two alternatives to improve its ability to accurately predict RDP and rumen-undegraded feed protein. They concluded that these alternatives would improve this accuracy.
Microbial efficiency
The CNCPS (Fox et al. Reference Fox, Tedechi, Tylutki, Russell, Van Amburgh, Chase, Pell and Overton2004) assumes that microbial efficiency is related to the fractional degradation rate (kd) of the diet. However, Dijkstra et al. (Reference Dijkstra, Mills and France2002) demonstrated that by using this approach, kd values at the extreme upper and lower end of the biological range would lead to biologically impossible results. Nevertheless, the rationale behind the CNCPS approach is partly supported by Pellikaan (Reference Pellikaan2004), who assumed a positive relationship between the fractional rates of degradation and ruminal outflow because soluble substrates and denser particles have a higher probability to escape from the rumen and the density or specific weight of a particle increases more rapidly with a higher fractional degradation rate. The DVE/OEB2010 system also uses fractional rumen outflow rate as one of the parameters for the estimation of microbial efficiency. The FiM system (Thomas Reference Thomas2004) also relates microbial efficiency to fractional passage but assumes a linear relationship between these characteristics, whereas the Pirt equation (Pirt Reference Pirt1965), which is the basis for the MCP calculations in the DVE/OEB2010 system, will give curvilinear results, as described by Eqn (5).
Only limited information is available on the effect of the source of carbohydrates on the efficiency of MPS (EMPS). The CNCPS (Fox et al. Reference Fox, Tedechi, Tylutki, Russell, Van Amburgh, Chase, Pell and Overton2004) assumes EMPS to be influenced by the rate of degradation and type of carbohydrates and to vary between 170 and 230 g MP/kg FOM. According to a review by Archimède et al. (Reference Archimède, Sauvant and Schmidely1997), EMPS varies in mixed diets between less than 90 and more than 200 g MP/kg of FOM. The nature of the carbohydrates in the diet had a substantial effect on this figure with highest values for starch-rich diets. The ATP yield differs between carbohydrates and is also influenced by the fractional rate of degradation, which explains some of the variation in EMPS. For instance, when starch is degraded rapidly it will be degraded via the acrylate pathway, with a lower ATP yield than via the succinate pathway. In an in vivo experiment, Oba & Allen (Reference Oba and Allen2003) compared the effect of starch varying in rumen fermentability and rate of fermentation. The efficiency decreased significantly with an increasing fractional rate of starch degradation and increased significantly with an increased rate of starch passage, contrasting the assumptions on efficiency in the CNCPS. In the DVE/OEB2010 system, the variation in outflow rate is assumed to depend more on the physical characteristics of the substrate fractions (S, W−S and D with fractional outflow rates of 0·11/h for S, 0·08/h for W−S and, depending on the component, varying between 0·02 and 0·06/h for D) than on differences in DMI. Besides, if the nutrient supply interacts with the level of DMI it becomes a more complex task to create feed tables based on the principle of additivity, because in general the nutrient values in feed tables are estimated at the maintenance level. Hence, for practical reasons, such influences are incorporated in the requirements, similar to the approach in the VEM (Van Es Reference Van Es1978) and the DVE/OEB1991 system (Subnel et al. Reference Subnel, Meijer, Van Straalen and Tamminga1994). Therefore, the DVE/OEB2010 system does not discriminate between fractional rates of outflow on the basis of DMI, as in the FiM system (Thomas Reference Thomas2004), but on the basis of the type of substrate.
Fractional passage rates
Both CNCPS (Fox et al. Reference Fox, Tedechi, Tylutki, Russell, Van Amburgh, Chase, Pell and Overton2004) and the FiM system (Thomas Reference Thomas2004) distinguish fractional passages rates in those for liquid (kpl), forages (kpf) and concentrates (kpc). Furthermore, in both systems feed intake (either per kg BW or per kg BW0·75) and the fraction of forage DM in total diet DM are major determinants of fractional passage rate. High-producing dairy cows are usually fed at or close to ad libitum. In the Dutch feed intake prediction system (Zom et al. Reference Zom, Van Riel, André and Van Duinkerken2002), variation in feed intake capacity through an entire lactation period is estimated. During the course of a lactation period, the ratio between forage and concentrates predominantly follows the milk production level. Assuming a contribution of the liquid fraction of 0·20 in all diets, Y ATP (as a measure of potential MPS), as calculated in FiM, shows only small variation. Based on these results, the FiM system suggests default values of 0·078, 0·045 and 0·060/h for kpl, kpf and kpc, respectively. CNCPS would calculate values for kpl, kpf and kpc of 0·106, 0·045 and 0·061/h, respectively, for a high-producing dairy cow of 650 kg with an intake of 21 kg DM/d and a proportion of forage of 0·50. The kp values in the DVE/OEB2010 system (Table 1) closely resemble these CNCPS values and also the above-mentioned kpf and kpc value for the FiM system.
Protein requirements for maintenance
Protein requirements for maintenance (MPm) in the FiM system (Thomas Reference Thomas2004) are based on an equation derived from NRC (2001):
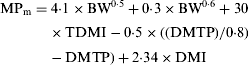
where MPm is in g/day, BW is live weight (kg), DMTP is supply of digestible microbial true protein (g/d), TDMI is calculated total DMI (Thomas Reference Thomas2004) in kg/d and DMI is DMI in kg/d).
In Eqn (21), the components related to BW are the same as in the DVE/OEB2010 system. The other components are related to DMI, as in NRC (2001), but corrected for indigestible rumen-synthesized microbial protein that is degraded and absorbed (as NH3) from the hind gut.
The CNCPS (Fox et al. Reference Fox, Tedechi, Tylutki, Russell, Van Amburgh, Chase, Pell and Overton2004) assumes that protein requirements for maintenance are the sum of scurf protein, urinary protein and metabolic faecal protein. Scurf and urinary protein are related to BW and calculated the same way as in the DVE/OEB2010 and FiM system. Metabolic faecal protein in the CNCPS is calculated as a 0·09 fraction of indigestible DM.
Protein requirements for milk protein production
The CNCPS (Fox et al. Reference Fox, Tedechi, Tylutki, Russell, Van Amburgh, Chase, Pell and Overton2004) and the FiM system (Thomas Reference Thomas2004) both apply a constant for the conversion of protein digestible in the small intestine to milk protein. The FiM system uses 0·68. The CNCPS uses 0·65, but corrects crude milk protein to true milk protein with the factor 0·93, which reduces the efficiency factor to 0·60. The DVE/OEB2010 system applies a variable efficiency factor influenced by the DVE/NEL ratio and the FPCM production level, based on Subnel et al. (Reference Subnel, Meijer, Van Straalen and Tamminga1994).
Synchronization of rumen fermentation and evaluation of the DVE/OEB2010 system
The concept of the DVE/OEB2010 system enables us to simulate and evaluate the synchronicity of energy and N availability in the rumen. Both rumen fermentation and rumen functioning can be influenced by such synchronization (Cabrita et al. Reference Cabrita, Dewhurst, Abreau and Fonseca2006). The main objectives of rumen synchronization concepts are efficient MPS, maximization of milk protein yield and reduction of the N surplus in the rumen. This will be reflected by decreasing milk urea nitrogen levels and will result in reduction of N excretion (Kebreab et al. Reference Kebreab, France, Mills, Allison and Dijkstra2002; Nousiainen et al. Reference Nousiainen, Shingfield and Huhtanen2004; Burgos et al. Reference Burgos, Fadel and DePeters2007; Broderick et al. Reference Broderick, Stevenson, Patton, Lobos and Olmos Colmenero2008) and NH3 emission (Frank & Swensson Reference Frank and Swensson2002; Van Duinkerken et al. Reference Van Duinkerken, André, Smits, Monteny and Sebek2005). Furthermore, Dijkstra et al. (Reference Dijkstra, Mills and France2002) and Russell & Strobel (Reference Russell, Strobel, Dijkstra, Forbes and France2005) suggested that an additional benefit of synchronization of rumen N and energy availability is the prevention of low rumen pH and consequential decrease of rumen microbial activity and feed intake. Synchronization of rumen N and energy availability can contribute to achieve low CP levels in dairy cow diets without loss of MPS in the rumen, which will reduce N excretion and thereby the ecological footprint of milk production. A meta-analysis by Huhtanen & Hristov (Reference Huhtanen and Hristov2009) confirmed that CP concentration is the most important dietary factor influencing efficiency of N utilization for milk protein synthesis. Bannink (Reference Bannink2007) hypothesized that a CP fraction of 0·12 of dietary DM may be possible without loss of rumen fermentation capacity. Law et al. (Reference Law, Young, Patterson, Kilpatrick, Wylie and Mayne2009) concluded that high-protein diets (CP fraction 0·173 of DM) improved feed intake and animal performance in early lactation (up to d 150). But thereafter, protein concentration can be reduced to 144 g CP/kg DM with no detrimental effects on animal performance.
Synchronicity of availability of N and energy in the rumen can be achieved either by altering the feeding pattern or frequency or by altering dietary composition, i.e. by synchronizing rumen degradation rates of proteins and carbohydrates. The DVE/OEB2010 system enables us to evaluate the extent of synchronicity of rumen N and energy availability of feedstuffs and diets. For each of the feed components in a diet, the cumulative amount FOM available in the rumen is calculated for each time point (FOMt), using Eqn (22):

A synchronization ratio can then be calculated as the ratio between RDP and rumen degradable non-protein components over a certain time span. This approach will be further clarified and evaluated in an accompanying study of Van Duinkerken (personal communication), in which two dairy cow experiments on the effects of synchronizing rumen degradation rates of proteins and carbohydrates will be reported, including an evaluation of the DVE/OEB2010 system.
Future improvements
Because of the lack of specific data, some arbitrary assumptions are incorporated into the DVE/OEB2010 system. Future availability of new data may support further development of the system, thereby improving the accuracy and utility of the model. A more accurate model can facilitate a further reduction in CP intake, resulting in a further diminution of N surpluses but without negative effects on animal performance and health. However, Rinne et al. (Reference Rinne, Nousiainen and Huhtanen2009) conducted a meta-analysis using data from dairy cow production studies to evaluate silage metabolizable protein concentrations and concluded that including new elements in protein evaluation models may not improve the precision of production response predictions unless the consequent effects on the supply of other nutrients are taken into account.
This section summarizes a number of possible future modifications that can be identified: (i) fractional degradation rate of the W−S fraction of starch, (ii) fractional degradation rates per feedstuff, (iii), fractional passage rates and (iv) AA requirements.
Fractional degradation rate of the W−S fraction of starch
In the DVE/OEB2010 system, an arbitrary assumption has been made on the fractional degradation rate of the W−S (or W) fraction of starch. In the DVE/OEB2010 system, for starch it was assumed that kdW=2×kdD+0·375. If new data on the fractional degradation of the W fraction of starch become available, the current assumption can be assessed and, if necessary, further developed.
Fractional degradation rates per feedstuff
In practice, fractional degradation rates are not available for all classes of raw materials and forages that will be used in diet composition for ruminants. As a result, tabulated values will be used; these can be constant values or calculated values if satisfactory mathematical equations are available which relate fractional degradation rates to standard laboratory analyses of these feedstuffs in practice. To develop such mathematical equations calibration data sets will have to be available based on in situ incubations according to a well-defined protocol to ensure all incubation results remain comparable. Currently, data sets are available for some feedstuffs, but additional efforts to create such data sets are necessary, in particular for forages of major importance like grass herbage, grass silage and maize silage.
Fractional passage rates
Because of a lack of in vivo data on ruminal outflow of nutrients and fractional passage rates of the various feed components, arbitrary assumptions have been made in the DVE/OEB2010 system, similar to approaches which have been adopted in other feed evaluation systems such as CNCPS (Fox et al. Reference Fox, Tedechi, Tylutki, Russell, Van Amburgh, Chase, Pell and Overton2004) and the FiM system (Thomas Reference Thomas2004). New feed passage studies will support a better understanding of the flow of nutrients through the rumen and possibly also other parts of the gastrointestinal tract and the consequential availability of nutrients to the animal.
AA requirements
In the DVE/OEB2010 system, AA requirements will be included in a later stage, based on the analysis of dose–response data and recommendations in other studies. In general, LYS and MET are considered as first limiting AA for ruminants. Based on abomasal AA infusions, Schwab et al. (Reference Schwab, Satter and Clay1976) suggested that LYS and MET were first and second limiting, or co-limiting, for the secretion of milk protein when rations consisting primarily of corn, corn silage and alfalfa-grass hay were fed. However, Broderick et al. (Reference Broderick, Satter and Harper1974) suggested that besides MET and LYS also valine (VAL) could be co-limiting for milk production. Rulquin et al. (Reference Rulquin, Vérité and Guinard-Flament2001) gave recommendations for leucine (LEU) and Huhtanen et al. (Reference Huhtanen, Vanhatalo and Varvikko2002) indicated that histidine (HIS) could also be limiting for grass silage-based diets. Clark et al. (Reference Clark, Chandler and Park1978) demonstrated that multiple AA could be limiting simultaneously. Rulquin et al. (Reference Rulquin, Pisulewski, Vérité and Guinard1993) developed dose–response relationships and observed that an optimum milk protein production was obtained when the protein digestible in the intestine contained a fraction of 0·073 of LYS and 0·025 of MET, respectively. These values are close to the NRC recommendations, which are 0·072 and 0·024 for LYS and MET, respectively (NRC 2001). In later studies, Rulquin et al. (Reference Rulquin, Guinard and Vérité1998, Reference Rulquin, Vérité and Guinard-Flament2001) suggested lower levels of 0·068 and 0·021 for LYS and MET, respectively, and these values were also adopted in the FiM system (Thomas Reference Thomas2004). For HIS and LEU, Rulquin et al. (Reference Rulquin, Vérité and Guinard-Flament2001) recommended levels between 0·025 and 0·032 for HIS and at least 0·088 for LEU, all values expressing the fraction of AA in ileal digestible protein.
This manuscript was supported by the Dutch Product Board Animal Feed, Wageningen University and Wageningen UR Livestock Research. The authors thank Gerard Brandsma, Gerrit Remmelink, Arie Klop and Ronald Zom for their input on the development and implementation of the DVE/OEB2010 system. Furthermore, we wish to thank the members of a feedback group for their technical advice.