1. Introduction
As mobile devices have evolved and become more technically sophisticated, an increasing number of users have started using them for writing emails, social media updates, tweets, forum posts, and blog posts. However, due to devices’ small form factor, text entry is currently not as efficient as it should be. As a consequence, researchers have long investigated new text entry methods and ways to improve existing methods.
A text entry method, as any other user interface technology, is designed and evaluated under certain assumptions. For example, text entry methods are typically compared in lab studies in which participants copy memorable phrases that only contain the letters A–Z plus space and limited punctuation (Wobbrock Reference Wobbrock, MacKenzie and Tanaka-Ishii2007; Paek and Hsu Reference Paek and Hsu2011; Vertanen and Kristensson Reference Vertanen and Kristensson2011b; Kristensson and Vertanen Reference Kristensson and Vertanen2012). While such studies are helpful for comparing text entry methods in controlled settings, they tell us little about the massive amounts of text users generate on their own mobile devices as part of their everyday lives.
In this paper, we describe a web mining approach for collecting mobile text. This provides a window into the real-world text entry behaviors of mobile users. We report statistics about our unique dataset such as average sentence length, use of different types of punctuation, and the prevalence of different typing errors. Our data provides insight, grounded in substantial real-world data, about user problems and possible design opportunities in mobile text entry.
We use our dataset to undertake a systematic investigation into the important role well-matched training data plays in optimizing language models for mobile text entry. We show language models trained on our data outperform models trained on most other text sources. Importantly, we show these improvements translate into actual accuracy gains for a state-of-the-art touchscreen keyboard. To assist other researchers, we have shared our mined data and trained language models Footnote 1 .
1.1 Related work
A variety of past work has explored how to collect mobile text entry data. Kamvar and Baluja (Reference Kamvar and Baluja2007) analyzed logs of mobile web searches typed on users’ own mobile devices. The data was obtained from the search company Google’s own internal logs. Grinter and Eldridge (Reference Grinter and Eldridge2003) investigated 10 British teenagers’ use of SMS by having participants complete a paper log describing their texting activities. The NUS SMS corpus (Chen and Kan Reference Chen and Kan2013) was created by asking users to donate short messages written on their mobile phones. Baldwin and Chai (Reference Baldwin and Chai2012) transcribed screenshots users had uploaded depicting spectacular autocorrection failures.
In previous work (Vertanen and Kristensson Reference Vertanen and Kristensson2011b), we mined messages from the Enron corpus (Klimt and Yang Reference Klimt and Yang2004) that were written on Blackberry mobile devices. This was possible by identifying messages with the default signature added by the Blackberry device. Short messages have also been collected targeting specific events or organizations, for example, emergency SMS messages sent during the earthquake in Haiti (Munro and Manning Reference Munro and Manning2010), the floods in Pakistan (Munro Reference Munro2011), and communications between healthcare workers in Malawi (Munro and Manning Reference Munro and Manning2010).
Another possible source of text written on a mobile device are the reviews made in mobile app stores. Other researchers have used app store reviews for various purposes, for example, explaining negative ratings (Fu et al. Reference Fu, Lin, Li, Faloutsos, Hong and Sadeh2013), mining bug reports and feature requests (Maalej and Nabil Reference Maalej and Nabil2015), and analyzing text characteristics such as length (Vasa et al. Reference Vasa, Hoon, Mouzakis and Noguchi2012) and word usage (Vasa et al. Reference Vasa, Hoon, Mouzakis and Noguchi2012). Past work has also explored mining general web text for training language models to improve the speech recognition of conversations (Bulyko et al. Reference Bulyko, Ostendorf, Siu, Ng, Stolcke and Çetin2007), meetings (Renals Reference Renals2010), and SMS messages (Creutz, Virpioja, and Kovaleva Reference Creutz, Virpioja and Kovaleva2009).
In this paper, we describe our methodology that enables the collection of mobile text data via web mining. To our knowledge, we are the first to mine web data with the goal of improving mobile text entry. Further, no work has compared the impact of different training sources on recognition accuracy when used in a recognition-based mobile text input method such as a touchscreen keyboard. Compared to previous approaches, our approach allows collection of substantial amounts of data from many users spanning a diverse set of topics. Our approach does not require access to private data logs or labor-intensive transcription. It also will allow us to investigate for the first time whether the type of mobile device impacts the text that is written. We will do this by leveraging the name of the mobile device that is often included in a signature line added to posts by purpose-built forum apps (e.g. “Sent from my iPhone using Tapatalk”).
Numerous work has analyzed text written using short messaging platforms such as SMS and Twitter. The use of abbreviations and shortening of words has commonly been observed (Grinter and Eldridge Reference Grinter and Eldridge2003; Ling Reference Ling, Ling and Pedersen2005; Tagg Reference Tagg2009). This could be in response to length limitations of the platform, or it could reflect norms of the communication medium. Exchanges via short messages might be used in place of traditional face-to-face or voice communication. Without visual or verbal cues, people communicating via text have found other ways to convey emotion. For example, a person may repeat letters in a word to emphasize it, for example, “reallllly”. Brody and Diakopoulos (Reference Brody and Diakopoulos2011) found that one in six tweets had a word that was artificially lengthened. Emoticons constructed with symbols have also long been used in computer-mediated communication (Walther and D’Addario Reference Walther and D’Addario2001).
In this paper, we present an algorithm for detecting common types of typing errors. There is a long history of work in automatically correcting text (Kukich Reference Kukich1992). Correction might be required in order to fix a user’s typing mistakes, or might be needed to post-process the output of an optical character recognition system (Tong and Evans Reference Tong and Evans1996). Our focus here is on precisely detecting different classes of errors that may commonly occur during mobile text entry.
Many modern mobile text input methods rely on recognition from noisy user input (e.g. tapping on an on-screen keyboard or speaking to a speech recognizer). These input methods require a language model to help determine a user’s intended text. There is a long history of work exploring using language models to aid both desktop and mobile text input, for example, Darragh, Witten, and James (Reference Darragh, Witten and James1990) and Goodman et al. (Reference Goodman, Venolia, Steury and Parker2002). Training the language models used in these input methods requires a corpus of text. Common choices include text from news and Wikipedia articles. However, a mismatch between the training and test text domains can negatively impact a system’s performance. Even seemingly related text domains such as SMS and Twitter have been shown to differ significantly. Munroe and Manning (Reference Munro and Manning2012) found classification performance on SMS messages was much lower using a model trained on Twitter messages compared to SMS messages and vice versa. As we will show, sources such as news and Wikipedia articles are substantially different to the style of text written on mobile devices. Compared to using a diverse mixture of text sources, we will show using only news articles results in 75% more recognition errors on touchscreen typing data.
Filtering the text in a training set is one way to deal with the domain mismatch problem. Common approaches use a small corpus of in-domain text to filter training data based on perplexity (Gao et al. Reference Gao, Goodman, Li and Lee2002) or cross-entropy difference (Moore and Lewis Reference Moore and Lewis2010). Such approaches have been applied to various problems including machine translation (Chen et al. Reference Chen, Kuhn, Foster, Cherry and Huang2016), language modeling for augmentative and alternative communication (Vertanen and Kristensson Reference Vertanen and Kristensson2011a), and transcribing lectures (Bell et al. Reference Bell, Yamamoto, Swietojanski, Wu, McInnes, Hori and Renals2013).
Adapting a language model to a user’s previously written text is another possible way to deal with the domain mismatch problem. Fowler et al. (Reference Fowler, Partridge, Chelba, Bi, Ouyang and Zhai2015) found that language model adaptation reduced errors by about 20% relative in simulated touchscreen text entry. Another example is the Dasher text input method that adapts on the fly to a user’s writing (Ward, Blackwell, and MacKay Reference Ward, Blackwell and MacKay2000). Despite Dasher being initially trained on only 300 K characters, after writing 1000 sentences, Dasher’s model performed similar to one trained on 3.1 B characters (Rough, Vertanen, and Kristensson Reference Rough, Vertanen and Kristensson2014). While we believe adaptation is an important and oft-ignored topic, it is complementary to initially training on well-matched data. It is how to obtain, and the advantage of having, well-matched training data that we investigate here.
1.2 Contributions
We make six interlinked contributions to the text entry field:
1. Method for harvesting genuine mobile text. We describe a web mining method to collect text that can be identified as having been written on a specific mobile device.
2. Improved understanding of mobile text entry. We show our text collection enables a richer understanding of how users actually type “in the wild” on their mobile devices.
3. Analysis of mobile spelling and typing errors. Using an error correction algorithm, we analyze eight classes of spelling and typing errors. Our analysis highlights the common mistakes made when entering text on a mobile device.
4. Investigating the impact of training source on modeling mobile text. We compare different large-scale sources of training text. We show how to train high-performance long-span statistical language models that are well-matched to mobile text.
5. Touchscreen keyboard evaluation. We show the perplexity improvements of our language models on mobile test sets translate into tangible recognition accuracy improvements for a state-of-the-art touchscreen keyboard decoder. This includes investigating how different models impact a keyboard that makes word predictions.
6. Resources for mobile text entry research. We release our mined public web forum data classified by mobile device type. Recognizing how difficult it is to collect appropriate data and then to build high-performing language models, we also share our trained language models.
The remainder of this paper is structured in two parts. The first part (Sections 2 and 3) focuses on the collection of our data and the analysis of mobile text entry “in the wild.” The second part (Sections 4 and 5) investigates how to best train language models for mobile text entry and validates our language models on large amounts of touchscreen typing data.
2. Data collection
The main idea of our approach is to find text on the web clearly marked as having been written on a mobile device. This approach was made possible by the signature often added by default to forum posts made via various forum apps, for example, “Sent from my iPhone using Tapatalk.” Forum apps are purpose-built phone applications that make forum interactions easier than using a general-purpose web browser.
To bootstrap our web mining of mobile data, we conducted a wildcard web search using Google of the form “sent from my * using.” We collected common device names by parsing the search results between “my” and “using.” We also searched for the pattern “sent from my * using tapatalk.” Tapatalk is one of the most popular mobile forum apps. To increase coverage, we searched for this pattern restricting to different time periods (e.g. the last 24 hours) and in combination with all the numbers from 00 to 59.
In total, we found 1342 unique device strings. We reviewed a frequency sorted list and identified the top 300 devices that were clearly a mobile phone or tablet. For each of these devices, we found the device’s form factor (phone or tablet) and input mechanism (touchscreen or physical keyboard).
Next, we performed a large series of searches using the Bing web search API for pages containing “sent from my.” Optionally, we also included the search terms “using” or “using tapatalk.” Since Bing only returned the top 1000 results for a query, we added a variety of other terms to increase the unique pages found. These searches were designed to target strings that frequently occur on web forum pages, such as “sent from my device” where device was one of the 300 previously identified mobile devices and time strings from “00:00” to “23:59.”
Our queries resulted in URLs from 46 K unique hosts. To find additional pages, we conducted a site-specific search for each host name. In total, we conducted approximately 1 M web search queries resulting in 1.5 M unique page URLs. We were able to successfully download pages from 1.496 M of the 1.517 M unique URLs.
2.1 Parsing text and host filtering
Our goal was to parse out only text that was likely to be a forum post, blog entry, or blog comment. We only attempted to parse text from pages generated from the most popular forum or blog software platforms that we observed in our data. For forum platforms, we targeted vBulletin, phpBB, IP.Board, Simple Machines, XenForo, and UBB.threads. For blogs, we targeted WordPress, Blogger, and TypePad. Our parser first identified if the HTML page was generated by one of our nine supported packages. We did this by looking for a set of unique signature string, for example, “Powered by vBulletin.” We dropped pages from other platforms (11% of pages).
For each of the nine supported platforms, we created rules to parse out posts. These rules used features in the HTML parse tree including an element’s tag, class, and ID as well as those of its parents. We only attempted to parse text from HTML <div>, <blockquote>, and <p> tags. We needed a variety of rules for each platform since page structure often depended on the platform version or site configuration.
From our initial set of 46 K unique hosts, we first eliminated hosts where none of the pages were of a known platform type. This left us with 29 K unique hosts. We eliminated hosts where no posts were successfully parsed, reducing the number of hosts to 23 K. Since our web searches did not specify a target language, some of our hosts were not in English. We used a language identification package on all text parsed from a host (Lui and Baldwin Reference Lui and Baldwin2012). We required all text from a host be identified as English with a confidence of 0.95. After removing non-English hosts, we had 17 K hosts.
We identified mobile posts by looking for “sent from my” followed by 40 or fewer characters. We required that this pattern occurs at the end of a post. Since we were primarily interested in mobile text, we eliminated hosts where no post contained this pattern. This left us with 10 K unique hosts.
2.2 Focused web crawler
For each page containing mobile text from our set of 10 K unique hosts, we started a web crawler. The crawler downloaded up to 100 pages linked from the original URL. The crawler did not recursively descend deeper into the site. We deleted downloaded pages that did not contain an instance of the text “sent from my.” Our final collection consisted of 5.0 M pages from 9856 hosts and had a compressed disk size of 74 GB.
On a per host basis, we kept only unique posts to avoid a post from appearing multiple times. We only kept posts identified as English with a confidence of 0.95. We removed posts if a “sent from my” signature was detected in the middle of a post instead of at the end. Signatures could occur in the middle of a post if the author edited their original post. This would make it questionable whether all or only some of the text was written on a mobile device.
We took various measures to ensure posts contained only text from a single author (i.e. posts that did not contain quoted replies). Primarily, this was done by looking at the HTML structure of the page. The vBulletin platform had archive and printing oriented pages that displayed a simplified view of a forum thread that lacked rich HTML structure. We eliminated these pages based on keywords in the URL or in the text of the page. We dropped any post containing text common in quoted posts (e.g. “-Original Message-”). Finally, we dropped posts that had a prefix that matched any other post occurring on the same host.
A small number of hosts had a very large numbers of posts (66% of posts were from the top 1% of hosts). To help ensure our data was representative of a wide-variety of subject matter, we selected at random up to 20 K posts from any one particular host. This reduced the top 1% of hosts to only 13% of the total posts. Our final set had 6.8 M posts from 9462 hosts.
2.3 Groupings of posts
Using the mobile signature at the end of a post (if any), we grouped posts into the following sets:
NonMobile – Contained no mobile device signature.
Mobile – Contained a mobile device signature from one of 300 known devices.
Phone – From any type of mobile phone.
Tablet – From a tablet device (e.g. iPad).
PhoneTouch – From a phone with a touchscreen but no physical keyboard.
PhoneKey – From a phone with a physical keyboard.
iphone – From an Apple iPhone device.
Android – From the 10 most frequent Android devices seen in our dataFootnote 2.
About 10% of posts had a mobile device signature but the device was not in our list of 300 devices. These were either rare devices or other types of comedy signatures such as “sent from my brain.” We excluded these posts from our analysis.
While we use the presence or absence of a signature to separate mobile and non-mobile posts, this is only an approximation. NonMobile undoubtedly contains instances of mobile posts. This could occur if a mobile user posted to a forum via a mobile web browser instead of a forum app. Additionally, a user may be using an app that was not configured to add a signature. Similarly, though less likely, posts in Mobile may have been from users pretending to own a particular device.
2.4 Independent forum dataset
Our mining method specifically sought out only forums where at least one post was from a mobile device. This likely increased the probability that posts without a signature were from a mobile device. This is because a forum with some mobile users is likely to have on average more mobile users than a forum chosen purely at random. Additionally, we were more likely to collect data from mobile device-related forums.
To provide an independent set of forum data, we also parsed the forum data from the ICWSM 2011 Spinn3r corpus (Burton, Java, and Soboroff Reference Burton, Java and Soboroff2009). This dataset contains 5.7 M HTML pages from online forums. We parsed these pages with the same procedure we used for our web-mined data. Of the 3.8 M posts parsed, only 4988 had a mobile device signature. We deemed this too small to serve as a mobile forum dataset. As such, we excluded these mobile posts and used the remainder to create a non-mobile dataset which we will refer to as Spinn3r.
3. Analysis of mobile text
We now analyze the characteristics of our datasets. Throughout our analysis, we present metrics that, we anticipated, would expose input aspects that might inform improved user interfaces or recognition technology. For example, knowing the number of words per sentence speaks to both screen real estate concerns and to a recognizer’s prediction of end-of-sentence punctuation. If out-of-vocabulary (OOV) words, emoticons, texting vocabulary, email addresses, or URLs are common, the language model may want to include pseudo-word classes to help with recognition and to allow the entry interface to better support seamless entry of these items. If text is often in all lowercase or uppercase, improved capitalization support might be indicated.
3.1 Per-post analysis
For each post, we calculated the following metrics:
Words – The number of whitespace-separated character chunks with at least one letter. We removed any “sent from my” signature before computing this. We separated any character chunks concatenated by hyphens, slashes, commas, or consecutive periods. We also removed any detected emoticons, email addresses, or URLs.
OOV rate – We calculated the OOV rate from the words found in the prior step. We stripped non-alphanumeric characters aside from apostrophe and converted each word to lowercase. A word was considered OOV if it was not in a list of 330 K English words obtained from human-edited dictionariesFootnote 3 or in our list of 50 texting abbreviations.
Email addresses – The percentage of posts containing an email address.
URLs – The percentage of posts containing one or more web site addresses. We only counted URLs that appeared in the body text of the post. We did not count links to images or other HTML tags that were embedded in a post.
Emoticons – The percentage of posts containing one or more emoticons encoded using normal keyboard symbols such as colons, parentheses, and dashes. We included the emoticons from Read (Reference Read2005) as well as “noseless” versions without a dash, for example, “:)” in addition to “:-)”. This resulted in a list of 21 emoticons.
Texting abbreviations – The percentage of posts containing one or more words from a list of 50 popular texting and chat acronyms.Footnote 4
Emphasis – The percentage of posts containing a word flanked by asterisks, underscores, tildes, angled brackets, or curly braces (e.g. *grin*). These characters were used as emphasis cues in previous work analyzing blog, email, and chat room communications (Riordan and Kreuz Reference Riordan and Kreuz2010).
Letter runs – The percentage of posts containing a word with three or more repeated letters (e.g. yahoooo). Such vocal spellings of words were first observed in person-to-person communications in early computer chat and messaging systems (Carey Reference Carey1980). More recently, it has been observed as a way to convey sentiment in tweets (Brody and Diakopoulos Reference Brody and Diakopoulos2011) and email messages (Kalman and Gergle Reference Kalman and Gergle2009).
Punctuation runs – The percentage of posts containing a word ending in three or more periods, question marks, or exclamation points (e.g. Hi!!!). Such manipulation of grammatical markers has been observed as a way to convey affect in early messaging systems (Carey Reference Carey1980), dialog systems (Neviarouskaya, Prendinger, and Ishizuka Reference Neviarouskaya, Prendinger and Ishizuka2007), MySpace comments (Thelwall et al. Reference Thelwall, Buckley, Paltoglou, Cai and Kappas2010), and email messages (Kalman and Gergle Reference Kalman and Gergle2009).
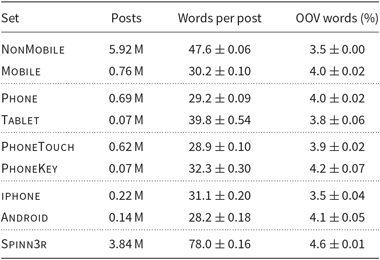
As shown in Table 1, the number of words per post was notably different between sets. The Spinn3r posts were the longest at 78 words. The NonMobile posts that lacked a mobile device signature averaged 48 words. The Mobile posts on the other hand were much shorter at 30 words. It also appears people write shorter posts on phones at 29 words compared to tablets at 40 words. While the difference is smaller, people seems to write shorter posts on touchscreen phones at 29 words compared to phones with a physical keyboard at 32 words. This propensity to write longer when the entry method requires less effort was previously seen in a comparison of predictive and non-predictive phone keypad input (Ling Reference Ling2007). As one might expect, there was high variability in post length. Nonetheless, these averages could be useful to designers of forum apps or web sites as it informs how much text mobile users are likely to enter.
The number of posts, the average words per post, and the percentage of words that were out-of-vocabulary (OOV) in each dataset. ± values denote 95% confidence intervals of the mean

The OOV rate was between 3.5% and 4.6% for all sets. The top 20 OOV words across all datasets were: dont, thats, ive, didnt, hp, ipad, gb, ps, hd, nd, rd, usb, doesnt, oem, cm, evo, ie, gps, ics, htc. Many of the top OOV words were contractions that lacked an apostrophe. We will study this phenomenon in more detail in Section 3.4. Most of the other OOV words were acronyms. This suggests input method developers may want to add common acronyms to their system’s vocabulary.
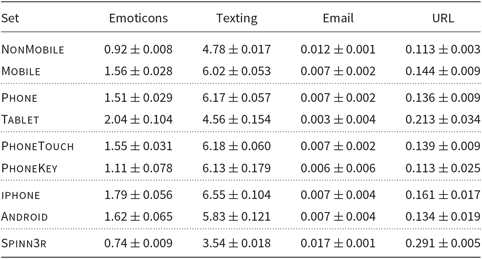
As shown in Table 2, the use of emoticons was higher in Mobile at 1.6% versus NonMobile at 0.9%. We also found the distribution of the most common emoticons was different. In Mobile, we found the nosed smiley :-) occurred slightly more frequently than the nose-less smiley :). In the NonMobile set, we found the nose-less version occurred four times as often as the nosed. Since the dash often requires extra user actions in many mobile text entry interfaces, this could indicate users are making use of features on their mobile device or forum app that facilitate entry of a smiley that later gets converted into text. It could also be that the use of noses depends on other aspects of users that are correlated with posting from a mobile device. For example, Schnoebelen (Reference Schnoebelen2012) conjectured that non-nose users are younger than nose users. We also found ASCII emoticons were much less frequent in Spinn3r likely reflecting the less mobile nature of this set.
The percentage of posts that contained emoticons, texting slang, email addresses, or URLs. ± values denote 95% confidence intervals of the mean

We found texting abbreviations were more frequent in Mobile than in NonMobile (6.0% vs. 4.8%) and much more frequent than in Spinn3r (3.5%). Furthermore, it appears texting abbreviations were more common on phones than on tablets (6.2% vs. 4.6%). Previous work has shown the prevalence of such abbreviations in mediums with technology-imposed length limits such as SMS (Grinter and Eldridge Reference Grinter and Eldridge2003) and Twitter (Han and Baldwin Reference Han and Baldwin2011). Despite forums not having a length limit, we still see abbreviations being used especially for mobile forum posts. This suggests users are abbreviating to accelerate the mobile input process. It also suggests, especially on phones, developers should take into account texting language in their autocorrection and autocompletion algorithms.
Virtually no email addresses occurred. This seems reasonable since the data was from public forums and blogs. Users may not want to risk spam or other unwanted contact by providing their email addresses. This is however a notable deficiency in our data collection. In real-world mobile text entry, a common task may involve writing a private email or SMS containing an email address. URLs were also infrequent in all sets.
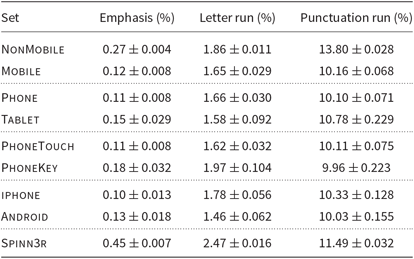
As shown in Table 3, the use of symbols to denote words with special emphasis was infrequent, but occurred less often in Mobile (0.1%) compared to NonMobile (0.3%) and Spinn3r (0.5%). Words with runs of letters were infrequent but occurred with a slightly higher frequency of 1.9% in NonMobile versus 1.7% in Mobile. This difference was more pronounced in Spinn3r where 2.5% of posts contained letter runs. This rate of expressive lengthening was much lower than the one in six tweets found by Brody and Diakopoulos (Reference Brody and Diakopoulos2011). We suspect this reflects the different style of communication; forum posts often are seeking or providing information while tweets are often interpersonal communications that may benefit from simulating the prosodic emphasis of spoken language. Punctuation runs at the end of words followed a similar pattern with fewer occurrences in the mobile data.
The percentage of posts that contained emphasized words, runs of the same letter, or runs of the same punctuation. ± values denote 95% confidence intervals of the mean

Taken together, it appears that users while mobile seem to refrain from writing certain forms of text. It may be that the special characters required are difficult to enter on a mobile device. It could also result from the difficulty of engaging in a particular activity while mobile (e.g. searching for relevant URLs to include).
3.2 Character-level analysis
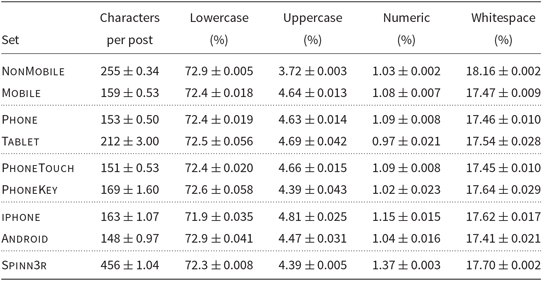
For each post, we calculated the percentage of characters that were lowercase, uppercase, numbers, or whitespace. As shown in Table 4, the use of different character classes was similar across all sets. While we had anticipated mobile users who might have preferred all lowercase entry, this did not appear to be the case. We also thought mobile users might avoid entry of numbers since they can often be more difficult to access in mobile text entry interfaces, but this also did not appear to be the case.
Character-level metrics on a per-post basis. This includes the average characters per post and the percentage of characters that were: lowercase, uppercase, numeric, or whitespace. ± values denote 95% confidence intervals of the mean

3.3 Per-sentence analysis
We split each post into sentences using rules based on case, symbols, and whitespace. We converted contiguous whitespace characters into a single space character. We dropped posts that did not conform to typical patterns of sentences. We also dropped sentences containing numbers or symbols besides apostrophe, period, question mark, and exclamation point.
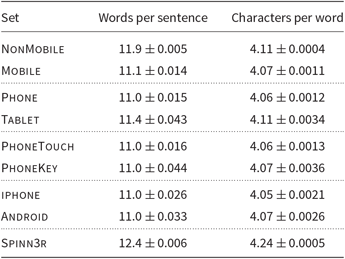
As shown in Table 5, sentences were shorter in Mobile (11.1) than in NonMobile (11.9) and Spinn3r (12.4). We also found a small difference in the number of characters per word between mobile and non-mobile sets: Mobile 4.07 versus NonMobile 4.11 and Spinn3r 4.24. Word length also seemed to be influenced by device form factor: Phone 4.06 versus Tablet 4.11. This may indicate a slight preference for shorter or abbreviated words when typing on a mobile device.
The average words per sentence and the average characters per word. ± values denote 95% confidence intervals of the mean

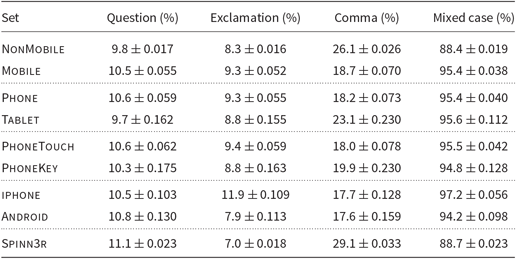
As shown in Table 6, question and exclamation sentences occurred with similar frequency in the mobile and non-mobile data. Since end-of-sentence punctuation is important for denoting sentence boundaries, it appears mobile users continue to use such punctuation despite any extra effort required. The use of exclamations on iPhones was higher at 12% versus 8% on Android. The reason for this is unclear; both systems require going to a secondary keyboard screen to type an exclamation point.
The percentage of sentences that were questions, exclamations, contained one or more commas, or were in mixed case. ± values denote 95% confidence intervals of the mean

Mobile users did appear to be use commas less often: 19% in Mobile versus 26% in NonMobile and 29% in Spinn3r. We conjecture this may be due to the extra effort required to type such punctuation on a mobile device. For example, the comma key is not available on an iPhone’s primary keyboard layout. Comma use on tablets increased to 23%, indicating that having more screen real estate facilitates keyboard designs that better support punctuation. Since users appear to commonly need commas, mobile text entry designers may want to explore ways to make access to commas easier or to automatically insert commas.
Sentences written on mobile devices were much more likely to be in both upper and lowercase (95% in Mobile vs. 88% in NonMobile and 89% in Spinn3r). This may at first seem surprising given using the shift key on a mobile device requires an extra keypress. However, many phones (e.g. the iPhone) automatically capitalize the first letter of every sentence. We conjecture this feature resulted in better overall capitalization for mobile users compared to non-mobile users.
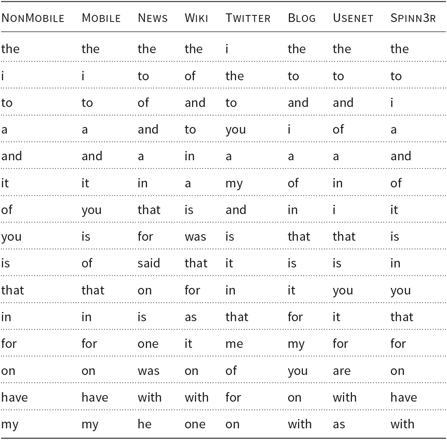
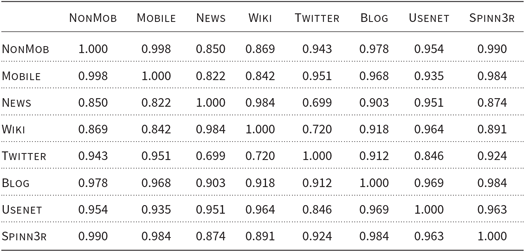
We wondered if people were using different words depending on their device. We found the most frequent 15 words in each of our sets. In the Mobile set, they were: the, i, to, a, and, it, you, is, of, that, in, for, on, have, my. With the exception of Spinn3r, all other sets had the same 15 most frequent words with just minor changes to the frequency order. Spinn3r was almost identical except my was replaced by are as the 15th most frequent word. We also tallied the frequency of words in each set that appeared in a 64 K vocabulary. We created the vocabulary from the most frequent words in our forum data that also appeared in a list of 330 K known English words. We then computed the cosine similarity between the term frequency vector of each set. For all pairs of sets, the cosine similarity was 0.99 or higher. Thus, it appears word choice was not strongly influenced by whether someone was using a mobile device or not.
3.4 Spelling and typing errors
We used eight different classes of errors to classify various typing mistakes:
(1) Apostrophe deleted – Apostrophe deleted from a word: dont
(2) Insertion – Extra letter inserted: whille
(3) Substitution nearby – One letter substituted for an adjacent letter based on the QWERTY keyboard layout: whilr. Key adjacency is dependent on a user’s specific keyboard. We created our adjacency map based on the key positions on the iPhone 4S and a Macbook Pro.
(4) Substitution – One letter substituted for any other letter: whibe
(5) Deletion – Letter deleted from a word: whil
(6) Transposition – Two contiguous letters swapped in a word: whlie
(7) Space deleted – Space missing between words: whileit
(8) Space inserted – Space inserted inside a word: whi le
We based these error classes on Cooper (Reference Cooper1983) and on common mistakes we have observed in previous mobile text entry studies. Some of these error classes could be combined, for example, an apostrophe deleted error could be considered as a more generic deletion error. We chose our error classes and the order in which we matched against them to help illustrate strategies we thought users might be using while mobile (e.g. deleting apostrophes in contractions to avoid having to switch to a secondary keyboard screen).
For a small numbers of sentences, it might be possible to manually identify errors. But for large amounts of data, clearly an automated detection algorithm is needed. We designed our correction algorithm to be conservative since our objective here is to compare the relative prevalence of errors in our different datasets, not to measure the absolute error rate. Furthermore, as we will discuss in the next section, our mined text will serve as language model training data. We thus wanted to explore correcting likely errors prior to language model training.
Our algorithm proceeded through each sentence checking for possible error corrections. Possible error locations had to meet the following three criteria:
(1) The word to be corrected could not be in our large list of 330 K English words.
(2) The replacement word had to be a known English word in the 64 K most frequent words in our forum data.
(3) The replacement had to involve a single change (i.e. deleting one character, adding one character, changing one character, or swapping two characters).
Furthermore, we only made a correction if it caused a decrease in the average per-word perplexity of the sentence. Perplexity measures the average number of choices the language model has when predicting the next word. For example, if a language consists of the digits 0–9 and digits are equally probable, the perplexity is 10. Lower perplexity is better. Perplexity is calculated as follows:
 \begin{equation*}
PP(W) = 2^{-\frac{1}{L} \log_{2}P(W)},
\end{equation*}
where W is the test text, L is the number of words in W, and P(W) is the probability of W under the language model.
This perplexity-based criteria allowed both the words to the left and to the right of the candidate location to influence the plausibility of a proposed correction. We used a 3-gram language model with a vocabulary of 64 K words including an unknown word. The model was trained on 1.3 B words of newswire text. The gzipped compressed ARPA text format language model was 2.5 GB. We used newswire text as it is a high quality text source with few spelling or typing mistakes. The language model had a perplexity of 374 on test set of sentences from our mobile forum data (PostDev from Section 4.2).
If a location in a sentence had a number of possible corrections (of the same correction type or different types), we choose the correction which caused the greatest decrease in a sentence’s per-word perplexity. In the event of a tie, we used the first error class in the above list of eight. This allowed us to detect the most specific error class in preference to a more general class (e.g. “whilr” would be classified as a substitution nearby error rather than a more general substitution error).
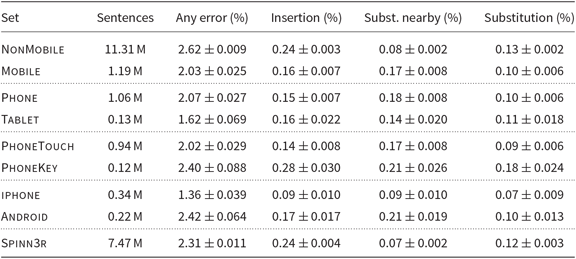
Tables 7 and 8 show the percentage of sentences that had one or more instances of a particular type of error. Substitution nearby errors were more common in the mobile data than in the non-mobile data (0.17% in Mobile vs. 0.08% in NonMobile and 0.07% in Spinn3r). Thus, it does appear users of mobile devices more frequently introduced errors as the result of accidentally hitting adjacent keys.
The number of sentences in each set and how often any type of error was detected in a sentence. This table also shows the percentage of sentences that contained an insertion, substitution nearby, or substitution error

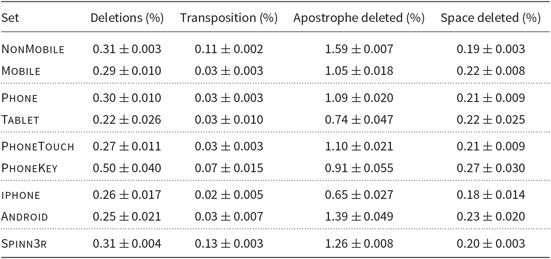
The percentage of sentences in which our algorithm detected a deletion, transposition, apostrophe deleted, or space deleted error. We omitted space inserted errors since they occurred very infrequently

Transposition errors were higher in NonMobile (0.11%) and Spinn3r (0.13%) compared to Mobile (0.03%). This is to be expected since non-mobile entry often involves bimanual typing on a desktop keyboard and a mistiming between a user’s two hands can result in transposing letters. PhoneKey also has an elevated transposition rate of 0.07%, likely as a result of two thumbs typing on a mini-keyboard.
Given that the frequency of substitution nearby and transposition errors appears to vary depending on device, developers of mobile text entry methods may want to take this into account. For example, when a touchscreen phone is in landscape orientation, two-thumb typing may be more likely and thus so are transposition errors. This could be incorporated into the recognition model.
To investigate the algorithm’s accuracy, we had nine workers on Amazon Mechanical Turk judge 100 random sentences from each of the first seven error classes (for a total of 700 sentences and 6300 individual worker judgments). We excluded the space insertion class as it occurred only twice in our data. Our Amazon Human Intelligence Task (HIT) showed the original sentence and the algorithm’s proposed correction. Workers judged each correction as valid or invalid. Each HIT involved judging a total of 28 sentences, four from each of the seven different classes. We also injected sentences with five known valid and five known invalid corrections (determined by the authors). Workers had to correctly judge at least 70% of the known corrections to be included in the judge pool. Twenty percent of workers were removed by this requirement. After this removal, all sentences still had four or more judges. Krippendorff’s alpha (Hayes and Krippendorff Reference Hayes and Krippendorff2007) showed an inter-judgment agreement reliability of 0.586. This constitutes a moderate amount of agreement.
Of the 5785 worker judgments, 89% indicated the algorithm’s correction was valid. Some error classes were nearly always correct: apostrophe deleted 99.8%, nearby substitution 96.6%, deletion 98.0%, and transpositions 99.3%. Other classes were judged quite often to be correct: space deleted 88.6%, substitution 84.3%, and insertion 82.7%.
4. Language modeling experiments
In this section, we conduct a series of experiments exploring the importance of in-domain data when training language models for mobile text entry. We also show the importance of using long-span language models and investigate whether high-performance models can be made small enough for deployment on mobile devices.
4.1 Training sets
We wanted training data that best represented the vocabulary and style of text entered by people while mobile. Our criteria for choosing training sets were: (1) common text sources from prior work, (2) on the scale of many millions of words, and (3) similar in style to mobile text. We decided on the following eight sources:
(1) NonMobile – Posts in our forum training set that did not have a mobile device signature. 11.3 M sentences, 135 M words, 678 M characters.
(2) Mobile – Posts in our forum training set that were sent from one of 300 known mobile devices. 1.19 M sentences, 13.1 M words, 65.4 M characters.
(3) News – News articles from the CSR-III and Gigaword corpora. 60.4 M sentences, 1.32 B words, 7.74B characters.
(4) Wikipedia – Articles and discussion threads from a snapshot of Wikipedia (January 3, 2008). 23.9 M sentences, 452 M words, 2.61 B characters.
(5) Twitter – Twitter messages we collected via the streaming API between December 2010 and June 2012. We used the free Twitter stream which provides access to a small percentage of all tweets. Given Twitter enforces a character limit of 140 characters and is often used by people on mobile devices, we conjectured this dataset would be quite similar in style to mobile text. We excluded repeated tweets from the same user, retweets, and tweets not identified as English by a language identification module (Lui and Baldwin Reference Lui and Baldwin2012). 140 M sentences, 1.05 B words, 5.12 B characters.
(6) Blog – Blog posts from the ICWSM 2009 corpus (Burton et al. Reference Burton, Java and Soboroff2009). 24.5 M sentences, 387 M words, 2.05 B characters.
(7) Usenet – Messages from a corpus of Usenet messages (Shaoul and Westbury Reference Shaoul and Westbury2009). 124 M sentences, 1.85 B words, 10.2 B characters.
(8) Spinn3r – Posts from the Spinn3r corpus (Burton et al. Reference Burton, Java and Soboroff2009) that did not have a mobile device signature. 12.4 M sentences, 126 M words, 670 M characters.
To get a sense of the differences between the training sets, we first examined the most frequent words in each training set (Table 9). Notably sets based on more informal and interpersonal communications such as forum messages and tweets had more frequent use of personal first and second person pronouns, for example, “I” and “you.”
The 15 most frequent words in the different training sets. Words are ordered in descending order of frequency

Using the word frequency in each training set with respect to our 64 K vocabulary, we computed the cosine similarity between the term frequency vector for each set. As shown in Table 10, the NonMobile, Mobile, Blog, and Spinn3r sets were very similar to each other. The Wikipedia and News sets were also similar to each other, but these two sets had the lowest similarity to the other training sets.
The cosine similarity between each of the training sets

4.2 Test sets
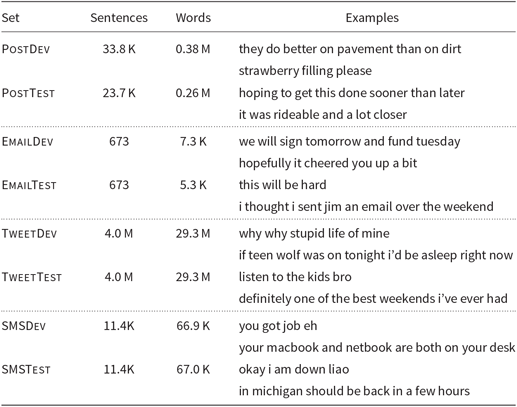
We will measure the perplexity of test data to compare our different language models. We wanted this test data to closely approximate what users might be writing in a variety of mobile text entry scenarios. Unfortunately, there is little verifiable mobile test data available. The best sources we found consisted of the following four sources:
(1) Posts – Posts in the MOBILE subset of our forum data. We withheld 2.5% (250 hosts) as development data and another 2.5% (236 hosts) as test data. The remaining 9370 hosts served as a training set. This split into training, development, and test sets was done semi-automatically, keeping groups of likely related domains in the same set. For example, we kept forums.macworld.com and www.macworld.com.au together but split different subdomains on blogspot.com.
(2) Email – Email messages written by Enron employees on their Blackberry mobile devices (Vertanen and Kristensson Reference Vertanen and Kristensson2011b).
(3) Tweets – Tweets recorded via the streaming API between June and September 2015. We only used tweets written on a mobile device by searching for “Twitter for iPhone” or “Twitter for Android” in the source attribute. We excluded repeated tweets from the same user, retweets, and non-English tweets identified via a language identification module (Lui and Baldwin Reference Lui and Baldwin2012). We parsed tweets into sentences based on punctuation. We required all words in a sentence to be in our list of 330 K English words.
(4) SMS – We combined the NUS SMS corpus (Chen and Kan Reference Chen and Kan2013) and the Mobile Forensics Text Message corpus (O’Day and Calix Reference O’Day and Calix2013). From the NUS corpus, we took messages from native speakers who were using a smartphone and had entered text via a full keyboard or the Swype entry method. This resulted in 18,705 messages. From the Mobile Forensics corpus, we took messages sent or received by the users. We excluded messages inserted by the researchers. This resulted in 4219 messages.
We split each type of test data into two halves, a development test set for use in initial optimization of our language models and an evaluation test set for use in our final evaluation. All data were converted to lowercase and punctuation was stripped (except for apostrophe). We dropped sentences containing numbers. Table 11 provides details about each test set including several example sentences.
Development test sets and evaluation test sets used in our experiments

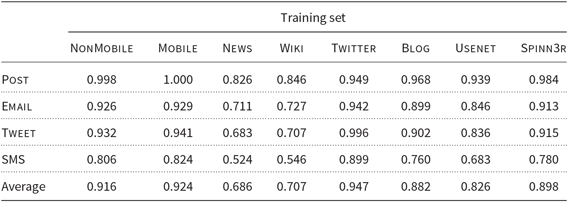
Combining the development and evaluation test sets, we tallied the frequency of the words in our 64 K vocabulary. Table 12 shows the cosine similarity between our different types of test and training data. As we will see, the training sets that had a similar word frequency distribution to the tests sets tended to produce the best language models for predicting those test sets.
The cosine similarity between the test sets and the training sets

4.3 Language model training
We trained our word language models using the SRI Language Modeling Toolkit (SRILM) (Stolcke Reference Stolcke2002; Stolcke et al. Reference Stolcke, Zheng, Wang and Abrash2011). We used SRILM as it provides a rich set of features for training models, pruning models, and creating mixture models. We trained our models using interpolated modified Kneser–Ney smoothing. This smoothing method has been shown to outperform a variety of other smoothing methods (Chen and Goodman Reference Chen and Goodman1996). Our word language models used a vocabulary of the most frequent 64 K words in our forum data that also were in a list of 330 K known English words. All models were trained with an unknown word that was used in place of OOV words in the training data. In the auspices of a user interface, this allows the model to continue to make predictions even after entry of an OOV word such as a proper name.
In this section, we focus on word language models. However, in Section 5, we will need character language models for use in our touchscreen typing experiments. We trained our character language models with SRILM using interpolated Witten–Bell smoothing. We used Witten–Bell smoothing as it is robust to circumstances when all n-grams of a given order occur in the training data as is typical of the small vocabulary of a character language model (Stolcke, Yuret, and Madnani Reference Stolcke, Yuret and Madnani2010). The vocabulary of our character languages models consisted of the letters A–Z, apostrophe, and a token representing the space character.
For large training sets, representing every n-gram seen in the training data can generate models that require substantial storage and memory. In some of our experiments, in order to reduce our language models to a size appropriate for mobile devices, we employed entropy pruning (Stolcke Reference Stolcke1998). In entropy pruning, first a language model is trained without dropping any n-grams. The model is then pruned to remove n-grams that do not contribute significantly to predicting the training text. During pruning of our word models, we used a Good–Turing estimated model for the history marginals as the lower-order Kneser–Ney distributions are unsuitable for this purpose (Chelba et al. Reference Chelba, Brants, Neveitt and Xu2010).
We report the size of our language models by the number of parameters and by their compressed disk size. We took the number of parameters to be the count of all n-gram probabilities and backoff weights. The compressed disk size was the gzipped size of the ARPA text format language model.
In some of our experiments, we will combine training data from multiple sources. While we could simply concatenate the data from each source, this would make it difficult to control how much each source contributes to the final model. This is especially problematic when sources have wildly differing amounts of data. Instead, we trained models on each source independently and later merged the models to produce a mixture model via linear interpolation. In linear interpolation, models are assigned mixture weights that sum to one. We optimized mixture model weights using expectation maximization as implemented by SRILM’s compute-best-mix script (Stolcke Reference Stolcke2002). We optimized the weights with respect to an equal amount of data from each of our four development test sets.
4.4 Amount of training data
Our first experiment explored how different training sources and the amount of data affected predictions. We trained 10 language models on randomly selected subsets of each of our training sets. We trained 3-gram (trigram) language models.
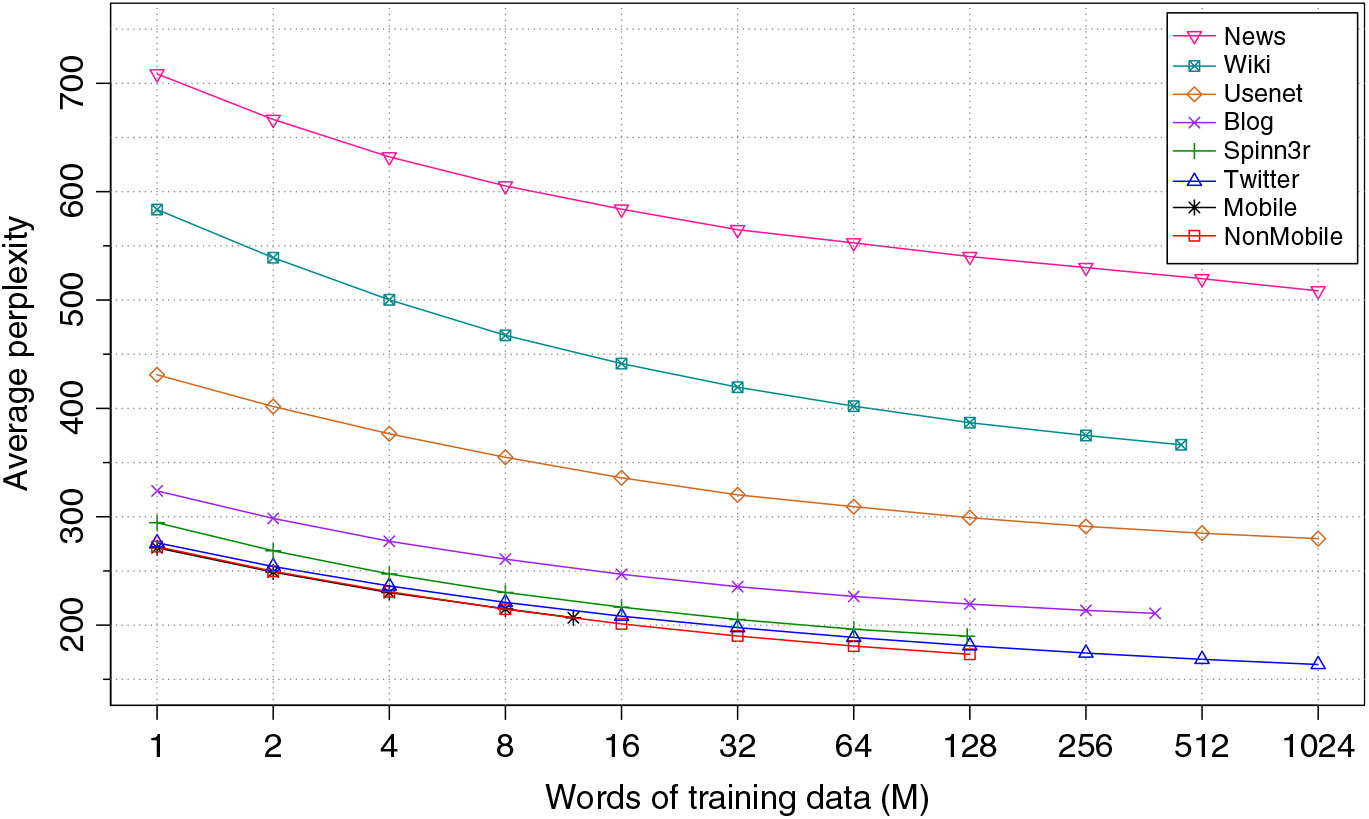
Figure 1 shows the average perplexity on our four development test sets for models trained on each type of data. For all training sets, using exponentially more data resulted in sub-linear decreases in perplexity with the majority of the gains being made by 128 M words of training data.
Average perplexity of 10 3-gram language models trained on increasing amounts of data from different sources. Results are the average perplexity on our four development test sets. Two standard deviation error bars were no larger than the data point symbols and have been omitted for clarity.

Word-for-word, the NonMobile and Mobile training sets produced the best performing models. NonMobile out-performed models trained on substantially more data (with the exception of Twitter when trained on eight times more data). We found NonMobile did just as well as Mobile. This provides additional evidence that our collection procedure resulted in NonMobile containing mobile-like text despite being made up of posts without a mobile device signature.
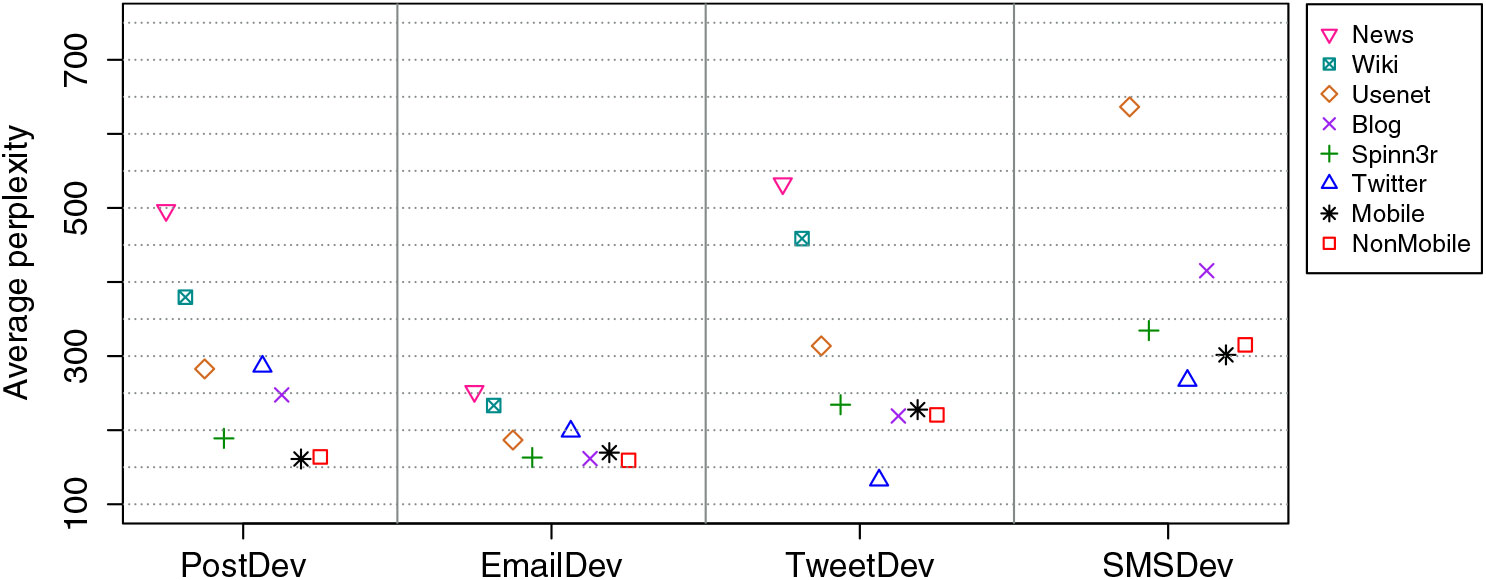
Figure 2 shows performance on each test set for models trained on 8 M words. As might be expected, NonMobile and Mobile did the best on the closely matched PostDev. Twitter did substantially better than other models on the closely matched TweetDev. Overall, models trained on our mobile forum data performed well on all types of mobile test data. The SMSDev test set consistently had the highest perplexity. We suspect this is due to people using abbreviations and slang when sending SMS messages. Posting a message to a forum from a mobile device may not have elicited similar language effects. Additionally, it seems data from Twitter, blogs, and other forums like Spinn3r are promising training sources for modeling mobile text.
Average perplexity of 10 language models trained on 8 M words of data from different sources. Results on each development test set. Some poorly performing models appear off the top of the graph and have been omitted.

4.5 Mixture model and model order
Our previous best models used the NonMobile and Mobile data. Since these sets performed similarly, we combined them to form a single training set which we will refer to as Forum. The Forum training set consisted of 141 M words.
We wanted to see if further improvements were possible by adding in other data sources. We trained a mixture model (denoted as Mix) training each component on 126 M words of data from each of our four best sources: Forum, Twitter, Spinn3r, and Blog. The optimal weights for a 3-gram model were: 0.33 Forum, 0.42 Twitter, 0.12 Spinn3r, and 0.13 Blog.
To investigate how many words of prior context should be used, we trained 2-gram through 5-gram language models. In the case of the mixture language model, we optimized the mixture weights for each model order with respect to our development data. The weights were similar to those reported for the 3-gram model.
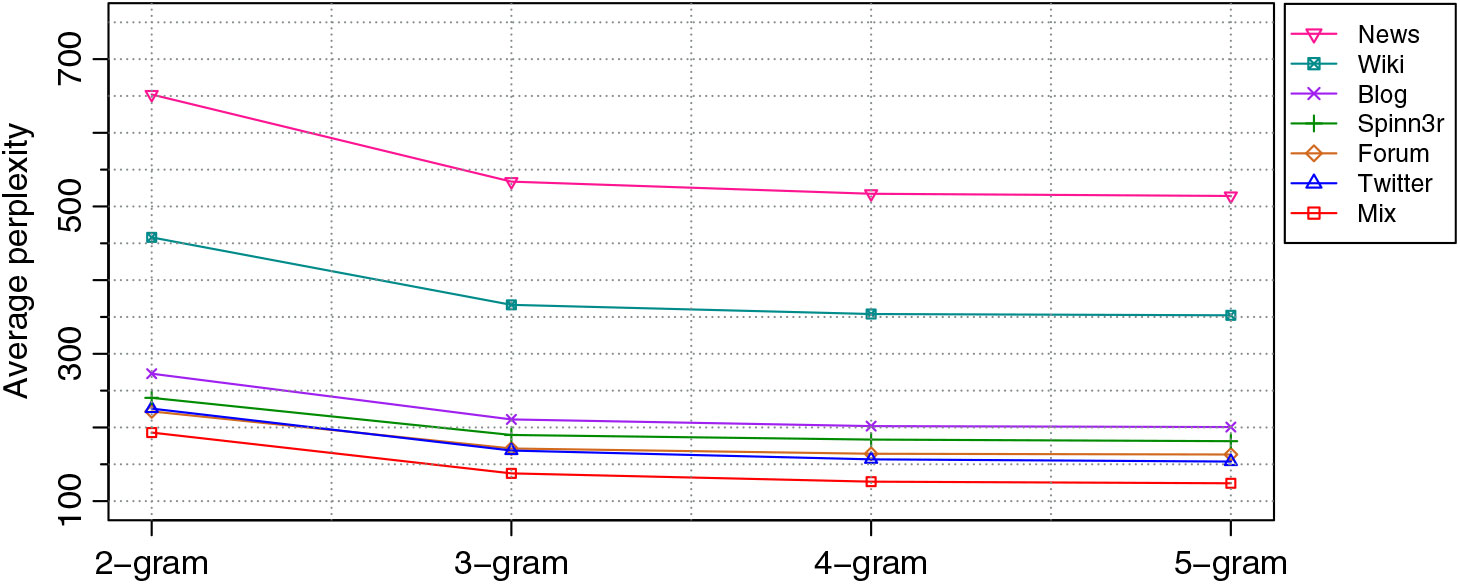
The Mix, Twitter, and News models were trained on 504 M total words of data. The other models were trained on smaller amounts of training data: Wiki 452 M, Blog 387 M, Forum 141 M, and Spinn3r 126 M. We computed the average perplexity on our four development test sets on the 2-gram through 5-gram language models. As shown in Figure 3, Mix outperformed the Forum and Spinn3r models. Mix also substantially outperformed Twitter models trained on the same amount of data. We found performance improved as model order increased, but diminished past 3-gram models. The poor performance of 2-gram models in comparison to the 3-gram models demonstrates the importance of using long-span language models in predictive text entry interfaces. For the rest of this paper, we use 3-gram models as longer orders only offered modest perplexity gains.
Perplexity of language models trained on different training sources and with different model orders. Results are the average on the four development test sets.

4.6 Effect of automatic correction of training data
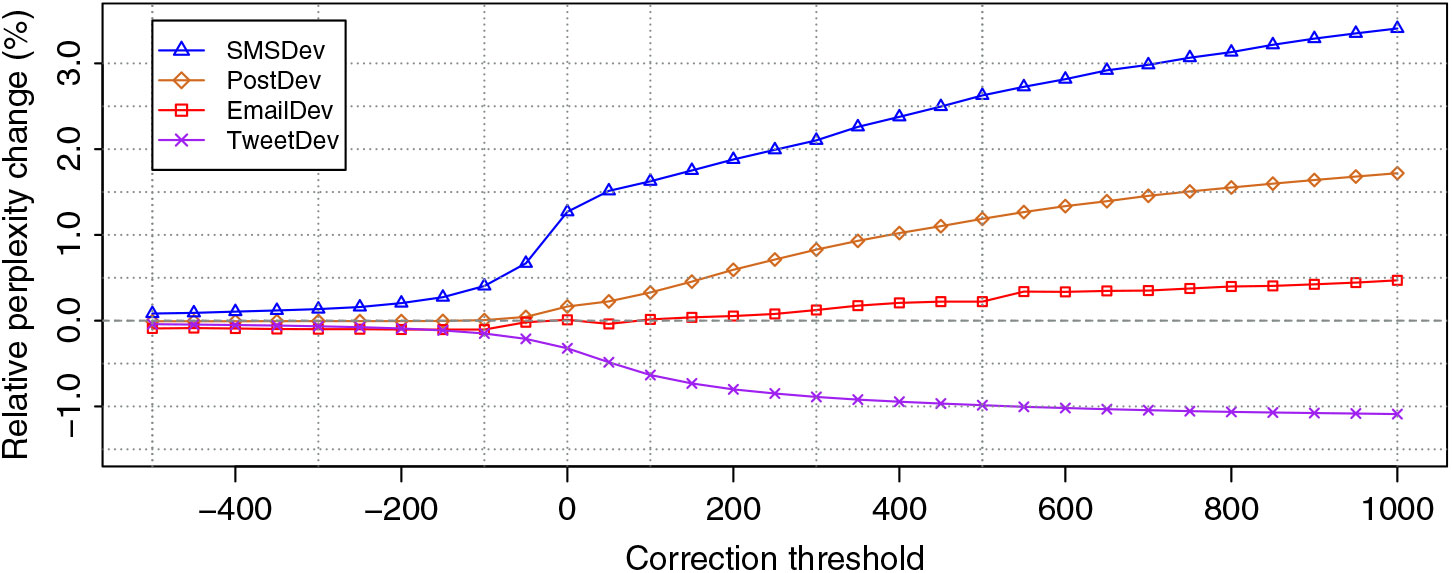
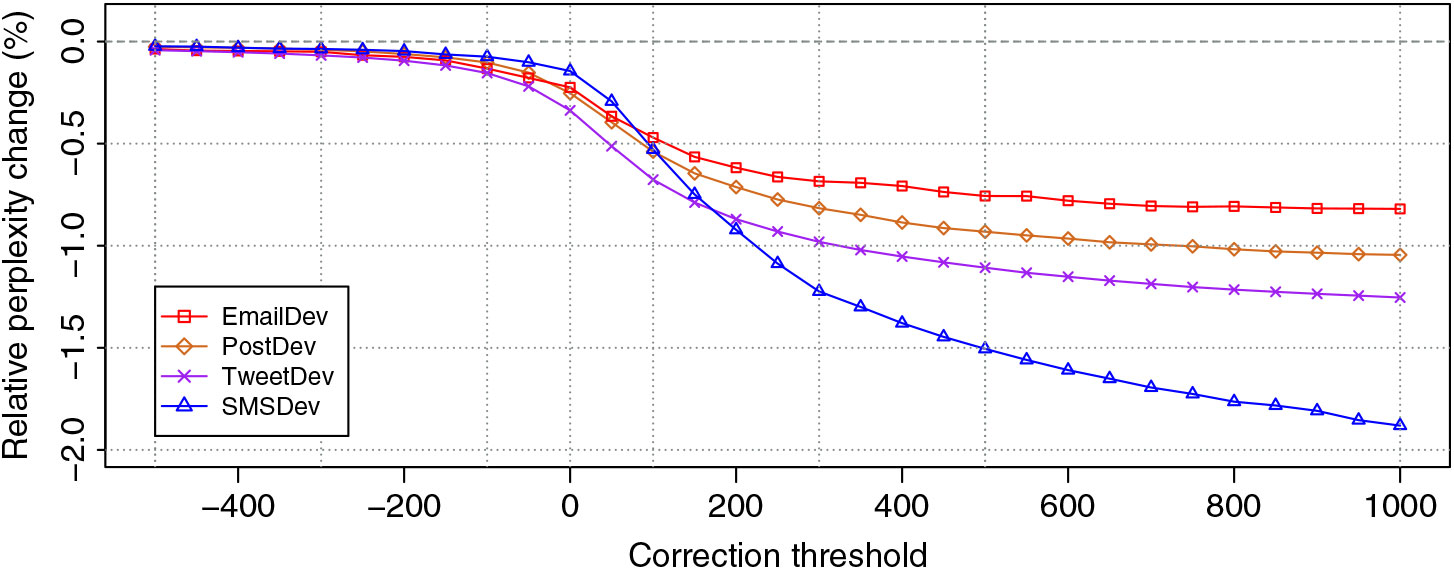
Mined web data such as our Forum set is bound to contain spelling mistakes and typos. We investigated whether using the previously described correction algorithm on the language model’s training data would improve performance of the resulting model. Previously, we only accepted a correction if it reduced a sentence’s per-word perplexity. We modified our algorithm to accept a correction if the change in perplexity was less than some threshold. Positive thresholds allow corrections that may increase a sentence’s perplexity, while negative thresholds require corrections reduce a sentence’s perplexity. These experiments used the Forum training set.
We measured the perplexity of the four development sets with respect to a model trained without correction. As shown in Figure 4, automatic correction had a slight negative impact for most development sets. In particular, the SMSDev, PostDev, and EmailDev sets saw increased perplexity with more correction. The TweetDev set on the other hand saw decreased perplexity with more correction.
Relative change to perplexity on the four development test sets with varying amounts of automatic correction. Change computed with respect to a language model with no automatic correction.

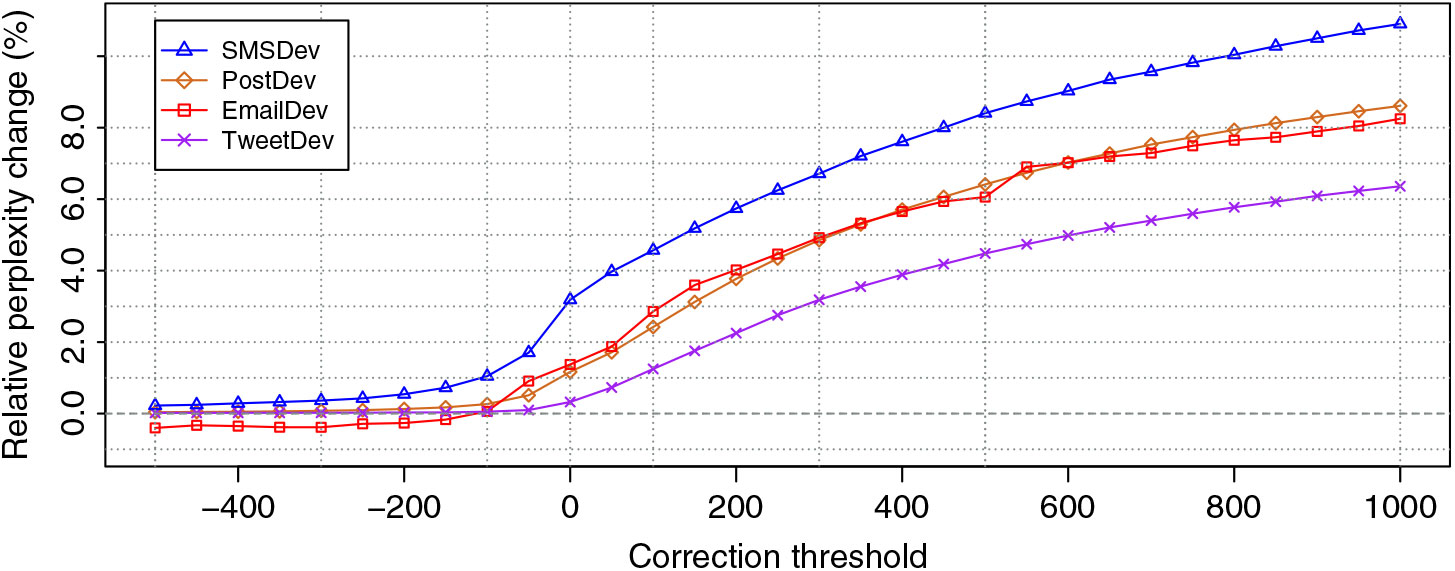
We believe the difference on the test sets is related to an interaction between automatic correction and OOV words. SMSDev had the highest OOV rate at 8.50% compared to PostDev 2.61%, EmailDev 1.26%, and TweetDev 0.26%. The OOV rate of the training data without correction was 2.32%. As the correction threshold was increased, the OOV rate decreased as typos such as “didnt” were replaced with “didn’t.” For example, with a threshold of -250, 51 K corrections were made in the training data resulting in a slightly lower OOV rate of 2.26%. A more aggressive threshold of 250 resulted in 1.3 M corrections and lowered the OOV rate more substantially to 1.36%. With fewer OOV words in the training data, the resulting language models had lower probabilities for n-grams containing the unknown word. Perplexity on the subset of sentences with no OOVs saw consistent reductions in perplexity with more correction (Figure 5), while the subset with one or more OOV words saw increased perplexity with more correction (Figure 6).
Relative perplexity change on sentences with no OOV words with increasing amounts of automatic correction of the training data.

Relative perplexity change on sentences with one or more OOV words with increasing amounts of automatic correction of the training data.

This lower predictability of unknown words after correction of the training data is perhaps not that important in practice. In a text entry interface, these OOV words are probably going to be hard to recognize anyway. Nonetheless, the overall impact of automatic correction was fairly small. Even with the largest threshold of 1000 and on the test data without OOV words, automatic correction only improved the average perplexity from 172.3 to 170.0. It is unlikely such a small perplexity difference would result in measurable improvements in a text entry interface. As such, we will continue to simply train on the original uncorrected training text.
4.7 Pruning to reduce model size
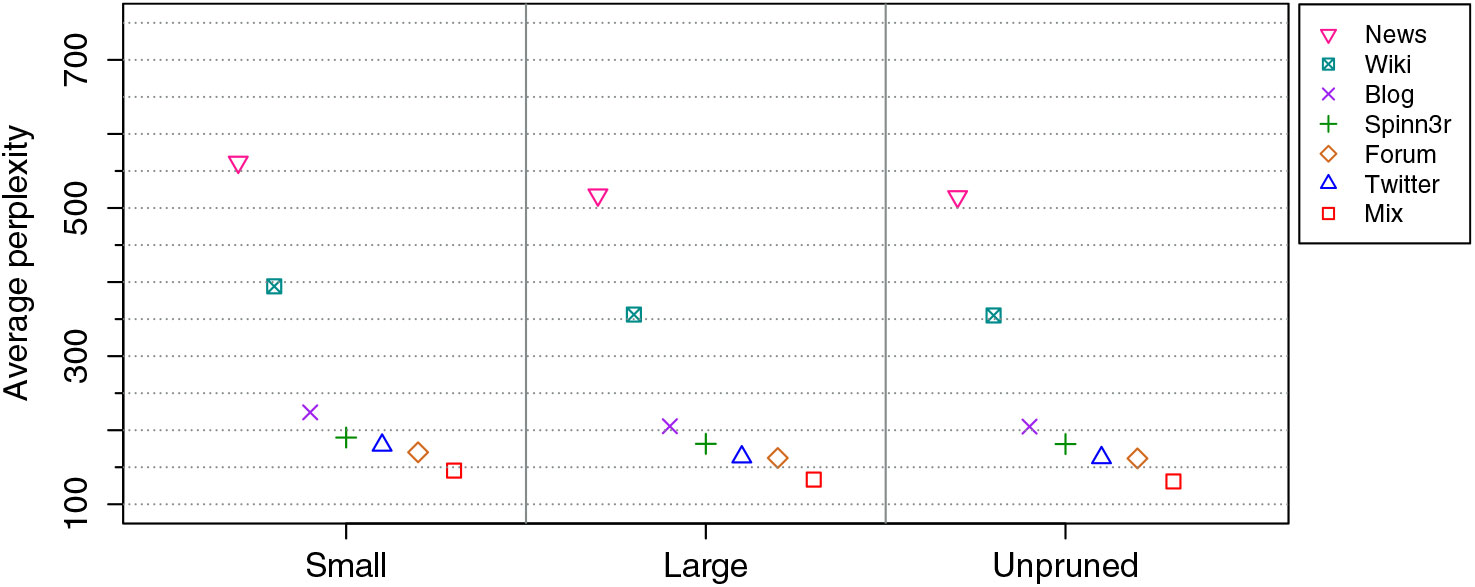
Our 3-gram mixture model was large with 160 M parameters and a compressed disk size of 1.2 GB. This is probably too large for deployment on most current mobile devices. We entropy pruned our Mix model to create a small model with approximately 5 M parameters (40 MB compressed size) and a large model with approximately 50 M parameters (400 MB compressed size). For comparison, we created Forum, News, Blog, Wiki, Spinn3r, and Twitter models with similar numbers of parameters.
Figure 7 shows the average perplexity on our four evaluation test sets for small, large, and unpruned models. Compared to unpruned models, the large models had a small 0.5% relative increase in perplexity (averaged across all models). The more heavily pruned small models had a more substantial increase of 9% relative. Using out-of-domain data was quite detrimental; News and Wiki had a perplexity several times that of Mix. Notably, the small Mix model outperformed all models trained on other data sources, even much larger unpruned models.
Perplexity of 3-gram language models using different amounts of pruning to reduce model size. Results are the average on the four evaluation test sets.

5. Touchscreen keyboard experiments
We previously found the specific data and training regimen were important for optimizing a language model for mobile text entry. Thus far, we have used perplexity to measure the “goodness” of our models. Perplexity is a popular metric for selecting language models for use in recognition-based text entry systems, in particular speech recognition (Chen, Beeferman, and Rosenfeld Reference Chen, Beeferman and Rosenfeld1998). However, as demonstrated by Chen et al. (Reference Chen, Beeferman and Rosenfeld1998), the usefulness of perplexity as a metric for language model evaluation may sometimes be limited. In this section, we investigate the practical impact of our perplexity improvements with respect to the current de facto mobile text input method: tapping on a touchscreen keyboard. We explore the impact with respect to the keyboard’s recognition accuracy as well as to the keyboard’s ability to propose correct word predictions.
5.1 Touchscreen typing test set
Previously, we investigated various aspects of touchscreen keyboard entry using a research decoder named VelociTap (Vertanen et al. Reference Vertanen, Memmi, Emge, Reyal and Kristensson2015). VelociTap decodes a sequence of noisy touch data using both a letter and a word language model. In Vertanen et al. (Reference Vertanen, Memmi, Emge, Reyal and Kristensson2015), users entered an entire sentence prior to having their input recognized. This is similar to how keyboards from Google and Apple allow users to enter several words without any spaces. The multiple words are then recognized and separated with spaces once the user hits the spacebar key.
For our experiments here, we wanted to perform recognition after each word of input. We think this more closely matches what users are currently doing in practice on their mobile devices. Further, it allows us to investigate the impact of different language models on the accuracy of word predictions. Word predictions often appear at the top of a virtual keyboard and allow users to enter a word without typing every letter. But since only a limited number of word predictions can be displayed on a predictive keyboard, we wondered whether our improved language models would result in measurable improvements despite a small number of prediction slots.
We converted the sentence-at-a-time input data from Vertanen et al. (Reference Vertanen, Memmi, Emge, Reyal and Kristensson2015) to word-at-a-time data. This was done by force-aligning the known reference text of a sentence with the noisy tap observations. This segmented each sentence observation sequence into separate subsequences for each word. In cases where the number of inferred words differed from the reference, we dropped the sentence. This could occur because participants may have entered the wrong number of words, or if the recognizer erroneously converted a single word of input into several words. We dropped 744 sentences due to alignment issues (9% of the data). While it is possible some of the dropped data constituted more challenging input cases, our purpose here is to compare different language models on real-world tap observations and not to precisely measure the absolute recognition error rate.
The participants in Vertanen et al. (Reference Vertanen, Memmi, Emge, Reyal and Kristensson2015) entered sentences from the Enron mobile dataset (Vertanen and Kristensson Reference Vertanen and Kristensson2011b). Participants used a single finger to tap out sentences on a iPhone 4 or Nexus 4 device with a full-sized portrait virtual keyboard (5360 sentences). We also included data from two conditions of the last experiment that involved reduced-sized keyboards (1828 sentences). The resulting data totaled 7188 sentences entered by 111 participants.
To add even more challenging data, we also force-aligned the data from Vertanen et al. (Reference Vertanen, Fletcher, Gaines, Gould and Kristensson2018). In this study, participants typed sentences on a Sony SmartWatch 3. Input was performed one word, two words, or an entire sentence-at-a-time. This data totaled 1066 sentences entered by 24 participants. In the majority of this data, participants entered sentences from the Enron mobile dataset (830 sentences). We also included data from the composition condition (236 sentences). For purposes of measuring error rate, we obtained a reference text for each composition via a crowdsourced judging process (Vertanen and Kristensson Reference Vertanen and Kristensson2014).
Combining the data from both studies resulted in a test set of 8254 sentences (48 K words) entered by 135 different users. We found that 0.20% of the words in the test set were OOV with respect to our 64K vocabulary. Under the Large word and character mixture language models (to be described in Section 5.6), the reference text of this set of 8254 sentences had a per-word perplexity of 142.6 and a per-character perplexity of 2.83.
5.2 Decoder and experimental procedure
We conducted offline experiments by playing back the x- and y-locations of participants’ taps and recognizing these sequences using VelociTap configured with different language models. VelociTap requires both a character and a word language model. For the character models, we trained 12-gram language models. To reduce memory during training, we pruned singleton 11- and 12-grams. We used the same training sets previously described for the word language models. We used interpolated Witten–Bell smoothing for the character models. All word models in this section were 3-gram language models. The number of parameters and disk size reported in this section reflect the sum for both the letter and word models.
We ran two separate types of experiments. In the recognition only experiments, we simulated word-at-a-time input without word predictions. In this case, we assumed we knew with certainty the boundaries between the words in a sentence’s tap sequence. We performed recognition on the taps for each word. The recognition result was then added to a running result. This running result was used as left context for recognition of the next word. This simulates a user that did not correct any recognition errors.
In the word prediction experiments, we simulated adding word predictions to the keyboard. Such a keyboard proposes words that complete the current word being typed, hopefully saving a user some typing. The same noisy tap data was used as for the recognition-only experiments. We adapted our decoder to search for the most likely word predictions given the current noisy tap input thus far for a word.
After each simulated tap, we determined the most likely word predictions as follows. First, as usual, VelociTap scored the current noisy prefix tap sequence using a two-dimensional Gaussian keyboard model. It further allowed characters to be inserted or deleted via configurable insertion and deletion penalties. This yielded a set of possible recognition hypotheses for a user’s currently entered prefix. These hypotheses were then extended, searching for sequences of characters leading to a word in our 64 K vocabulary. The probabilities of these hypotheses were adjusted based on each letter added using the character language model. After an ending space character was added, the probability of the complete word under the word language model was also incorporated.
We simulated a keyboard that offered up to three word predictions. Word predictions were made even before the first letter of a word was typed. If a correct prediction was made, we assumed a single keystroke completed the word and added any following space. The first prediction in a sentence used a sentence start pseudo-word as left context for the language models.
The tap observations in our data are noisy since users may have tapped keys inaccurately. Thus, it is possible our simulation might never propose a correct word prediction. In such cases, we added the top recognized word for purposes of the language model’s left context. This simulates the keyboard having to make later predictions in a sentence based on previous incorrect text.
5.3 Metrics
We measured recognition accuracy using character error rate (CER). We calculated CER by first finding the number of character insertions, deletions, or substitutions required to transform the recognized text into the reference text, that is, the Levenshtein distance (Reference Levenshtein1966). The CER is then found by dividing this distance by the number of characters in the reference. We also measured the word error rate (WER). WER is analogous to CER but on a word basis. CER and WER are typically expressed as percentages. Note our approach weights insertions, deletions, and substitutions all the same. It is also possible to use different weights as is sometimes done when evaluating speech recognizers (Hunt Reference Hunt1990). Further, other types of errors can be modeled such as transposition of adjacent characters as in the Damerau–Levenshtein distance metric (Brill and Moore Reference Brill and Moore2000).
To provide a measure of the recognition performance differential of our different language models, we calculated sentence-wise bootstrap 95% confidence intervals for the mean of our reported recognition metrics (Bisani and Ney Reference Bisani and Ney2004). We use this approach as comparing different recognition setups on the same data violates assumptions of traditional hypothesis tests. This is a long-standing problem in speech recognition (Gillick and Cox Reference Gillick and Cox1989; Strik, Cucchiarini and Kessens Reference Strik, Cucchiarini and Kessens2001) and machine translation (Koehn Reference Koehn2004).
We evaluated the word predictions using keystroke savings (KS):
 \begin{equation*}
KS=\left( 1 - \frac{k_p} {k_a} \right) \times100\%,
\end{equation*}
where kp is the keystrokes required with word predictions and ka is the keystrokes required without predictions. Higher KS are better. We calculated KS on each sentence and report the average overall sentences.
As previously mentioned, in some cases, a correct word prediction may not be made. Thus for the word prediction experiments, we also reported the CER of the final result. This provides a measure of how close a user could get to their intended text by tapping letters and making optimal use of word predictions but without using other correction features (e.g. backspacing errors or selecting from a recognition n-best list).
5.4 Type of training data
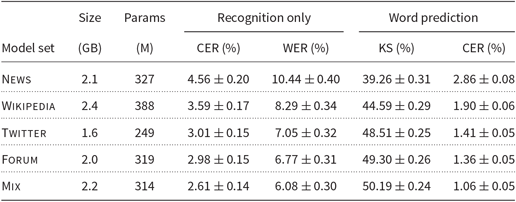
We combined our NonMobile and Mobile training sets to create a single training set denoted Forum. We trained word and character language models on 128 M words of training data from the News, Wikipedia, Twitter, and Forum sets. We also trained a mixture model (denoted Mix) using a total of 128 M of data using 32 M words from each of the Forum, Twitter, Spinn3r, and Blog sets. All models were trained without count cutoffs and were not entropy pruned.
As shown in Table 13, the domain mismatch of the News and Wikipedia training data caused significantly higher error rates. Compared to our mixture model, a model trained only on news articles saw a 75% relative increase in CER while a model trained only on Wikipedia data resulted in a 38% relative increase. In the past, such data sources were commonly used to train language model-based text input methods. Our results demonstrate how suboptimal this is when used for recognizing mobile text.
The size and performance of models trained on 128 M words of data. KS = keystroke savings, CER = character error rate, WER = word error rate. ± values denote sentence-wise bootstrap 95% confidence intervals

Notably, the Twitter model was nearly as accurate as the Forum model. Further, the Twitter model had the smallest disk footprint and a smaller number of parameters. This is an interesting finding. People building models for mobile text input should consider leveraging the huge amounts of Twitter data as a first priority. We conjecture the concise nature of tweets makes them similar in style to the text commonly written on mobile devices.
Having diversity of training data sources also appears to be important. As shown in the final row of Table 13, the Mix model that leveraged the Forum, Twitter, Blog, and Spinn3r data outperformed all other models by a healthy margin. By carefully selecting and combining multiple training sources, our Mix model reduced CER by 43% relative compared to the News model. Further, when used in a keyboard with word predictions, the Mix model reduced the final CER of the simulated user’s text by 63% relative compared to the News model.
5.5 Amount of training data
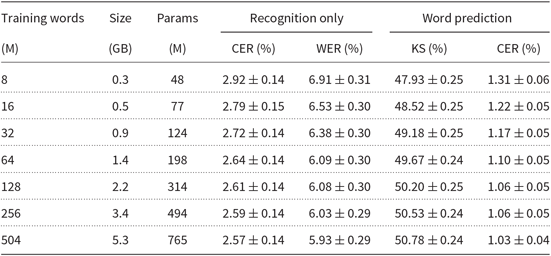
Next, we tested varying the amount of training data. We tested the Mix model as it performed the best in the previous experiment. We trained mixture models using 2–126 M words of data from each of the mixture model’s four training sources. This resulted in models trained on a total of 8–504 M words.
As shown in Table 14, the more data that was used for training, the more accurate the model. However, gains diminished as training data reached hundreds of millions of words. Comparing Tables 13 and 14, it is apparent that the type and diversity of training data is more critical than the total amount of training data. Even the smallest mixture model trained on only 8 M total words had a lower CER compared to a Twitter model trained on 128 M words.
The size and performance of mixture models varying the amount of training data

5.6 Model pruning
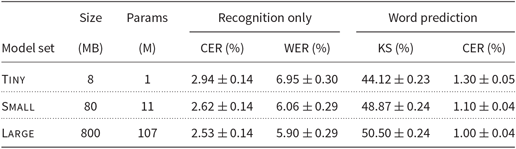
The best-performing models thus far are probably too big for use on a mobile device. While recognition can be performed in the cloud, for privacy and latency reasons, recognition on-device may be preferred. We entropy pruned the character and word mixture models trained on 504 M words of data. We chose pruning thresholds to yield three compressed disk sizes. We created Tiny models (approximately 4 MB each), Small models (approximately 40 MB each), and Large models (approximately 400 MB each). These sizes were chosen to roughly correspond to feasible sizes for deployment on a smartwatch, a mobile phone, and a desktop computer.
As shown in Table 15, the more heavily pruned models were less accurate. But it is remarkable how much the models could be pruned while still retaining acceptable accuracy. Even the Tiny models had a CER below 3% when recognizing noisy word-at-time touchscreen input. The Tiny models had a lower CER and WER than the unpruned Twitter models despite being 195 times smaller. However, the KS of the Tiny models were much lower than almost all other models. This suggests aggressive pruning is negatively impacting the model’s ability to fill in relevant words in the keyboard’s three prediction slots.
The size and performance of pruned mixture models

The Small and Large models had a CER and WER on par with the unpruned mixture model trained on 504 M words of data. Only small improvements in accuracy were seen going from the Small to the Large models. This suggests performing recognition on a reasonably capable mobile devices can be nearly as accurate as relaying to a cloud server.
KS of the Small and Large models were higher than Tiny, but still lower than the unpruned mixture model trained on 504 M words of data. While pruning had minimal impact on recognition CER, it once again caused word predictions to be less accurate. Overall, the pruning experiments further demonstrate the strength of training language models on a mixture of well-matched text.
5.7 Word predictions
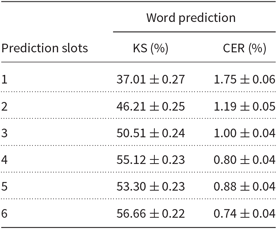
We did an additional experiment on the performance of the word predictions using just the Large pruned model set. How many prediction slots to offer is an important design decision as increasing the number of slots consumes both screen real estate and the visual attention of users. Thus far, we have simulated a keyboard with three prediction slots. As shown in Table 16, providing more prediction slots markedly improved KS and recognition accuracy. It appears that providing at least three prediction slots is advisable not only to save keystrokes, but also to help users avoid decoding errors resulting from inaccurate typing.
The performance of the LARGE pruned model set using different number of prediction slots. ± values denote sentence-wise bootstrap 95% confidence intervals

Analyzing in more detail just the keyboard with three word predictions, the system had a KS of 50.5%. It also reduced the CER to 1.0%, less than half the error rate of simulating a keyboard without word predictions. In 3% of the total words, no correct word predictions were made during the input of the entire word. In these cases, the system had to resort to using the 1-best recognition result instead. Of these cases, only 7% constituted entry of OOV words. Thus, the primary problem appears to be making accurate in-vocabulary predictions.
For the Large models, 52% of word predictions were selected from the first slot, 30% from the second slot, and 19% from the third slot. We also looked at when predictions were made; 37% were made after zero characters, 31% after one character, 16% after two characters, 11% after three characters, and 5% after four or more characters.
6. Discussion
We have described how we collected large amounts of mobile text from the web. This allowed us to analyze differences between the text resulting from mobile and non-mobile text entry methods. It also served as training data for building high-performance language models optimized for mobile text entry. We now reflect on the six contributions to text entry research we set out to make.
6.1 Contributions
Method for harvesting genuine mobile text
A long-standing problem in studying mobile text entry has been sourcing authentic text written by real users on actual mobile devices. In the past, we used an approach similar to the one in this paper by looking for the default signature put at the end of emails written by Enron employees on their Blackberry mobile devices (Vertanen and Kristensson Reference Vertanen and Kristensson2011b). But this past effort yielded relatively small amounts of text from one type of mobile device over a fixed period in time.
Our web mining approach allows researchers to continually collect large quantities of mobile text from a wide variety of mobile devices. Compared to static sources of mobile text, our approach provides a continuous and dynamic window into mobile texting. For example, our approach allows a system to continually update itself to better model users’ evolving mobile writing styles and topics. This could be done by periodically retraining a language model using the latest version of the mined dataset. Further, our approach allows researchers to analyze changing user behaviors, for example, studying how often people use emojis or hashtags.
Improved understanding of mobile text entry
By being able to analyze large amounts of data, we were able to reliably measure even small differences in text entry behavior between mobile and non-mobile use. A person using a mobile device does seem to write more concisely. We found sentences in our mobile forum data had on average 11.0 words compared to 12.4 in the non-mobile Spinn3r forum data. The mobile device itself also appears to influence behavior—phone users wrote 30 words per post compared to tablet users who wrote 40 words per post.
When investigating in detail the individual characters users wrote, we found mobile users tended to more frequently use emoticons and texting language, but used fewer commas. This demonstrates how the differing affordances offered by mobile and desktop text entry methods influence users’ writing. While we had expected mobile text might exhibit an increased tendency to be in lowercase, our data did not show this. This could mean mobile text entry methods are providing good support for manual or automatic casing. It could also mean, even while mobile, users are willing to spend the effort necessary to properly capitalize their posts.
Analysis of mobile spelling and typing errors
Knowing what types of errors users frequently make while entering text on a mobile device may help us design improved mobile text entry methods. We found evidence that mobile users are accidentally hitting adjacent keys and that these errors were not always being corrected. Transposition errors seemed to occur less frequently in the mobile data. This could be because mobile users are mostly entering text with a single finger, or it could be mobile text entry methods are better at correcting such errors compared to desktop keyboards.
We conjectured correcting likely errors in our mined data would result in better training data for language models. We found that our automatic correction algorithm did not reliably improve predictions on our different types of test data. In particular, it appears that while correction improved predictions for sentences without OOV words, it negatively impacted sentences with OOV words. Further, even when predictions improved, the gains were small. Thus, while our algorithm helped explore the kinds of errors in users’ final text, at present we recommend simply training on the data without attempting to automatically correct likely errors.
Investigating the impact of training source on modeling mobile text
Finding training data that is well-matched to the target domain is known to strongly impact language model performance (Moore and Lewis Reference Moore and Lewis2010; Vertanen and Kristensson Reference Vertanen and Kristensson2011a). We demonstrated that text mined with mobile signatures could be usefully combined in a mixture model with other sources such as Twitter to provide substantial performance gains. In particular, we showed traditional training sources, such as newswire text is suboptimal for modeling mobile text. While large amounts of newswire data are available and the data is “clean” (i.e. containing few spelling or typing mistakes), it is a poor substitute for having even relatively small amounts of well-matched data from a variety of “unclean” web-based sources.
An interesting finding was that Twitter data provided performance on par with our mined forum data. This is good news as Twitter data is relatively easy to collect and, like web forum data, constitute a continuous and timely data source. That being said, we obtained our best results by creating a mixture model using our mined data, Twitter data, blog data, and from non-mobile forum data. Thus for robust modeling of mobile text, we recommend collecting large amounts of data from multiple well-matched but distinct data sources.
Touchscreen keyboard evaluation
Our mixture models consistently had lower perplexity on emails, forum posts, SMS messages, and tweets made on mobile devices. However, this does not necessarily guarantee practical gains if deployed in an actual mobile text entry interface. We explored whether lower perplexity translated into practical gains using 8254 sentences of noisy touchscreen phone and smartwatch data collected from 135 users. Our experiments confirmed that substantially more accurate recognition was possible using our mixture models. Further, our models allowed the keyboard to make more accurate word predictions. These improved word predictions allowed our simulated user to avoid many word recognition errors in the first place.
Training on large amounts of data results in language models that consume large amounts of storage and memory. However, we further demonstrated that the models could be successfully pruned to make deployment on mobile phones or even smartwatches possible. A notable finding was that while pruning tended not to impact the 1-best recognition result that much, pruning had a more damaging impact on word predictions. This suggests that the information being lost during model pruning is hindering the model’s ability to predict other likely options aside from the best one. As a guideline, we therefore suggest performing less aggressive model pruning when the text entry interface features word predictions or correction of recognition errors via an n-best list.
Resources for mobile text entry research
The data collection and language model comparisons in this work represent a substantial amount of human effort, bandwidth, processing power, and storage. We have released the sentences from our mined forum posts. We think this data will stimulate further research into the differences between mobile and non-mobile text. Further, we think many researchers can benefit from leveraging our language models when building their own novel text entry or natural language processing systems. As such, we have made a range of pre-trained language models available. We recommend using the pruned character and word language models from Table 15. The language models are provided in standard ARPA format. They can easily be incorporated into Java programs via BerkeleyLM (Pauls and Klein Reference Pauls and Klein2011) or C++ and Python programs via KenLM (Heafield Reference Heafield2011).
6.2 Limitations and future work
Our approach relies on the continued use of these forum mobile apps by users and that these apps continue to advertise via a default signature identifying the mobile device. At the time of writing, a Google search of “Sent from my iPhone using Tapatalk” returned 9.9 M results with many of the top results having been written recently. Thus, at least at present, our approach is an effective and relatively easy data collection methodology for genuine mobile text.
Processing large amounts of harvested data is challenging. There are numerous choices along the way, such as how many pages to use from a site, the threshold for identifying English, and the in-vocabulary word list. It would be impractical to exhaustively test each choice in isolation, or worse, the interaction between choices in concert. After each choice, substantial further processing is needed before a model emerges that could be used to measure performance. Our goal was to show a sensible set of choices yields models useful for probabilistic text entry. Honing the procedure we leave to future work.
While our mobile text collection is unique in its size and diversity, it is not perfect. While we are confident in the classification of data into mobile sets based on the device signature (users have little reason to fake a signature), we cannot tell the exact input method used. For example, users may have entered text using an on-screen keyboard, a gesture keyboard, speech recognition, or a Bluetooth keyboard.
Further our data undoubtedly contains auto-corrected versions of users’ input. These are all limitations of analyzing real-world data in the large rather than data from a much smaller logging study or lab experiment. Our analysis reveals how large numbers of users enter text in the real world, on their own mobile device, using the software/hardware input methods available to them. At the granularity of mobile device type, our results are still informative, for instance, a tablet user tends to write longer posts than a phone user. Whatever the input method, our data provides solid recognition gains on authentic mobile test data.
Related, we did not collect non-mobile data that could be conclusively verified as such. This is because non-mobile data lacks an identifying signature (“Sent from my desktop”). Text intended for private communication, such as text messages or private emails, was not captured by our web mining approach. Also due to the public nature of forums, text content such as email addresses was likely underrepresented. Besides email addresses, we speculate other types of content may also be underrepresented, for example, forum users may refer to each other by forum handle or first name rather than by full name. Further, forums are a public discussion venue focused on a particular topic while text messaging and email are often private exchanges being just two people. Thus, our data likely does not well model everyday discussions such as those that occur between family members or significant others. Our mining approach was based on finding forums where members were using a mobile forum app. Such users may be more technology literate than the average user of text messaging or email. This could lead to a greater proficiency at mobile text entry resulting in differences versus the population in general.
We focused on classic n-gram models which have long-dominated language modeling research (Rosenfeld Reference Rosenfeld2000). Recently, recurrent neural network language models (RNNLMs) have been shown to provide state-of-the-art performance on a variety of tasks (Mikolov et al. Reference Mikolov, Karafiát, Burget, Cernocký and Khudanpur2010; Kombrink et al. Reference Kombrink, Mikolov, Karafiát and Burget2011; Yao et al. Reference Yao, Zweig, Hwang, Shi and Yu2013; Devlin et al. Reference Devlin, Zbib, Huang, Lamar, Schwartz and Makhoul2014; De Mulder, Bethard, and Moens Reference De Mulder, Bethard and Moens2015). Our focus here was on the advantage of well-matched training data, something that would likely benefit RNNLMs as well. Further, RNNLMs are often mixed with n-gram models to further improve performance (Mikolov et al. Reference Mikolov, Karafiát, Burget, Cernocký and Khudanpur2010, Reference Mikolov, Deoras, Kombrink, Burget and Cernocký2011). Our best performing n-gram model was a mixture model created by linearly interpolating models trained separately on each of our diverse training sets. The interpolation weights were optimized with respect to development data. A single RNNLM may be able to learn to balance the importance of the different text domains implicitly in its hidden layers. This would simplify the training process, but we conjecture training on diverse text would likely remain important. This should be validated in future work.
Our experiments show clearly the advantage of carefully curating the data used to train a language model for use in a recognition-based text entry interface. However, our experiments assumed a static model that was independent of a particular user. In the real world, adapting on a user’s prior entries may improve performance (Fowler et al. Reference Fowler, Partridge, Chelba, Bi, Ouyang and Zhai2015). It would be interesting to see how language model adaptation affects performance in concert with how the initial training data is sourced.
Our web mining approach should be seen as a complementary methodology to logging. Logging users’ behavior in experiments enables researchers to collect small sets of mobile text data with timing and other information. In contrast, the approach we have presented enables researchers to collect large sets of mobile text data, but without such additional fine-grained information. We believe both approaches are useful for text entry research and we hope the text entry community will benefit by analyzing the many sentences available on the web that were written by mobile users “in the wild.” While we focused on English, it would be interesting to explore how mobile text entry is similar or different in other languages. Our mining and analysis approaches should be easily adaptable to others languages provided the languages have sufficient online forum data with identifying signatures.
7. Conclusions
We have presented a method for mining the web for text entered on mobile devices. Using crawling, parsing, and searching techniques, we located millions of words that could be reliably identified as having originated from a list of 300 mobile devices. By analyzing data on a per device basis, we compared text characteristics of text written using different device types, such as touchscreen phones, phones with physical keyboards, and tablet devices.
We designed an algorithm for detecting eight classes of spelling and typing errors. This allowed us to compare the relative prevalence of different types of errors on data typed on different kinds of mobile devices. Using our web-mined data, we trained long-span language models and showed that a mixture model trained on our mined data, Twitter, blog, and forum data predicted mobile text better than commonly used baseline models created from newswire or Wikipedia text.
Our current collection of mobile forum text was among the best data we have found for building high-quality language models for mobile text entry. What is even better is that there is a persistently growing amount of mobile text data on the web that could be mined and incorporated to provide further improvements. Twitter data was competitive with mobile forum data. This is a helpful finding as Twitter data is easy to collect, large in scale, and continually growing.
We obtained the best performance by incorporating data from four different web sources in a mixture language model. We demonstrated that careful attention to the training data source translated into actual performance benefits for a state-of-the-art touchscreen keyboard. To stimulate further work, we have made our mined data and a range of language models available to other researchers. Footnote 5
Acknowledgements
This material is based upon work supported by the National Science Foundation under Grant No. IIS-1750193. P.O.K. was supported in part by EPSRC grant EP/N014278/1.