Implications
Several single nucleotide polymorphisms (SNPs) were associated with live-weight, dry matter intake, body condition score and milk yield in a dataset combining data from research herds in four countries. In regions with significant SNP, potential candidate genes were identified for biological processes linked to taste and smell, a gene linked to the essential amino acid tryptophan that is involved with feeding motivation, as well as genes linked to regulation of insulin or epidermal growth factor.
Introduction
There has been long running interest in how feed intake and feed efficiency should be taken into account in breeding decisions (see Veerkamp, Reference Veerkamp1998). Quantitative genetic studies have shown that genetic variation exists among animals in the feed utilisation complex, and in its component traits (e.g. feed intake, milk production and body weight; Veerkamp et al., Reference Veerkamp, Oldenbroek, van der Gaast and van der Werf2000; Berry et al., Reference Berry, Horan, O'Donovan, Buckley, Kennedy, McEvoy and Dillon2007). Feed intake, as a trait, was initially targeted in breeding programs to try to reduce the quantity of feed required per unit of production, that is, improving feed efficiency. However, in the past two decades, interest has shifted towards the role of feed intake and its relationship with energy balance (EB), health and fertility. This shift in interest arose from the fact that current genetic selection for yield increases feed intake, but also results in a more negative energy balance (NEB) and more body tissue mobilisation during lactation (see Veerkamp et al., Reference Veerkamp, Emmans, Oldham and Simm1993; Dillon et al., Reference Dillon, Berry, Evans, Buckley and Horan2006). As demonstrated by the size and direction of the genetic correlation between milk yield and feed intake and by the negative genetic correlation between milk yield and measures of EB, live-weight (LW; change) and body condition score (BCS; Veerkamp et al., Reference Veerkamp, Beerda and van der Lende2003), the expected correlated response in feed intake from selection on yield alone cannot cover the extra requirements needed for the increased yield. More recently, genetic selection for improvement in the feed utilisation complex has received increased interest as a means of reducing methane emission of dairy cows (Wall et al., Reference Wall, Simm and Moran2010).
Despite the reoccurring need to include the feed utilisation complex in dairy cattle breeding goals (i.e. improving feed efficiency, maintaining EB and/or reducing methane emission), there is, as yet, no direct selection practiced. This is primarily because of the large resource demand of measuring individual feed intake in dairy cows. This makes routine selection in breeding programmes too difficult, but also means that studies that estimated genetic parameters for the feed utilisation complex in dairy cows have generally been confined to a small number of animals from research herds (Svendsen et al., Reference Svendsen, Skipenes and Mao1994; Veerkamp et al., Reference Veerkamp, Oldenbroek, van der Gaast and van der Werf2000; Berry et al., Reference Berry, Horan, O'Donovan, Buckley, Kennedy, McEvoy and Dillon2007). As a result, there has been considerable interest in predictors of the feed utilisation complex, like, for example, BCS (Koenen et al., Reference Koenen, Veerkamp, Dobbelaar and De Jong2001; Banos et al., Reference Banos, Brotherstone and Coffey2004; Dal Zotto et al., Reference Dal Zotto, De Marchi, Dalvit, Cassandro, Gallo, Carnier and Bittante2007), or other predictors of body energy state (Coffey et al., Reference Coffey, Simm, Hill and Brotherstone2003). However, studies with actual feed intake measures tend to have few animals recorded, which makes it difficult to establish the driving sources of genetic variation in feed efficiency (see Veerkamp et al., Reference Veerkamp, Emmans, Oldham and Simm1993; Veerkamp, Reference Veerkamp2002) and optimal selection strategies due to lack of reliable genetic parameters.
Recent developments in genotyping technology have provided an alternative method of selection, in which DNA information is used. This would allow relatively cheap selection, compared with progeny testing for feed intake. Few studies have looked at the individual gene level for explaining genetic variation in feed intake. Examples are leptin, growth hormone or DGAT1 (Liefers et al., Reference Liefers, te Pas, Veerkamp and van der Lende2002; Liefers et al., Reference Liefers, Veerkamp, Pas, Delavaud, Chilliard, Platje and van der Lende2005; Banos et al., Reference Banos, Woolliams, Woodward, Forbes and Coffey2008; Oikonomou et al., Reference Oikonomou, Angelopoulou, Arsenos, Zygoyiannis and Banos2009), but the recent availability of fast-throughput genotyping platforms with dense genome-wide markers has reduced the cost of genotyping considerably, making whole-genome association studies a viable alternative. Potentially, functional processes and (quantitative trait loci) QTL that underlie the genetic variation in the feed utilisation complex might be identified. Nevertheless, accurate phenotypes on large numbers of animals and available in one dataset is the limiting factor in such association studies. To overcome this limitation, in this study we collated cow genotypic and phenotypic information from research herds in Ireland, the United Kingdom, the Netherlands and Sweden and related genetic markers across the genome to the phenotypes for the feed utilisation complex using a Bayesian Stochastic Search Variable Selection (BSSVS) statistical approach. The objective of this study was to identify putative genes and functional processes at gene level that might be involved in genetic variation in the feed utilisation complex. Fat–protein corrected milk yield is an important component of the feed utilisation complex, but has been given relatively little attention in this study, as much larger datasets are available in national programs.
Material and methods
The data used in the present study originated from Teagasc, Moorepark, Ireland; the Langhill herd from Scottish Agricultural College, United Kingdom; two herds of Wageningen UR Livestock Research (NBZ and GEN), the Netherlands and the Jälla herd of the Swedish University of Agricultural Science. A detailed description of the experimental treatments imposed on the animals in the different countries is provided elsewhere, for Scotland (Veerkamp et al., Reference Veerkamp, Simm and Oldham1995; Pryce et al., Reference Pryce, Nielsen, Veerkamp and Simm1999; Coffey et al., Reference Coffey, Simm, Oldham, Hill and Brotherstone2004), Ireland (Horan et al., Reference Horan, Dillon, Berry, O'Connor and Rath2005), Sweden (Petersson et al., Reference Petersson, Strandberg, Gustafsson and Berglund2006), the Netherlands (Veerkamp et al., Reference Veerkamp, Oldenbroek, van der Gaast and van der Werf2000; Beerda et al., Reference Beerda, Ouweltjes, Sebek, Windig and Veerkamp2007), and a more detailed description of the merging of the data sources and variance components across the different herds is given by Banos et al. (Reference Banos, Coffey, Veerkamp, Berry and Wall2012). The analyses by Banos et al. (Reference Banos, Coffey, Veerkamp, Berry and Wall2012) illustrated the benefits of combining data across herds, and therefore the Swedish data were added in this study to increase the number of records for milk yield.
Phenotypic data
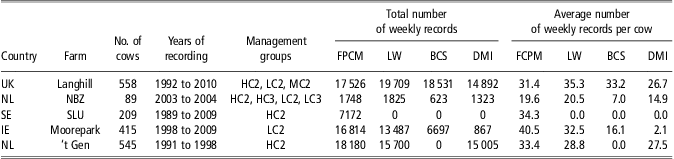
Originally, phenotypic data were available on 2031 Irish, 1018 United Kingdom, 725 Dutch and 225 Swedish Holstein–Friesian cows. However, for this study only first lactation records were selected (Table 1), resulting in 1804 first lactation Holstein–Friesian cows with 66 116 test-day records collected up to 45 weeks (315 days) in lactation. Recorded traits were milk, fat and protein yield, LW, BCS, dry matter intake (DMI) and fat and protein corrected milk yield (FPCM). Extreme values for these traits (comprising <1%) were excluded from further analysis, criteria used were for milk yield between 1 and 70 kg/day, with fat and protein yield >0.025 kg/day, LW had a minimum value of 100 kg and DMI of 1 kg/day. A description of data recording systems and frequency of measurements on each farm is described in detail by Banos et al. (Reference Banos, Coffey, Veerkamp, Berry and Wall2012). Data originated from different herds with different management and different frequencies of data recording and phenotypic data were pre-adjusted for management effects. For this purpose, a test-day model was fitted with a random permanent environmental animal effect as a sixth order polynomial (no genetic relationships included), a fixed effect for the mean lactation curve (fourth order polynomial) and a deviation of this mean curve for 10 management groups generated as an interaction between farm, nutritional treatment and milking frequency (2× or 3× daily) combinations. Specific time-dependent random effects were fitted for year-month of milk test by management group (353 levels) and a specific treatment effect was fitted for experimental treatments during lactation for the cows in Ireland (81 levels). The model was fitted in ASReml (Gilmour et al., Reference Gilmour, Cullis, Welham and Thompson2009) and used to predict a full lactation curve for each cow. The average LW, BCS, DMI and FPCM of the predicted values for weeks 3 to 15 were used in the further analysis, for all animals with 10 or more observations in this period in the dataset. This period was chosen to maximise the number of cows with sufficient feed intake records, as a substantial proportion of the Dutch feed intake data used here was recorded till 100 days in milk only.
The total number of cows with records, years of recording, management groups (HC, MC and LC, respectively; twice or three times a day milking (2 or 3, respectively), total number of weekly records for FPCM, LW, BCS and DMI separately and average number of weekly records for each cow per trait used in the pre-adjustment procedure
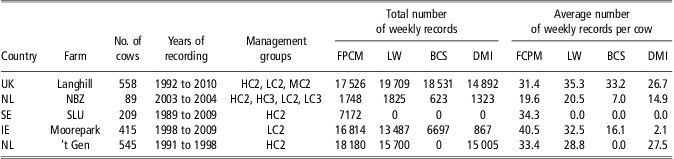
HC = high; MC = medium concentrate; LC = low concentrate; FPCM = fat and protein corrected milk; LW = live-weight; BCS = body condition score; DMI = dry matter intake; UK = United Kingdom; NL = the Netherlands; SE = Sweden; IE = Ireland.
Genotypic data
All animals with phenotypic information were genotyped with the Illumina BovineSNP50 BeadChip (Illumina Inc., San Diego, CA, USA) containing 54 001 single nucleotide polymorphisms (SNPs). SNPs that fulfilled the following criteria were included in the association study: (1) GenCall (GC)score >0.20 and GenTrain (GT)score >0.55; (2) call rate >0.95%; (3) minor allele frequency >0.01 in each country; and (4) no extreme deviation from Hardy–Weinberg Equilibrium (i.e. χ 2 < 600). The GCscore and GTscore are quality measures on the genotype calls from the genotyping assay. After the quality control edits 37 590 SNPs remained. Checks for Mendelian inconsistencies between pedigree and SNP data were performed for all genotyped parent–offspring pairs and among sibs and animals with suspected erroneous pedigrees were removed (Calus et al., Reference Calus, Mulder and Bastiaansen2011). After these edits, 1629 animals with phenotypes and genotypes remained in the data. Missing SNPs were imputed using Beagle (Browning and Browning, Reference Browning and Browning2007). When chromosome number and location of a SNP is presented in this study, these are on the BovineSNP50 from UMD3.0 bovine genome assembly from the University of Maryland as provided by Illumina (July 2010; Illumina Inc.). To identify functional genes in proximity of the SNP, the R package BioMart (Haider et al., Reference Haider, Ballester, Smedley, Zhang, Rice and Kasprzyk2009) was used based on the provided position on BTAU_4.0 (http://www.ensembl.org, Btau_4.0; April 2010). The package DAVID was used to cluster genes on functional process or gene function and to test whether certain processes and function were overrepresented around the significant genes (Huang et al., Reference Huang, Sherman and Lempicki2009b).
Linkage disequilibrium (LD)
The persistency of the LD across the genome for different subpopulations is important for the power of the genome-wide association study. Following de Roos et al. (Reference de Roos, Hayes, Spelman and Goddard2008), persistency of LD (r 2 and r) were investigated for nine subpopulations in the complete dataset. The UK animals were split into the Langhill selection and control line animals (UKS and UKC), in the Netherlands there were three groups being NBZ herd, and the selected and not selected animals at the GEN herd (GENS and GENC), the Swedish (SLU) and Irish animals (TEA) formed one group each, and also the genotypes of 344 sires were used as an additional group (BULLS). It is important to note that all Irish animals were of North American ancestry. For each group, r and r 2 were calculated between all neighbouring SNP pairs following Hill and Robertson (Reference Hill and Robertson1986). The correlation between populations for r was calculated across all marker distances. The decay in r 2 with marker distance was investigated by sorting on the distance between the neighbouring SNPs and taking the average r 2 and marker distance for bins of 50 SNPs. The average r 2 and distance were plotted and smoothed with a Loess Curve (smoothing parameter = 2/3) for each group. Pairs of SNPs closer together than 20 kbp were ignored, as many of these pairs had extremely low r 2. Finally, to quantify the decay in r 2 with distance between the pairs, it was assumed that r 2 ≈ 1/(4Nec + 1), where Ne is the effective population size and c is the distance in Morgan (Sved, Reference Sved1971). The combined parameter Nec was estimated for each group using the nonlinear least-squares (‘nls’) in the R package ‘stats’, which enabled to compare Ne between the groups at a given genetic distance, albeit it is a very approximate estimate of the real Ne.
Variance component estimation
Genetic and residual (co)variances for the four traits defined above (LW, BCS, DMI and FPCM) were estimated using animal linear mixed models in ASReml (Gilmour et al., Reference Gilmour, Cullis, Welham and Thompson2009). No fixed effects were included in the model because pre-adjustments of the data were made before analysis. Pedigree information on each genotyped animal was traced back as far as possible; a total of 9368 identities over 19 generations were included in the pedigree file.
Genome-wide association analysis
The BSSVS model (described by Verbyla et al., Reference Verbyla, Calus, Mulder, de Haas and Veerkamp2010) was used to sample whether SNPs were linked to a QTL or not. The model used was
 $${{y}_i}\, = \,\mu \, + \,{{a}_i}\, + \,\mathop{\sum}\limits_{j\, = \,1}^n {\mathop{\sum}\limits_{k\, = \,1}^2 {SN{{P}_{ijk}}\, + \,{{e}_i}} } $$
where yi is the phenotypic record of animal i, μ is the overall mean, ai is the random polygenic effect of animal i, n is number of SNP markers, SNPijk is a random effect for allele k at locus j of animal i and ei is a random residual for animal i. SNP effects (SNPijk) were estimated as qijk × vj (Meuwissen and Goddard, Reference Meuwissen and Goddard2004), where qijk is the size of the effect of allele k at locus j and vj is a scaling factor for locus j. The vectors a and e where assumed to be normally distributed, a ~N(0, Aσu 2) and e~ N(0, Iσe 2), where A is the numerator relationship matrix and I is an identity matrix.
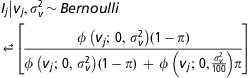
An indicator variable Ij was introduced into the hierarchical model to allow for scenarios where a limited number of SNPs with large effects exist and for other scenarios where a large number of SNPs all had an infinitely small effect (the infinitesimal model). This indicator variable takes a value of 1 or 0, depending on whether the SNP was included with a large effect in the model or not. The QTL-indicator Ij was sampled from
 $${& {{I}_j}\left| {{{v}_j},\sigma _{v}^{2} } \right.\,{\rm{\sim }}\,Bernoulli \cr
\zrLarr \left[ {\frac{{\phi \,\left( {{{v}_j};\,0,\,\sigma _{v}^{2} } \right)(1\,{\rm{ - }}\,\pi )}}{{\phi \,\left( {{{v}_j};\,0,\,\sigma _{v}^{2} } \right)(1\,{\rm{ - }}\,\pi )\, + \,\phi \,\left( {{{v}_j};\,0,\frac{{\sigma _{v}^{2} }}{{100}}} \right)\pi }}} \right] \cr}$$
where π is the probability that Ij is unequal to 1, which follows a Bernoulli distribution. The probability that vj is sampled from the distribution with large effects is  $ \phi \,\left( {{{v}_j};\,0,\,\sigma _{v}^{2} } \right$ with variance
 $ \sigma _{v}^{2} <$><!--$$ and mean 0. The prior QTL probability (1 − π) used in the analyses had a value of 0.00027, reflecting the prior assumption that 10 QTL come from the distribution with large effects. This is equivalent to fixing π at a value of 0.99973, which is the term commonly used for BayesB type models to denote the proportion of SNPs that are not included in the model and therefore have zero effect, whereas for BSSVS it defines the proportion of loci with effects sampled from the distribution with small effects. The posterior distribution of Ij showed the proportion that the effects for locus j were sampled from the distribution with large effects, across all cycles after the burn-in. SNPs with the highest posterior probability were expected to be most likely linked to a QTL. A more detailed description of the model is given by Calus and Veerkamp (Reference Calus and Veerkamp2011).
The estimated variance components from the quantitative genetic analysis were used to infer prior variances for the BSSVS model to estimate SNP effects. The BSSVS model was performed using Gibbs sampling, each time the model was run for 50 000 cycles with 10 000 cycles discarded for burn-in. For the prior QTL variance it was assumed that 80% of the genetic variance was explained by the SNPs and the remaining 20% by the polygenic component in the model. This division was based upon 80% of the total additive variance to be explained by the Bovine50 beadchip used in this study (Daetwyler, Reference Daetwyler2009). The 80% of the genetic variance explained by the SNP was split again across 10 SNPs sampled from the distribution with a large effect and the remaining 37 580 SNPs were sampled from the distribution with small effect (i.e. with a SNP variance that is one hundred times smaller than the variances for a SNP with a large effect). Each trait was analysed with five different Gibbs chains of 50 000 cycles and average results of the five chains were used in the further study.
A SNP was assumed to be significant if the Bayes factor (BF; Kass and Raftery, Reference Kass and Raftery1995) was ⩾3.1, which is termed a ‘substantial’ effect. The BF was calculated for each SNP by
 $$BF\, = \,\frac{{Pr({{H}_1}|y)}}{{{\rm{1}}\,{\rm{ - }}\,Pr({{H}_1}|y)}}\, \div \,\frac{{Pr({{H}_1})}}{{{\rm{1}}\,{\rm{ - }}\,Pr({{H}_1})}}$$
where H 1 is the hypothesis that the marker is linked to a QTL, Pr(H 1|y) is the posterior probability of a QTL being present and Pr(H 1) is the prior probability of a QTL being present, (1 − Pr(H 1|y)) and (1 − Pr(H 1)) represent the posterior and prior probability for the alternative hypothesis, respectively. As many SNPs are closely linked and different sets of SNPs might give an equivalent good fit to the data in different chains, the sum of the posterior and prior QTL probabilities of a window of 10 SNPs (a SNP plus its closest neighbours) was also used. Using these summed probabilities might reveal regions with QTL that would be missed otherwise.
The genetic variance of trait i was calculated for each SNP k separately:
 $$\sigma {{^{\prime}}_{ik}}^{2} \, = \,2{{p}_k}{{q}_k}\,\times \,a_{{ik}}^{2} $$
where aik is the allele substitution effect of SNP k on trait I, pk is the frequency of the minor allele of SNP k and qk is the frequency of the major allele of SNP k, both obtained from the genotypes. The sum of the variances of all SNPs for trait i was taken as the total genetic variance explained by the SNPs for trait i.
Results
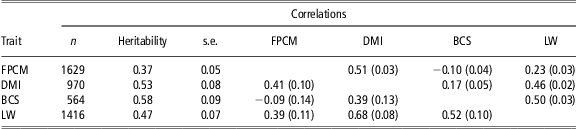
In the entire dataset, 1629 lactations remained (Table 2) after the selection criteria of at least 10 records up to week 15. For BCS mainly records from the UK Langhill herd complied with this criteria, as well as DMI records of the Netherlands and the United Kingdom. Heritability estimates of the four traits were between 0.37 and 0.58. Genetic correlations were of the same sign as their respective phenotypic correlation, but generally stronger (Table 2).
Number of cows (n) and estimated heritability, with its standard error (s.e.) per trait, and the genetic (below diagonal; standard errors in parenthesis) and phenotypic (above diagonal; standard errors in parenthesis) correlations among the traits
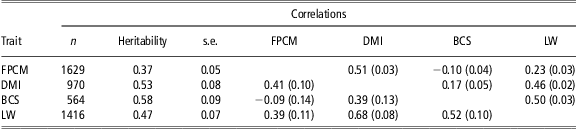
FPCM = fat and protein corrected milk; LW = live-weight; BCS = body condition score; DMI = dry matter intake.
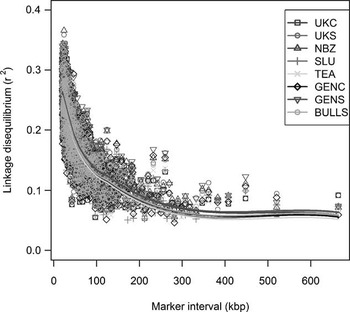
The correlations between r across the genome were 0.95 and 0.97 between seven of the eight cow populations, and between 0.97 and 0.99 with the group of sires. The Langhill control line was somewhat different and r had a correlation of 0.92 with the other cow populations and of 0.95 with the group of sires. The decay in r 2 was similar between the lines (Figure 1), and the combined Nec parameter was estimated to be 0.107, 0.100, 0.100, 0.107, 0.107, 0.105, 0.100 and 0.105 for Langhill selection and control line (UKC and UKS), NBZ herd, SLU herd, Teagasc herd, the selected and control GEN herd and the group sires, respectively. These Nec values gave equivalent decay curves for each group, and indicated that Ne of the different subpopulations ranged from 12 462 to 13 344 at average marker distance of 0.08 cMorgans (623 generations ago).
Linkage disequilibrium (LD; r 2) as a function of interval between neighbouring markers for nine different groups: Langhill control and selection line (UKC and UKS), NBZ herd in the Netherlands, SLU herd in Sweden, Teagasc herd in Ireland (TEA), the selected and control herd in the Netherlands (GENS and GENC) and a group of 334 sires of these animals (BULLS).

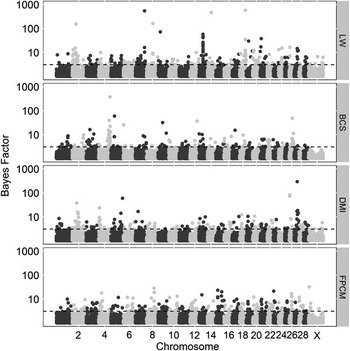
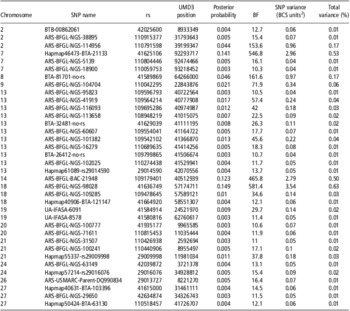
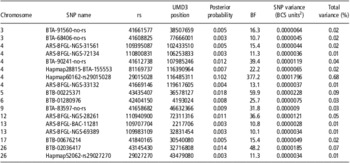
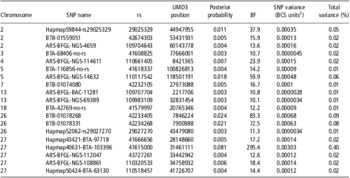
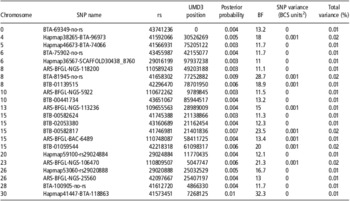
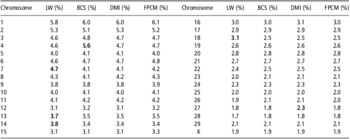
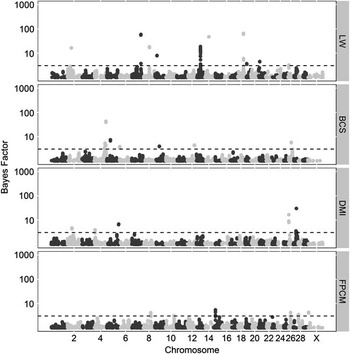
Across all four traits investigated, 872 SNPs of 37 590 SNPs had a BF >3.1 for at least one trait (Figure 2), whereas 266, 178, 206 and 254 SNPs had a BF >3.1 for LW, BCS, DMI and FPCM, respectively. The number of SNPs with a BF >10 was 36, 18, 19, 22 for LW (Table 3), BCS (Table 4), DMI (Table 5) and FPCM (Table 6), respectively. Using the probabilities across a window of 10 SNPs, in total 300 regions remained significant and 113, 81, 57 and 49 SNPs had a BF above 3.1 for LW, BCS, DMI and FPCM, respectively (Figure 3). The variation explained by the SNPs on each chromosome was related to the size of the chromosome and was relatively consistent for each trait (Table 7), with the possible exceptions of BTA4 for BCS, BTA7, BTA13, BTA14, BTA18 for LW and BTA27 for DMI.
Bayes factor (BF) corresponding to the posterior quantitative trait loci probabilities for each individual single nucleotide polymorphism, from top to bottom, for live-weight (LW), body condition score (BCS), dry matter intake (DMI) and fat and protein corrected milk yield (FPCM) for each of the autosomes from left (BTA1) to right (BTA29) and the X-chromosome at the far right. Dashed lines indicate BF 3.1.

SNPs that explained most genetic variation for LW with a BF >10 with position on the genome, the posterior probability that the SNP effect is sampled from the distribution with a large effect, the significance (BF) and the variance explained by the single SNP

SNP = single nucleotide polymorphism; LW = live-weight; BF = Bayes factor; BCS = body condition score.
SNPs that explained most genetic variation for BCS with a BF >10 with position on the genome, the posterior probability that the SNP effect is sampled from the distribution with a large effect, the significance (BF) and the variance explained by the single SNP

SNP = single nucleotide polymorphism; BF = Bayes factor; BCS = body condition score.
SNPs that explained most genetic variation for DMI with a BF >10 with position on the genome, the posterior probability that the SNP effect is sampled from the distribution with a large effect, the significance (BF) and the variance explained by the single SNP

SNP = single nucleotide polymorphism; DMI = dry matter intake; BF = Bayes factor; BCS = body condition score.
SNPs that explained most genetic variation for FPCM with a BF >10 with position on the genome, the posterior probability that the SNP effect is sampled from the distribution with a large effect, the significance (BF) and the variance explained by the single SNP

SNP = single nucleotide polymorphism; FPCM = fat and protein corrected milk; BF = Bayes factor; BCS = body condition score.
Percentage of total SNP variance† of LW, BCS, DMI and FPCM explained by SNPs on each chromosome

SNP = single nucleotide polymorphism; LW = live-weight; BCS = body condition score; DMI = dry matter intake; FPCM = fat and protein corrected milk.
†1.4% of the genetic variance was explained by SNPs not mapped to chromosomes yet.
Posterior Bayes factor (BF) corresponding to the posterior quantitative trait loci probabilities for a window of 10 neighbouring single nucleotide polymorphisms, from top to bottom, for live-weight (LW), body condition score (BCS), dry matter intake (DMI) and fat and protein corrected milk yield (FPCM) for each of the autosomes from left (BTA1) to right (BTA29) and the X-chromosome at the far right. Dashed lines indicate BF 3.1.

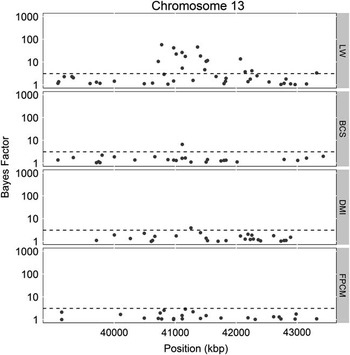
For LW the largest individual BF was on BTA18, BTA7 and BTA14 (Table 3), explaining 0.63%, 0.53% and 0.50% of the total genetic variance explained by SNPs, respectively. All 36 SNPs with a BF >10 explained 2.5% of the genetic variation. Furthermore, four SNPs at BTA13 each explained 0.02% or more of the genetic variance in LW and several other SNPs in close proximity to BTA13 were also associated with LW (Figure 4).
Bayes factor (BF) corresponding to the posterior quantitative trait loci probabilities for single nucleotide polymorphism with BF >1 on a region of chromosome 13 (BTA13) for live-weight (LW), body condition score (BCS), dry matter intake (DMI) and fat and protein corrected milk yield (FPCM). Dashed lines indicate BF 3.1.

A SNP on BTA4 explained 0.68% of the genetic variance in BCS and all 18 SNPs with a BF >10 explained, in total, 1.2% of the genetic variation in BCS (Table 4). For DMI, one SNP on BTA27 explained 0.4% of the genetic variance (Table 5) with several SNPs on predominantly BTA2, BTA26 and BTA27 also explaining genetic variation in DMI. The 19 SNPs with a BF >10 explained 0.8% of the genetic variation.
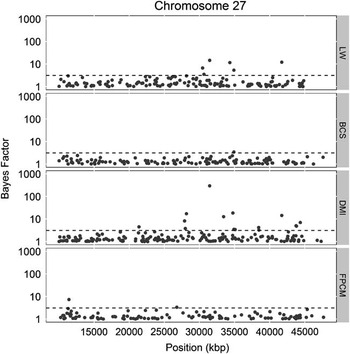
Of the 872 SNPs associated (i.e. BF >3.1) with at least one of the phenotypes investigated, 31 were associated with two traits and 1 was associated with three traits. This SNP was ARS-BFGL-NGS-71055 on chromosome 27 (34904207 bp) affecting LW, DMI and BCS (Figure 6).
Bayes factor (BF) corresponding to the posterior quantitative trait loci probabilities for single nucleotide polymorphism with BF >1 on a region of chromosome 27 (BTA 27) for live-weight (LW), body condition score (BCS), dry matter intake (DMI), and fat and protein corrected milk yield (FPCM). Dashed lines indicate BF 3.1.

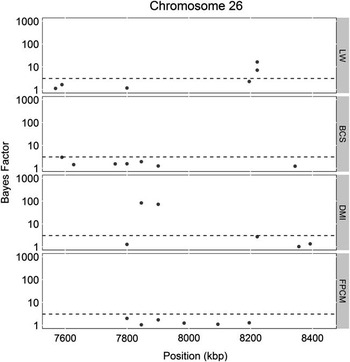
On BTA2, one SNP explained 0.17% of the genetic variance in LW (BF of 153.6) and 0.01% of the genetic variance in DMI (BF of 6.0). Two SNPs in the middle of the putative QTL region on BTA13 for LW (Figure 4) had a BF >3.1 for BCS and DMI as well. Similarly, SNPs associated with LW were in close proximity to the putative QTL region for BCS on BTA26 (Figure 5), and on BTA27 several SNPs were associated (i.e. BF >3.1) with FPCM, DMI, LW and BCS (Figure 6).
Bayes factor (BF) corresponding to the posterior quantitative trait loci probabilities for single nucleotide polymorphism with BF >1 on a region of chromosome 26 (BTA 26) for live-weight (LW), body condition score (BCS), dry matter intake (DMI) and fat and protein corrected milk yield (FPCM). Dashed lines indicate BF 3.1.

Discussion
Genetic variation
The heritability estimates of 0.37 to 0.58 are similar to the estimates previously reported for these traits (Koenen and Veerkamp, Reference Koenen and Veerkamp1998; Berry et al., Reference Berry, Buckley, Dillon, Evans, Rath and Veerkamp2003). The increased DMI for heavier animals and animals that yield more milk is expected and agrees with previous studies as does the phenotypic and genetic correlations of 0.50 to 0.52 between BCS and LW (Berry et al., Reference Berry, Buckley, Dillon, Evans, Rath and Veerkamp2002). The general pattern that the genetic variance explained by SNPs on each chromosome decreases with the decreasing size of the chromosome is consistent with a polygenic model. Exceptions to this general rule that genetic variance explained by SNPs is related to the size of the chromosome are BTA7, BTA13, BTA14 and BTA18 for LW, BTA4 for BCS and BTA27 for DMI. These chromosomes explain more variance than expected in the case that variance were uniformly distributed across the genome.
The chromosomes that explain more genetic variance than expected relative to their size are also the chromosomes with most significant SNPs for these traits. Nevertheless, SNPs explained only a small proportion of the overall variance. With a maximum of 0.7% of the variance explained by a single SNP, it is expected that thousands of QTL are required to explain the full variance and the effect is smaller than is expected given the power of the experiment. An explanation for the small proportion of variance explained by each SNP might be that all SNPs were fitted simultaneously in the model and in comparison with single SNP analysis, this might have reduced the total variance explained by each SNP. There might not be enough discriminant power in the data to separate the SNPs close together, as several SNPs are expected to be in LD with each other, and the effects of the same QTL will be distributed across several SNPs. In addition, the average SNP effects across five chains were taken to avoid a single SNP being highly significant in one chain, but the effect being attributed to a neighbouring SNP in subsequent chain. The effect of several SNPs in close proximity of each other explaining each a little of the genetic variance is, for example, illustrated by the SNPs associated with LW on BTA13 (Figures 2 and 4). At the same time on BTA14 one SNP associated with LW was found, whereas no other neighbouring SNPs were found. However, this SNP explained only 0.5% of the variance, suggesting that the most likely scenario is that many mutations, all with a relatively small effect, explain the total genetic variance for LW, DMI and BCS.
Functional processes relating to SNPs associated with DMI, LW and BCS
In total, 728 genes and 500 unique genes were found within 500 kbp flanking the SNPs associated with LW, DMI or BCS using BioMart (Haider et al., Reference Haider, Ballester, Smedley, Zhang, Rice and Kasprzyk2009). Fourteen of these genes were present in proximity of the SNPs associated with both LW and DMI, and 27 in proximity of the SNPs associated with both BCS and DMI. Clustering the 500 genes on gene function (Huang et al., Reference Huang, Sherman and Lempicki2009a) showed that three gene groups were overrepresented. The first gene group (enrichment score 5.66) contained 16 genes involved with kallikrein, peptidase and trypsin. The second gene group contained five genes involved with cystan (enrichment score 1.86) and, interestingly, the third group contained 32 olfactory, taste receptor and pheromone receptor genes. The latter suggests that smell and taste genes play an important role in the feed intake complex. When clustered on functional process, peptidase activity, epidermal growth factor (EGF)-like sensory smell, olfactory and catabolic processes were enriched.
Clustering was also performed for each of the genes associated to each trait separately. When the 227 genes close to the SNPs for BCS were clustered, the group of 16 olfactory genes remained enriched (score 2.40), but one cluster also contained the trypsin-related genes. Clustering the 111 genes in proximity of the SNPs associated with DMI gave one enriched group with zinc finger and ADAM metallopeptidase genes. Functionally, clustering gave a group with EGF-like processes, and a cluster with leptin-type processes, zinc- and iron-binding processes and peptidase. For the trait LW, 11 genes out of 257 were clustered for the kallikrein-related peptidase (enrichment 4.66) and cystatin (enrichment 1.65). Nevertheless, most of these processes have very general functions, and it is difficult to anticipate any direct target for application apart from perhaps the olfactory genes and sensory smell process that might indicate the importance of genetic variation in the genes affecting taste and smell for the feed intake complex of dairy cows.
Candidate genes affecting DMI, LW and BCS
Several candidate genes have been investigated in cattle. For example, the leptin gene on BTA4 (Van der Lende et al., Reference Van der Lende, Te Pas, Veerkamp and Liefers2005; Banos et al., Reference Banos, Woolliams, Woodward, Forbes and Coffey2008), LEPR on BTA3 (Liefers et al., Reference Liefers, Veerkamp, Pas, Delavaud, Chilliard, Platje and van der Lende2005; Banos et al., Reference Banos, Woolliams, Woodward, Forbes and Coffey2008), SCD on BTA26 (Macciotta et al., Reference Macciotta, Mele, Conte, Serra, Cassandro, Dal Zotto, Borlino, Pagnacco and Secchiari2008), PGF on BTA10 (Seidenspinner et al., Reference Seidenspinner, Tetens, Habier, Bennewitz and Thaller2011), SPP1 on BTA6 (Sheehy et al., Reference Sheehy, Riley, Raadsma, Williamson and Wynn2009), GH on BTA19 (Mullen et al., Reference Mullen, Berry, Howard, Diskin, Lynch, Berkowicz, Magee, MacHugh and Waters2010) and GHR on BTA20 (Banos et al., Reference Banos, Woolliams, Woodward, Forbes and Coffey2008; Waters et al., Reference Waters, McCabe, Howard, Giblin, Magee, MacHugh and Berry2011). For all these candidate genes we looked at the groups of SNPs positioned surrounding these genes. However, no strong associations (BF >10) were found for the SNPs in the vicinity of these genes. This does not exclude that these genes play a role in the genetic variation for these traits, but the Bayesian variable selection method used here did not select any of these surrounding segregating SNPs. This might be because the effect is explained by many SNPs in LD with the important SNPs within these genes, or the SNPs used here are not in strong LD with functional SNPs. Therefore, for each of the traits new candidate genes were investigated by focussing first on the 22 SNPs that were identified with BF >3.1 and that were located in known genes (http://www.ensembl.org, Btau_4.0; April 2010) and second by identifying the genes around the SNPs with an extreme effect (BF >50).
For LW, seven SNPs had a BF >50, of which three SNPs had a very strong association (BF >460) and explained close to 0.5% of the genetic variation. The first SNP on BTA18 (ARS-BFGL-NGS-98028) is located in the syt3 gene. This gene is from a family of genes that are known to affect the exocytosis of insulin that in turn influences plasma insulin levels (Gauthier and Wollheim, Reference Gauthier and Wollheim2008). In this gene, a putative QTL for LW was identified before in a beef F2 population (MacNeil and Grosz, Reference MacNeil and Grosz2002). Interestingly, ARS-BFGL-NGS-38895 on BTA2 was also associated with LW, and within 5 kbp of this SNP the gene GRB14 was found. This gene encodes a growth factor receptor-binding protein that interacts with insulin receptors and IGF receptors and may play a role in signalling pathways that regulate growth and metabolism. The second SNP with a strong association with LW was located on BTA7 (Hapmap46473-BTA-21133) and is located in the gene CETN3. The third SNP (ARS-BFGL-BAC-21948) with a very strong association (BF >460) was not located in a gene. Of the four other SNPs associated to LW with BF >50, only BTA-81701-no-rs was located in anks6 on BTA8.
For BCS, three SNPs with a large effect were located in known genes: BTB-00225371 on BTA5 (BF >59) in TMEM117 and, the two SNPs on BTA4 (ARS-BFGL-NGS-33132 and ARS-BFGL-NGS-31561) were mapped to genes Ptprn2 and CREB3L2.
For DMI, three SNPs were mapped on genes: BTB-01074080 was mapped on MEGF10, ARS-BFGL-NGS-108861 was mapped on IDO2 and Hapmap59844-rs29025329 was mapped on N-myc (and STAT) interactor. IDO2 might be an interesting candidate gene. The gene IDO2 plays an important role in tryptophan metabolism. Tryptophan is an essential amino acid that cannot be produced in the body. For that reason, tryptophan is well investigated and linked to feed intake in humans (Wolfe et al., Reference Wolfe, Metzger and Stollar1997), cattle (Choung and Chamberlain, Reference Choung and Chamberlain1992), mice (Coskun et al., Reference Coskun, Ozer, Gonul, Take and Erdogan2006) and pigs (Montgomery et al., Reference Montgomery, Flux and Greenway1980). As discussed by Koopmans et al. (Reference Koopmans, Guzik, van der Meulen, Dekker, Kogut, Kerr and Southern2006), tryptophan serves as the immediate precursor to serotonergic activity in the brain, and has been implicated in the regulation of many behavioural and physiological processes such as mood, aggression, susceptibility to stress, sleep patterns, but also the regulation of feed intake. Hence, IDO2 on BTA27 might be an ideal candidate gene to affect DMI.
Another set of candidate genes for DMI might be those involved in EGFs and transforming growth factors. The MEGF10 gene, in which a SNP that was associated with DMI was identified, clustered on function with three others genes that were in proximity to the significant SNPs (enrichment score 2.04). The three genes were ADAM2 on BTA27 (within 500 kbp of ARS-BFGL-NGS-108861 that was associated with DMI and within 5 kbp of ARS-BFGL-NGS-29650 that was associated with LW), ADAM3A on BTA27 (within 50 kbp of ARS-BFGL-NGS-29650 that was associated with LW) and NRG1 on BTA27 (close to Hapmap43421-BTA-97718 that was associated with DMI). EGFs are involved in cell recognition and division (Campbell et al., Reference Campbell, Baron, Cooke, Dudgeon, Fallon, Harvey and Tappin1990), and functional analysis suggest that these set of genes played a role in lean and obese mice (Fuller et al., Reference Fuller, Ghazalpour, Aten, Drake, Lusis and Horvath2007).
Overall a few new candidate genes have been identified for the feed intake complex. These candidate genes are linked to insulin, EGF and tryptophan.
Conclusion
Genome-wide association study of data collected across five experimental herds identified 872 SNPs associated with DMI, BCS, LW and FPCM. The genetic variance in each trait explained by the SNPs on a chromosome was generally proportional to the size of the chromosome. Next to genes involved in some general processes, the olfactory genes and genes involved with sensory smell processes appeared to be present in the region of 500 kbp of the significant SNP(s). Potential candidate genes, based on function of the gene and location of a significant SNP in a gene, were linked to insulin, EGF and tryptophan.
Acknowledgements
Ina Hulsegge, Dirkjan Schokker and Mari Smits are acknowledged for their invaluable help with the bioinformatics analysis. This study is part of the RobustMilk project (http://www.robustmilk.eu), which is financially supported by the European Commission under the Seventh Research Framework Programme, Grant Agreement KBBE-211708. The content of this paper is the sole responsibility of the authors, and it does not necessarily represent the views of the Commission or its services. Scottish government is recognised for continued funding of the Langhill lines of dairy cattle.