1. Introduction
The genetic code is protected from photo-induced damage by the extremely short, sub-picosecond excited state lifetimes of the nucleobases. Although this is highly advantageous to life, it is a considerable inconvenience to biophysical science because it has the inevitable consequence that DNA is essentially non-fluorescent. This means that fluorescence techniques, among the most powerful for the study of biomolecular systems, can only be applied to nucleic acids by the introduction of an extrinsic fluorophore into the molecular structure. 2-aminopurine (2AP) is one such fluorophore and is exceptional in its structural similarity to a natural nucleobase. 2AP differs from adenine (6-aminopurine) only in the position of the exocyclic amine group, and yet its fluorescence intensity is one thousand times that of adenine.
It is important at this point to make the distinction between a fluorescent label and a fluorescent probe. A fluorescent label serves to confer detectable fluorescence on an otherwise non-fluorescent species, or to provide fluorescence in a spectral region that differs from the intrinsic fluorescence of the species. A fluorescent probe, on the other hand, reports on its local molecular environment through a change in its fluorescence properties (intensity/lifetime/wavelength) in response to interaction with this environment. 2AP is not valuable as a fluorescent label because its fluorescence is highly quenched by stacking with the natural bases, when it is inserted in an oligonucleotide. However, it is this very susceptibility to interbase quenching that makes 2AP an exquisitely sensitive fluorescent probe of nucleic acid structure. Fluorescent base analogues that are environmentally insensitive labels, valuable in techniques such as Förster resonance energy transfer (FRET) and fluorescence anisotropy, have been reviewed recently (Wilhelmsson, Reference Wilhelmsson2010) and will not be discussed here.
Using solid-phase synthesis and phosphoramidite chemistry, 2AP can be substituted for a natural base at any selected position in an oligonucleotide. The introduction of 2AP into DNA, in this fashion, causes minimal disturbance to the duplex structure. Melting temperatures of single-2AP-substituted duplexes are in the range 3–10 °C (average about 5–7 °C) less than the unsubstituted duplex (Eritja et al. Reference Eritja, Kaplan, Mhaskar, Sowers, Petruska and Goodman1986; Nordlund et al. Reference Nordlund, Andersson, Nilsson, Rigler, Graeslund and Mclaughlin1989; Xu et al. Reference Xu, Evans and Nordlund1994). 2AP forms a Watson–Crick base-pair with thymine (T), as shown by NMR spectroscopy (Sowers et al. Reference Sowers, Fazakerley, Eritja, Kaplan and Goodman1986) and revealed clearly by X-ray crystallography, as illustrated by the structure in Fig. 1. It forms a wobble base-pair with cytosine (C) (Neely et al. Reference Neely, Daujotyte, Grazulis, Magennis, Dryden, Klimasauskas and Jones2005; Sowers et al. Reference Sowers, Boulard and Fazakerley2000) or adenine (A) (Fazakerley et al. Reference Fazakerley, Sowers, Eritja, Kaplan and Goodman1987) and can form a Hoogsteen-type base-pair with guanine (G), as shown by the X-ray structure in Fig. 2 (Neely et al. Reference Neely, Daujotyte, Grazulis, Magennis, Dryden, Klimasauskas and Jones2005). Spectroscopic and calorimetric measurements indicate the base-pair stability to be 2AP-T> 2AP-C > 2AP-A > 2AP-G (Law et al. Reference Law, Eritja, Goodman and Breslauer1996). The effects of substitution of adenine by 2AP on duplex structure and base-pair dynamics have been examined in detail in a recent NMR study (Dallmann et al. Reference Dallmann, Dehmel, Peters, Mügge, Griesinger, Tuma and Ernsting2010). It was found that substitution of adenine by 2AP in the central base-pair of 13mer duplex did not affect the overall helical structure; slight local conformational perturbations at the substitution site were seen but these are weak compared with those reported for other base or base-pair analogues (Engman et al. Reference Engman, Sandin, Osborne, Brown, Billeter, Lincoln, Norden, Albinsson and Wilhelmsson2004; Guckian et al. Reference Guckian, Krugh and Kool1998, Reference Guckian, Krugh and Kool2000; Smirnov, Reference Smirnov2002). In agreement with previous studies (Lycksell et al. Reference Lycksell, Gräslund, Claesens, Mclaughlin, Larsson and Rigler1987) the lifetime of the 2AP–T base-pair was found to be significantly shorter that of the A–T base-pair, 1·6 ms compared with 8 ms. Moreover, a cooperative effect on base dynamics was observed, with lifetimes of three adjacent base pairs in either direction reduced by about 30% by the substitution of 2AP for A. Although introduction of 2AP is not entirely without structural repercussions, an overriding, crucially important fact is that 2AP-substituted oligonucleotides are biologically active as substrates for enzymes that modify DNA.
Details from the crystal structure of a duplex (PDB ID: 4IHX) showing the Watson–Crick base-pair formed between 2AP and T. (The lone oxygen atoms (red) in the image indicate the presence of water molecules). Figure generated using Pymol 0·99.

Details from the crystal structure of a duplex (PDB ID: 2C7Q) in which 2AP is base-paired with G, showing the hydrogen bonds between the paired bases. 2AP forms a Hoogsteen-type base-pair with G (the lone oxygen atom (red) in the image indicates the presence of a water molecule). Figure generated using Pymol 0·99.
In this review, we begin by considering the dramatic difference in photophysical properties between 2AP and its structural isomer, adenine, the origin of which has intrigued physical chemists and been widely studied by both experimentalists and theorists. Even if it had proved useless as a fluorescent probe, 2AP would still stand out as a paradigm of molecular photophysics! We then turn to the mechanism of interbase quenching of 2AP fluorescence in DNA which is the basis of its use as a conformational probe, but remains imperfectly understood.
There are hundreds of examples in the literature of the use of changes in the fluorescence intensity of 2AP as the basis of assays of conformational change in studies of DNA, and numerous, although fewer, examples of its use in studies of RNA. However, in this review we will consider in detail only a few intensity-based studies, in the context of base (nucleotide) flipping. In considering the applications of 2AP as a fluorescent probe, our main aim is to highlight the use of time-resolved fluorescence measurements, and the interpretation of fluorescence decay parameters, to explore the structure and dynamics of DNA and the perturbation and manipulation of the duplex structure by enzymes. In Section 3, we discuss the salient features of the fluorescence decay of 2AP when incorporated in DNA and review the use of decay measurements in studying duplexes, single strands and other structures. In Section 4, we survey the use of 2AP as a probe of DNA-enzyme interaction and enzyme-induced distortion. We focus particularly on its use to study base flipping by methyltransferases (and other enzymes), an area in which it has found extensive application. We highlight the enhanced mechanistic insights that can be gained by a detailed analysis of the decay parameters, rather than merely monitoring changes in fluorescence intensity.
The fluorescence decay measurements discussed in this review have been conducted mainly using the technique of time-correlated single photon counting (TCSPC), which is ideal for measurements in the range of ns down to tens of ps. However, there have been a few reports of ultrafast, pump–probe fluorescence decay measurements which can detect sub-picosecond lifetimes. These are discussed briefly in Section 5.
Finally, in conclusion, we reflect on the merits and shortcoming of 2AP, the prospects for its wider adoption as a fluorescence decay-based probe and whether ultrafast measurements offer significant added value.
2. Fluorescence properties and photophysics of 2-aminopurine
2.1 Intrinsic properties of the fluorophore
The fluorescence properties of 2AP (and a number of its derivatives) were first reported by Stryer and co-workers (Ward et al. Reference Ward, Reich and Stryer1969). 2AP has a quantum yield of 0·68 in aqueous solution, compared with ~10− 4 for adenine, and an emission maximum at ~370 nm. Importantly, its excitation maximum, at ~303 nm, lies to the red of the absorption of the nucleic bases and aromatic amino acids, allowing it to be excited selectively in DNA or RNA, and in the presence of proteins.
The fluorescence quantum yield of 2AP decreases markedly with decreasing polarity of the solvent environment (a fivefold reduction in dioxane relative to water), accompanied by shifts in the emission spectrum to shorter wavelength (Evans et al. Reference Evans, Xu, Kim and Nordlund1992; Rachofsky et al. Reference Rachofsky, Osman and Ross2001a; Ward et al. Reference Ward, Reich and Stryer1969). However, as shown by Rachofsky et al., the specific hydrogen bonding with water has negligible effect on the fluorescence quantum yield or emission wavelength. The sensitivity of fluorescence quantum yield to solvent polarity was suggested to be due to the participation of an nπ* state in the non-radiative decay of the emitting ππ* state, with the nπ* lying higher in energy in water, but being stabilized relative to the ππ* state in non-polar solvents (Rachofsky et al. Reference Rachofsky, Ross, Krauss and Osman2001b).
The striking difference in photophysical properties between 2AP and adenine has been the subject of numerous theoretical studies, as summarized by Serrano-Andres and co-workers (Serrano-Andres et al. Reference Serrano-Andres, Merchan and Borin2006). The currently accepted explanation of the non-fluorescence of adenine, proposed by these authors and others, is that ultrafast excited state decay occurs by internal conversion to the ground state, facilitated by barrierless relaxation from the initially excited 1ππ* state to a conical intersection between the excited and ground state potential energy surfaces (A conical intersection can be thought of as an energy funnel between two electronic states where the probability of non-adiabatic, non-radiative jumps is high.). Initial calculations of Serrano-Andres et al., on the isolated molecule (Serrano-Andres et al. Reference Serrano-Andres, Merchan and Borin2006) predicted that, although such a conical intersection exists in 2AP, it cannot be accessed rapidly from the initially excited state because of an intervening potential energy barrier; the ultrafast decay pathway is, therefore blocked, resulting in a relatively high fluorescence quantum yield. A subsequent computational study examined the effects of aqueous solvation (Ludwig et al. Reference Ludwig, Amaral, Da Costa, Borin, Canuto and Serrano-Andrés2008) and predicted that hydration increases the height of the barrier to the conical intersection, in line with the experimentally observed increase in quantum yield in polar solutions. It was concluded that the photophysics of 2AP was governed by the accessibility of the conical intersection with the ground state and, contrary to previous proposals, the 1nπ* state did not play an important role, since it was found to be higher in energy than the 1ππ* state. However, this picture was soon to be challenged by new experimental data.
The important influence of solvation on the fluorescence of 2AP was emphatically demonstrated by the recent revelation that 2AP is barely fluorescent in the gas phase (Feng et al. Reference Feng, Engler, Seefeld and Kleinermanns2009; Lobsiger et al. Reference Lobsiger, Sinha, Trachsel and Leutwyler2011). These high-resolution spectroscopic studies of 2AP molecules, free from collisions and cooled to a few Kelvin in supersonic molecular beams, showed the fluorescence lifetime of the isolated molecule to be 77 ps, corresponding to a quantum yield of about 0·005. They also provided clear evidence that the main non-radiative channel is the decay to a close-lying 1nπ* dark state (a state which is neither emissive nor accessible by direct optical excitation), followed by intersystem crossing to the long-lived lowest triplet (3ππ*) state. This led to reiteration of the proposal that the fluorescence quantum yield is high in polar solvents because the 1nπ* state is shifted to higher energy, and a re-examination of the computational predictions. As discussed in detail by Lobsiger et al., the predicted relative energies of the 1ππ* and 1nπ* states depend on the computational method used (Feng et al. Reference Feng, Engler, Seefeld and Kleinermanns2009; Lobsiger et al. Reference Lobsiger, Sinha, Trachsel and Leutwyler2011). By adopting a method different from those used in previous studies, they achieved good agreement between the calculated and experimental excited state energies for the isolated molecule. Definitive experimental evidence for the effect of solvation on the relative energies of 1ππ* and 1nπ* states can be obtained, in principle, from high resolution spectroscopy of 2AP-solvent complexes in supersonic molecular beams. Although recent experiments (Lobsiger et al. Reference Lobsiger, Sinha and Leutwyler2013; Sinha et al. Reference Sinha, Lobsiger, Trachsel and Leutwyler2011) have demonstrated the ability to produce 2AP–H2O clusters, containing up to three water molecules, and identify their different isomeric forms, a detailed analysis of their energy-level structure has yet to be achieved.
A recent experimental study (Reichardt et al. Reference Reichardt, Wen, Vogt and Crespo-Hernandez2013) has shown for the first time the significant role of intersystem crossing in the fluorescence quenching of 2AP in solution. The triplet yield was found to depend sensitively on the hydrogen-bonding ability and polarity of the solvent, with a value of 0·4 in acetonitrile, decreasing to 0·2 in ethanol and 0·08 in aqueous buffer. This correlates with the increasing trend in fluorescence quantum yield: 0·26 in acetonitrile, 0·47 in ethanol and 0·68 in buffer. This lends strong support to the mechanism of nπ*-mediated intersystem crossing indicated by gas-phase studies. It can be inferred from the fluorescence and triplet quantum yields that there is a second solvent-independent non-radiative channel, with a yield of about 0·3; this is the most likely internal conversion from the 1ππ* state to the ground state.
Lobsiger et al. have reported very recently a remarkable demonstration of the effect of microhydration on the fluorescence lifetime of 2AP (Lobsiger et al. Reference Lobsiger, Blaser, Sinha, Frey and Leutwyler2014). Continuing their studies of 2AP–H2O clusters in supersonic molecular beams, they found that the fluorescence lifetime of isolated 2AP can be increased from 156 ps to 14·5 ns by solvation with a single water molecule. Moreover, the lifetime depends strongly on which of the three hydrogen-bonding sites around the 2AP fluorophore is occupied. The greatest increase in lifetime, 95 times, occurs when the water molecule forms a hydrogen-bonded bridge between the 2-amino group and the pyrimidine N1. If the H2O bridges from the 2-amino group to pyrimidine N3, only a ~30 times increase in lifetime is observed, and the effect is even smaller, about four times, for bridging of the water molecule between N3 and 9H. This leads to the dramatic conclusion that the local hydrogen bonding patterns of the first few solvent water molecules control the 2AP fluorescence lifetime. It is also shown that the lifetimes correlate with the computationally predicted energy difference between the 1ππ* and 1nπ* states, providing further evidence of the crucial role of the 1nπ* state in the non-radiative decay mechanism.
The fluorescence decay of the 2AP base in aqueous solution is often reported to be monoexponential, with a lifetime around 11·5 ns (Holmén et al. Reference Holmén, Nordén and Albinsson1997; Lakowicz, Reference Lakowicz2006; Rachofsky et al. Reference Rachofsky, Sowers, Hawkins, Balis, Laws and Ross1998, Reference Rachofsky, Osman and Ross2001a), and this is indeed the case for an individual decay curve measured at a particular excitation and emission wavelength. However, measurement over a range of excitation and emission wavelengths revealed that the decay is, in fact, biexponential, as a result of the presence of both the (minor) 7H and (major) 9H tautomers which differ slightly in their lifetimes and their spectra (He et al. Reference He, Duan and Li2006; Liang & Matsika, Reference Liang and Matsika2011; Neely et al. Reference Neely, Magennis, Dryden and Jones2004). The fluorescence decay of 2AP riboside, in which tautomerism is absent, is genuinely monoexponential with a lifetime of 10·6 ns in water (Neely et al. Reference Neely, Magennis, Dryden and Jones2004). In line with the observed decrease in quantum yield, the lifetime decreases in less polar solvents; in ethanol, for example, it is 5·8 ns. The substitution of hydrogen at the N(9) position by ribose or deoxyribose has negligible effect on the photophysics of the 2AP fluorophore (Reichardt et al. Reference Reichardt, Wen, Vogt and Crespo-Hernandez2013). The small discrepancies in the values of quantum yields and lifetimes between the free base and the nucleosides, found in the literature, can be accounted for by the presence of the 7H tautomer in the former case. Although tautomerism is not directly relevant to the photophysics of 2AP as a fluorescent probe, since it does not occur in the nucleoside, it reinforces the close analogy between 2AP and adenine.
Under conditions where there is a strong π-stacking interaction between a pair of 2AP molecules, or between 2AP and a natural base, a second longer-wavelength emission band is observed at around 450 nm, in addition to the familiar short-wavelength spectrum at 370 nm. This is due to the formation of an electronically coupled ground-state dimer, which has lower excitation energy than the 2AP monomer. The long-wavelength emission was first identified by Rist et al., in a DNA duplex containing four pairs of adjacent 2AP bases (Rist et al. Reference Rist, Wagenknecht and Fiebig2002). They observed a weak, red-shifted emission band, in addition to the ‘normal’ 2AP fluorescence spectrum, and a corresponding red-shifted excitation spectrum. In a study of the X-ray structure and fluorescence of crystalline 2AP, we showed that interaction between 2AP molecules in the π-stacked structure of the crystal lattice gave rise to analogous long-wavelength emission (Neely et al. Reference Neely, Magennis, Parsons and Jones2007). Subsequent examination of a variety of 2AP-containing oligodeoxynucleotide duplexes and single strands showed that dual fluorescence is a general property of 2AP in DNA (Bonnist & Jones, Reference Bonnist and Jones2008). We suggested that red-shifted fluorescence arises from conformational states of the duplex in which 2AP forms a highly eclipsed, π-stacked structure with one of its neighbouring bases. The long-wavelength fluorescence is usually much weaker than the short-wavelength band and escapes observation at the typically used excitation wavelengths of 300–320 nm; however, it is revealed by selective excitation at about 360 nm. The low intensity of the long-wavelength fluorescence means that it is unlikely to add to the utility of 2AP as a fluorescent probe of DNA structure and has not been explored in this regard, although it is another manifestation of the sensitivity of 2AP to base stacking interactions. Excitonic coupling between stacked pairs of 2AP molecules in DNA has, however, been exploited in low-energy (>300 nm) circular dichroism spectroscopy to probe DNA conformation (Finger et al. Reference Finger, Patel, Beddows, Ma, Exell, Jardine, Jones and Grasby2013; Johnson et al. Reference Johnson, Baase and Von Hippel2004; Jose et al. Reference Jose, Datta, Johnson and Von Hippel2009).
2.2 Quenching of 2AP fluorescence by stacking with the natural bases
Identifying 2AP as a fluorescent analogue of adenine, the Stryer group made the crucial observation that its fluorescence was quenched in polynucleotides and recognized its potential for probing enzyme-induced disruption of nucleic acid structure (Ward et al. Reference Ward, Reich and Stryer1969). When 2AP is substituted for a natural base in DNA, it displays an emission band with a maximum at ~370 nm that is essentially unchanged in spectral profile from that of the free nucleoside, but is reduced in intensity by a factor of 10–100. Several early studies showed that the fluorescence is quenched by stacking interactions with neighbouring bases and the quenching efficiency is highly sensitive to the local duplex conformation (Guest et al. Reference Guest, Hochstrasser, Sowers and Millar1991; Nordlund et al. Reference Nordlund, Andersson, Nilsson, Rigler, Graeslund and Mclaughlin1989; Rachofsky et al. Reference Rachofsky, Seibert, Stivers, Osman and Ross2001c; Xu et al. Reference Xu, Evans and Nordlund1994).
Barton and coworkers have presented a substantial body of evidence that excited 2AP is quenched efficiently by electron transfer from guanine and have exploited this effect in studying the mechanism of charge transfer (CT) in DNA (see for example, Kelley, Reference Kelley1999; O'Neil & Barton, Reference O'Neil and Barton2002, Reference O'Neill and Barton2004a, Reference O'Neill and Bartonb; O'Neill et al. Reference O'Neill, Becker, Wan, Barton and Zewail2003, Reference O'Neill, Dohno and Barton2004; Wan et al. Reference Wan, Fiebig, Schiemann, Barton and Zewail2000). The following observations have emerged from their work. Intrastrand electron transfer is more efficient than interstrand transfer, although both occur. The electron transfer efficiency (from guanine to excited 2AP) is greater in the 3–5′ direction and is less dependent on distance than in the 5–3′ direction. Electron transfer is possible between guanine and excited 2AP over distance of up to ~14 Å. The transfer is most efficient when the bridging bases, between G and 2AP, are adenines. Pyrimidine bases attenuate the transfer efficiency significantly. A full understanding of the mechanisms of charge transport in the duplex has yet to be achieved (see for example, Genereux & Barton, Reference Genereux and Barton2010), but an established feature, that is relevant to the use of 2AP as a probe, is conformational gating, whereby conformational fluctuations of the duplex facilitate CT by allowing the formation of CT-active states. Indeed, in frozen duplexes, the quenching of 2AP fluorescence is dramatically reduced (Neely & Jones, Reference Neely and Jones2006; O'Neill & Barton, Reference O'Neill and Barton2004a) and, if there is no guanine in close proximity, it is virtually eliminated. Although the role of guanine is well established, the extent to which excited 2AP in DNA is quenched by CT with the other natural bases, and the contribution of other, non-CT processes remain matters of debate.
Excited 2AP cannot be quenched by electronic energy transfer to the natural bases, since its excitation energy is lower than theirs. 2AP acts as an acceptor for energy transfer from the excited natural bases and has been used as an energy trap in studies of interbase energy transfer, as described in a review by Nordlund (Reference Nordlund2007). Although this is an interesting application of 2AP, it is outside the scope of the present review and will not be discussed further.
2AP-containing deoxydinucleotides have been the subject of several studies to explore the quenching interaction between the natural bases and 2AP. Larsen et al., reported steady-state fluorescence measurements of 2AP in dinucleotides with each of the natural DNA bases, and with inosine (I), the riboside of hypoxanthine (Larsen et al. Reference Larsen, Van Stokkum, De Weerd, Vengris, Aravindakumar, Van Grondelle, Geacintov and Van Amerongen2004). Inosine is deemed to be redox-inactive towards excited 2AP and was adopted as a non-CT control in the electron transfer studies of Barton et al. (vide supra). 2AP fluorescence was found to be quenched in all of the dinucleotides and the quenching efficiency, G>T~A>C>I, could be correlated with the driving force for interbase CT. In addition to CT-quenching, they invoked the existence of a non-fluorescent excited state of 2AP (supported by transient absorption measurements) to account for quenching by inosine. The relationship between quenching efficiency and the driving force for CT between the natural base and excited 2AP, greatest for G and least for C, was reinforced by a recent study of photo-induced electron transfer between 2AP and the natural monophosphate nucleotides in aqueous solution (Narayanan et al. Reference Narayanan, Kodali, Xing and Stanley2010). This study included a re-assessment of the redox potentials of the natural bases and excited 2AP, using cyclic voltammetry in aprotic solvents to avoid complications introduced by proton transfer. It was concluded that photoinduced electron transfer could occur between all of the natural bases and 2AP, with excited 2AP being reduced by G or A, and oxidized by T (For C, the free energies for oxidation and reduction were equivalent, within experimental error). Time-resolved fluorescence studies (Somsen et al. Reference Somsen, Keukens, De Keijzer, Van Hoek and Van Amerongen2005a, Reference Somsen, Hoek and Amerongenb, Reference Somsen, Trinkunas, Keijzer, Hoek and Amerongen2006) confirmed that fluorescence of 2AP is quenched strongly in dinucleotides by the natural bases and inosine, and inferred the involvement of a dark state. An ultrafast (time resolution of ~200 fs) spectroscopic study of 2AP–G and 2AP–A dinucleotides provided further insight into the quenching process (Wan et al. Reference Wan, Xia, Becker and Zewail2005). An important and unusual feature of this work was the use of both fluorescence up-conversion, to probe the ultrafast decay of the initial, optically excited state, and transient absorption spectroscopy, to reveal the existence of dark states formed in the decay process. Two significant observations emerged from this work. Firstly, a discrepancy between the decay time measured by fluorescence up-conversion and that from transient absorption indicated the existence of a dark state to which the initially excited, emissive state decays. An emission decay time on the 10's of ps timescale was attributed to CT (to form the dark state), while the decay time of the dark state, also on the 10's of ps timescale was attributed to charge recombination. Secondly, 50% of the initial fluorescence intensity of 2AP–G and 2AP–A was lost in less than 200 fs, faster than the time resolution of the measurement. This extremely rapid non-radiative decay was attributed to barrierless CT by vibrationally hot molecules prior to vibrational relaxation. Unfortunately this study did not include 2AP–inosine as a CT-free control system. Further evidence of ultrafast interbase quenching of 2AP fluorescence comes from observed discrepancies between the fluorescence quantum yields determined from steady-state intensity measurements and those from the measurement of time-resolved decay parameters (discussed in more detail below); the latter are higher than the former, indicating the occurrence of non-radiative decay processes that are too fast to be observed in typical decay measurements, that is to say with lifetimes less than about 10 ps. Such discrepancies have been observed for 2AP in duplexes and single strands (Avilov et al. Reference Avilov, Piemont, Shvadchak, De Rocquigny and Mely2008; Godet et al. Reference Godet, Ramalanjaona, Sharma, Richert, De Rocquigny, Darlix, Duportail and Mely2011; Neely et al. Reference Neely, Tamulaitis, Chen, Kubala, Siksnys and Jones2009; Rachofsky et al. Reference Rachofsky, Seibert, Stivers, Osman and Ross2001c). Ultrafast fluorescence measurements on 2AP-containing DNA duplexes and single strands have shown fluorescence decay times of <5 ps, with values as low as 400 fs when 2AP is closely stacked with G (Gelot et al. Reference Gelot, Touron-Touceda, Cregut, Leonard and Haacke2012; Manoj et al. Reference Manoj, Min, Aravindakumar and Joo2008). The base-sequence dependence of the decay times observed by Manoj et al. implies that ultrafast quenching on the sub-ps-to-ps timecale (as well as quenching on the 10–100 ps timescale) is due to CT processes. Gelot et al., found good agreement between decay-derived and intensity derived quantum yields showing the absence of unresolved, faster (<300 fs) decay processes, contrary to the findings of Wan et al. for dinucleotides (Wan et al. Reference Wan, Xia, Becker and Zewail2005). Similarly, the experiments of Manoj et al. found no decay time faster than 420 fs, although their time resolution should have allowed observation of decay components <100 fs.
The nature of the excited states that may be involved in interbase quenching of 2AP have been explored in computational studies of gas-phase 2AP-nucleobase dimers (and trimers), in which 2AP is stacked with a DNA base in a B-form structure, but there is no covalent link between them. Early calculations, using time-dependent density functional theory (TDDFT), attributed quenching to internal conversion to dark CT states, energetically below the initially excited 2AP-like transition (Jean & Hall, Reference Jean and Hall2001, Reference Jean and Hall2002). However, it is now known that the TDDFT methods fail to compute CT states accurately and later studies using configuration interaction singles (CIS) predicted that CT states are higher in energy than the locally excited 2AP ππ* state (Hardman & Thompson, Reference Hardman and Thompson2006, Reference Hardman and Thompson2007). Two recent computational studies (CIS with second-order perturbation theory) by Matsika and coworkers, on 2AP–pyrimidine dimers (Liang & Matsika, Reference Liang and Matsika2011) and 2AP–purine dimers (Liang et al. Reference Liang, Nguyen and Matsika2013), represent a significant advance over previous studies by exploring the fate of the excited state population after absorption. Excited states were calculated for a typical B-DNA conformation and relaxation along the S1 surface was then examined. Ground state structures with 2AP in either the 5 or 3′ positions were considered; these differed in the extent of π-overlap and other, specific interactions. From the initially excited (Franck-Condon) S1 state, which was an ππ* state localized on 2AP, different quenching pathways were found, depending on whether 2AP was in the 5 or 3′ position, as well as the identity of the partner base. Some quenching pathways involved CT, but pathways involving conical intersections or dark states localized on 2AP were also found. The important outcome of these studies was the prediction that different interbase interactions, in the different initially excited conformations, can lead to alternative CT or non-CT quenching mechanisms. However, even this latter, relatively sophisticated computational scenario is far-removed from experimental conditions; it did not include the sugar–phosphate backbone or solvent. A full understanding of the photophysical mechanism(s) of interbase quenching awaits the development of computational methods to successfully include the complex influence of solvation and conformational dynamics, in both the ground and excited states. A tall order, indeed!
3. The fluorescence decay of 2AP in DNA as a reporter of conformational properties
The interbase interactions that quench 2AP fluorescence in DNA not only have the effect of dramatically shortening the fluorescence decay time (Fig. 3), but also result in a complex, multiexponential decay function. This complex decay behaviour is observed for systems that are apparently homogeneous, such as a solution of identical oligonucleotides each of which contains a single 2AP in the same sequence position, and reflects the conformational heterogeneity of DNA that arises from thermal motion of the bases (DNA breathing). The excited 2AP population is partitioned between several different local conformational environments that provide distinctly different quenching efficiencies, resulting in a number of different fluorescence lifetimes. Time-resolved fluorescence studies of 2AP-containing DNA have been conducted mainly using the technique of TCSPC (Becker, Reference Becker2005; Lakowicz, Reference Lakowicz2006); with a time-resolution of about 30 ps, and it is the result of these experiments that will be considered in this section. The relatively few ultrafast measurements (time resolution <1 ps) will be discussed separately in Section 5. It should also be mentioned that, although multiexponential fitting of the 2AP fluorescence decay is the conventional approach, other descriptions of the decay function have been proposed, such as lifetime distributions (Fogarty et al. Reference Fogarty, Jones and Camp2011), stretched exponential (Somsen et al. Reference Somsen, Trinkunas, Keijzer, Hoek and Amerongen2006) and phasor diagrams (Buscaglia et al. Reference Buscaglia, Jameson and Chaires2012).
A comparison of the decay curves of the free 2AP-ribonuscleoside (red) with a 2AP-containing DNA duplex (grey). The instrument response function is shown in black.
3.1 2AP in duplex oligonucleotides
2AP-containing DNA duplexes generally show fluorescence decays that can be described by four exponential components, as expressed by Eq. (1), with typical lifetimes of <100 ps, ~0·5 ns, ~2 ns and ~10 ns (Avilov et al. Reference Avilov, Piemont, Shvadchak, De Rocquigny and Mely2008; Guest et al. Reference Guest, Hochstrasser, Sowers and Millar1991; Hochstrasser et al. Reference Hochstrasser, Carver, Sowers and Millar1994; Neely & Jones, Reference Neely and Jones2006; Neely et al. Reference Neely, Daujotyte, Grazulis, Magennis, Dryden, Klimasauskas and Jones2005; Nordlund et al. Reference Nordlund, Andersson, Nilsson, Rigler, Graeslund and Mclaughlin1989; Rachofsky et al. Reference Rachofsky, Seibert, Stivers, Osman and Ross2001c; Ramreddy et al. Reference Ramreddy, Rao and Krishnamoorthy2007; Reference Ramreddy, Kombrabail, Krishnamoorthy and Rao2009; Sabir et al. Reference Sabir, Toulmin, Ma, Jones, Mcglynn, Schroder and Magennis2012).
 $${I}{\rm (}{t}{\rm ) =} \sum\limits_{i = 1}^4 {A_i \,\exp \left( {\displaystyle{{ - t} \over {\tau _i}}} \right)}, $$
where I is the fluorescence intensity, measured as a function of time, t; τ i is the fluorescence lifetime of the ith decay component and Ai is fractional amplitude of that component.
In a simple interpretation, each lifetime, τ i, can be considered to represent a distinct conformational state and its fractional amplitude (pre-exponential factor or A-factor), Ai, indicates the fraction of the population occupying that state. More realistically, each lifetime is likely to represent a distribution of conformations in which 2AP experiences similar quenching rates.
Although the precise values of the lifetimes and A-factors vary to some extent, depending on the sequence context of 2AP, their general magnitudes in the unperturbed duplex show a common pattern, with an accepted, common interpretation. The very short lifetime component, τ 1, <100ps, is attributed to a highly stacked conformation, in which excited 2AP is rapidly quenched by interbase interaction, primarily electron transfer from guanine bases in close proximity. This is the dominant conformation, typically accounting for more than 70% of the emitting population. The long, ~10 ns, lifetime, τ 4, is attributed to an unstacked conformation in which 2AP is extrahelical and experiences a solvated environment, free from quenching interactions. The value of this decay time is comparable with that of free 2AP–riboside in solution. This is a minor conformation, typically accounting for <5% of the emitting population. The intermediate lifetimes, τ 2 and τ 3, ~500 ps and ~2 ns, respectively, correspond to imperfectly or partially stacked structures, in which 2AP is intrahelical, but is not subject to rapid CT quenching. The magnitude of the A-factors (fractional populations) almost invariably follow the trend A 1≫A 2>A 3>A 4.
When interpreting the values of the decay parameters of 2AP obtained from fitting multiexponential functions, it is important to be aware of the problem of correlation between A-factors and lifetimes (Lakowicz, Reference Lakowicz2006). In the fitting process, the lifetime can be varied to compensate for the A-factor and vice versa, so that equally good fits (within experimental error) can be obtained with different combinations of Ai and τ i. This problem can be minimized by the use of global analysis in which a set of decays is recorded as a function of emission wavelength (or another suitable variable) and fitted simultaneously, with the lifetimes, τ i, as common parameters (Beechem et al. Reference Beechem, Gratton, Ameloot, Knutson, Brand and Lakowicz2002).
Many studies of DNA–enzyme interaction are based on measurement of the fluorescence intensity of 2AP and it may be informative at this point, to consider the relationship between the intensity (quantum yield) of fluorescence and the decay parameters. The quantum yield (and hence intensity) of fluorescence of the emitting species that contribute to the observed fluorescence decay is proportional to the number-average lifetime, <τ>, of the multi-component decay. The decay-derived value that is normally quoted is the quantum yield relative to the free riboside, Φrel , as defined by Eq. (2).
 $$\Phi_{rel} = \displaystyle{{\sum {A_i \tau_i}} \over {\sum {A_i}}} \displaystyle{1 \over {\tau_{2{\rm APr}}}} = \displaystyle{{\langle \tau \rangle} \over {\tau_{2{\rm APr}}}}, $$
where τ i is the fluorescence lifetime of the ith decay component, Ai is fractional amplitude of the ith component and τ 2APr is the fluorescence lifetime of 2AP riboside.
The fractional contribution of each decay component to the steady-state fluorescence intensity, Fi, is determined by the product of the A-factor and lifetime for that component, as expressed by Eq. (3). Thus, the steady-state fluorescence spectrum of 2AP in DNA arises mainly from the long-lifetime components (τ 3 and τ 4), although they constitute only a small minority if the emitting population.
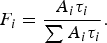 $$F_i = \displaystyle{{A_i \tau _i} \over {\sum {A_i \tau _i}}}. $$
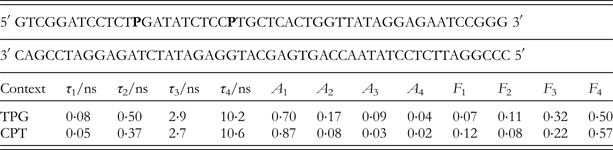
The decay parameters shown in Table 1, for a single 2AP at two different positions in a 50-base-pair duplex (Sabir et al. Reference Sabir, Toulmin, Ma, Jones, Mcglynn, Schroder and Magennis2012) are typical of those measured for 2AP-containing duplexes. Each duplex has an identical sequence, apart from the position at which 2AP is substituted in place of adenine. The effect of sequence context on the two shortest lifetimes, τ 1 and τ 2, and their amplitudes, A 1 and A 2, is apparent. In sequence context CPT (where 2AP is denoted as P), a larger fraction of the 2AP population is highly stacked (84% compared with 70% in TPG), and in this highly stacked state, 2AP experiences faster quenching (shorter τ 1). These characteristics can be correlated with the proximity of multiple G:C base pairs to 2AP in the CPT position, resulting in a more constrained, tightly stacked local structure. The fractional intensity values show that the unquenched, extrahelical component (F 4) accounts for about 50% of the steady-state intensity for each duplex, although it constitutes only few per cent of the conformational population (A 4).
Fluorescence lifetimes, τi, and corresponding fractional amplitudes, Ai, for 2AP-containing duplexes in which 2AP, denoted as P, is substituted at two alternative positions within the same sequence (Sabir et al. Reference Sabir, Toulmin, Ma, Jones, Mcglynn, Schroder and Magennis2012). The fractional contribution of each component to the steady-state intensity, Fi, is also shown
Early time-resolved fluorescence studies of 2AP in duplexes (Guest et al. Reference Guest, Hochstrasser, Sowers and Millar1991; Nordlund et al. Reference Nordlund, Andersson, Nilsson, Rigler, Graeslund and Mclaughlin1989) demonstrated the non-exponentiality of the decay and that four lifetime components were needed to give a satisfactory fit. In both studies, the temperature dependence of the decay parameters was found to be consistent with the assignment of the shortest lifetime (τ 1) to intra-helical, stacked 2AP and the longest lifetime (τ 4) to extrahelical 2AP. Guest et al. also found that the temperature-dependence of the stacked population (A 1) was correlated with the strength of the base-pair (decreasing with increasing temperature for the weaker base-pairs 2AP–A and 2AP–C). Both studies inferred a relationship between the distribution of lifetimes and stacking–unstacking motions of the duplex.
As part of a study of polymerase-induced melting of a DNA helix terminus, Hochstrasser et al. used time-resolved fluorescence to analyse the effect of base-pairing interactions on the fluorescence decay of an end-terminal 2AP base in DNA primer/templates (Hochstrasser et al. Reference Hochstrasser, Carver, Sowers and Millar1994). They used global analysis and, for the first time, gave a detailed interpretation of the four exponential fluorescence decay behaviour in terms of distinct, ground-state conformational states and their populations. The variation of the apparent fraction of paired (highly stacked) 2AP bases with temperature was found to be in accord with optical melting data, and the extent of base-pairing observed in each duplex was consistent with the base-pairing preferences of 2AP established in previous studies.
A study by Rachofsky et al. of duplexes in which 2AP was paired with an abasic site in different sequence contexts provided further evidence of four-component decays and also identified discrepancies between steady-state quantum yield values and those derived from decay parameters (Rachofsky et al. Reference Rachofsky, Seibert, Stivers, Osman and Ross2001c). However, a detailed interpretation of the decay parameters was not attempted. Instead, the discussion concentrated on the amplitude of the extrahelical component and attributed the other three components to a single conformation represented by a number average lifetime. This provides little insight into the conformational properties beyond that obtainable from the accompanying steady-state data.
During a study of nucleotide flipping by M.HhaI, discussed in Section 4.3, below, we investigated the decays of two crystalline 2AP-containing duplexes with known X-ray structures (Neely, Reference Neely2005; Neely et al. Reference Neely, Daujotyte, Grazulis, Magennis, Dryden, Klimasauskas and Jones2005). The duplexes were co-crystallized as ternary complexes with the enzyme and cofactor, but 2AP was located several base-pairs from the protein-binding site, so that the local duplex structure was not appreciably perturbed, as illustrated by the crystal structures in Fig. 4. As shown in Fig. 5 the two duplexes differ only in the identity of base opposite the 2AP, thymine and guanine, respectively, but 2AP occupies distinctly different conformations in each. In duplex PT (Fig. 5a) 2AP, in an anti-conformation, forms a Watson–Crick base-pair with thymine, whereas in duplex PG (Fig. 5b) 2AP adopts a syn conformation, forming a Hoogsteen-type base-pair with the guanine. The consequent difference in stacking interactions between 2AP and the two neighbouring guanines (Figs 5c and 5d) is reflected in the decay parameters (Table 2) which suggest that 2AP is more effectively quenched in PG than in PT, consistent with increased π-overlap in the former.
The crystal structure of (a) the PG (PDB ID: 2C7Q) and (b) the PT duplex (blue) (unpublished work) in ternary complex with M.HhaI (green ribbons) and the AdoHcy cofactor (dark green sticks). The 2AP base is shown in red.
The immediate environment of 2AP in the crystalline (a and b) PG duplex (PDB ID: 2C7Q) and (c, d) PT duplex (unpublished work). Water molecules are shown as lone oxygen atoms (red). Distances shown are for donor–acceptor interactions between hydrogen bonding atoms. For the 2AP-containing oligonucleotide strands (b, d), the bases are shown 3–5′ going from the top to bottom of the figure.
Fluorescence lifetimes, τi, and corresponding fractional amplitudes, Ai, for two 2AP-containing duplexes in the crystalline state and in solution (Neely, Reference Neely2005; Neely et al. Reference Neely, Daujotyte, Grazulis, Magennis, Dryden, Klimasauskas and Jones2005)
As shown in Table 2, the fluorescence decays of the crystalline duplexes show four components with similar lifetimes and A-factors to those found in the equivalent solution-phase systems (enzyme-bound duplexes), and thus reveal conformational heterogeneity in the crystals at room temperature that is not apparent in the low- temperature X-ray structure. The fluorescence decay can detect the existence of species that constitute only a few per cent of the excited state population and is sensitive to transient conformational states that exist on the timescale of the excited state lifetime. The crystal structure, on the other hand, shows the average or dominant conformational geometry at low temperature (90 K), within the limits of the available structural resolution. Small differences between crystalline and solution-phase decay parameters reflect the greater conformational mobility in solution. The lifetime of the highly quenched conformations (τ 1) is significantly shorter in solution than in the crystal, consistent with greater dynamic freedom and enhanced CT quenching. However, comparison with the behaviour of duplexes rendered rigid in a frozen matrix at 77 K (vide infra) suggests that in the crystal, at room temperature, the base motions that facilitate quenching of 2AP remain largely uninhibited.
Our decay measurements on rigid duplexes in frozen solution at 77 K (Neely & Jones, Reference Neely and Jones2006) threw light on the nature of the conformational states that give rise to the heterogeneous decay of 2AP and the role of base dynamics in populating these states. The shortest decay component, τ 1, was eliminated in frozen duplexes, even when 2AP was stacked directly G, demonstrating the importance of base dynamics in facilitating rapid CT quenching. It was inferred that the highly stacked geometry that gives rise to the very short decay time can be attained only through thermal motion of the bases. On the other hand, the persistence of three longer decay components at 77 K implies the existence of a number of discrete, equilibrium conformational states that can be characterized by three distinguishable intrinsic decay times.
Rao, Krishnamoorthy and co-workers have probed site-specific dynamics in several DNA systems (Goel et al. Reference Goel, Mukherjee, Rao and Krishnamoorthy2010; Ramreddy et al. Reference Ramreddy, Rao and Krishnamoorthy2007, Reference Ramreddy, Kombrabail, Krishnamoorthy and Rao2009) by substituting 2AP at different positions relative to the ends and employing repeats of adenine to avoid sequence-specific quenching effects. In 30-nucleotide, poly(A–T) duplexes (Ramreddy et al. Reference Ramreddy, Rao and Krishnamoorthy2007), it was found that the value of the short lifetime component was dependent on the position of 2AP. The lifetime was longer when 2AP was placed at the end of the duplex, compared with the centre of the duplex, indicating weaker base stacking interactions as a result of base-pair fraying. In double-stranded DNA with singe-strand overhangs, base-pair fraying at the ends of the duplex region was largely absent. It was proposed that wrapping by the single-strand region around the end base-pairs formed three-centred hydrogen-bonds and inhibited fraying. An unexpected finding was that the level of stacking interaction of 2AP with near neighbours was weaker within the longer strand than within the shorter strand. It was suggested that the presence of single-strand overhangs in the longer strand could be the cause of higher flexibility in the duplex region. It was speculated that DNA enzymes that discriminate between the long versus short strands might rely on such differences in dynamics as recognition cues for achieving specific binding during DNA repair events. In a later study, the same approach was used to investigate the effects of binding DNA to histone and micellar surfaces (Goel et al. Reference Goel, Mukherjee, Rao and Krishnamoorthy2010). It was observed that binding causes is an increase in rigidity of the DNA backbone, and drastic dampening of the internal dynamics and fraying motions. A significant weakening of base-stacking interactions was also found.
In the interpretation of the decay parameters of 2AP in DNA, many authors use the terms ‘static’ and ‘dynamic’ to describe the quenching processes. However, the use of these terms in the context of this conformationally dynamic and heterogeneous system can be misleading. Conventionally, ‘dynamic’ quenching is used to describe processes such as collisions or conformational changes that occur following excitation of a fluorophore, and result in non-radiative decay within the excited state lifetime; quenching is described as ‘static’ when the observed fluorescence lifetime is intrinsic to the ground-state structure that was excited and, following excitation, the system remains static on the timescale of the excited state lifetime. The very short decay times (<100 ps) exhibited by 2AP in DNA are often described as static quenching, because it is perceived that there is insufficient time for dynamic process to occur within the excited-state lifetime. However, population of the conformations that are susceptible to very rapid (CT) quenching, and exhibit the shortest decay times, likely involves base dynamics in the ground state, prior to excitation. Indeed, there is clear evidence that these rapid decay mechanisms are inhibited or arrested by increasing the viscosity (Avilov et al. Reference Avilov, Piemont, Shvadchak, De Rocquigny and Mely2008; Gelot et al. Reference Gelot, Touron-Touceda, Cregut, Leonard and Haacke2012; Godet et al. Reference Godet, Ramalanjaona, Sharma, Richert, De Rocquigny, Darlix, Duportail and Mely2011) or freezing the sample (Neely & Jones, Reference Neely and Jones2006). It can be argued that all the 2AP decay components reflect dynamic processes; they are distinguished merely by the timescale of the dynamics and whether the dynamics occur before or after excitation (or both before and after).
3.2 2AP in single-strand oligonucleotides
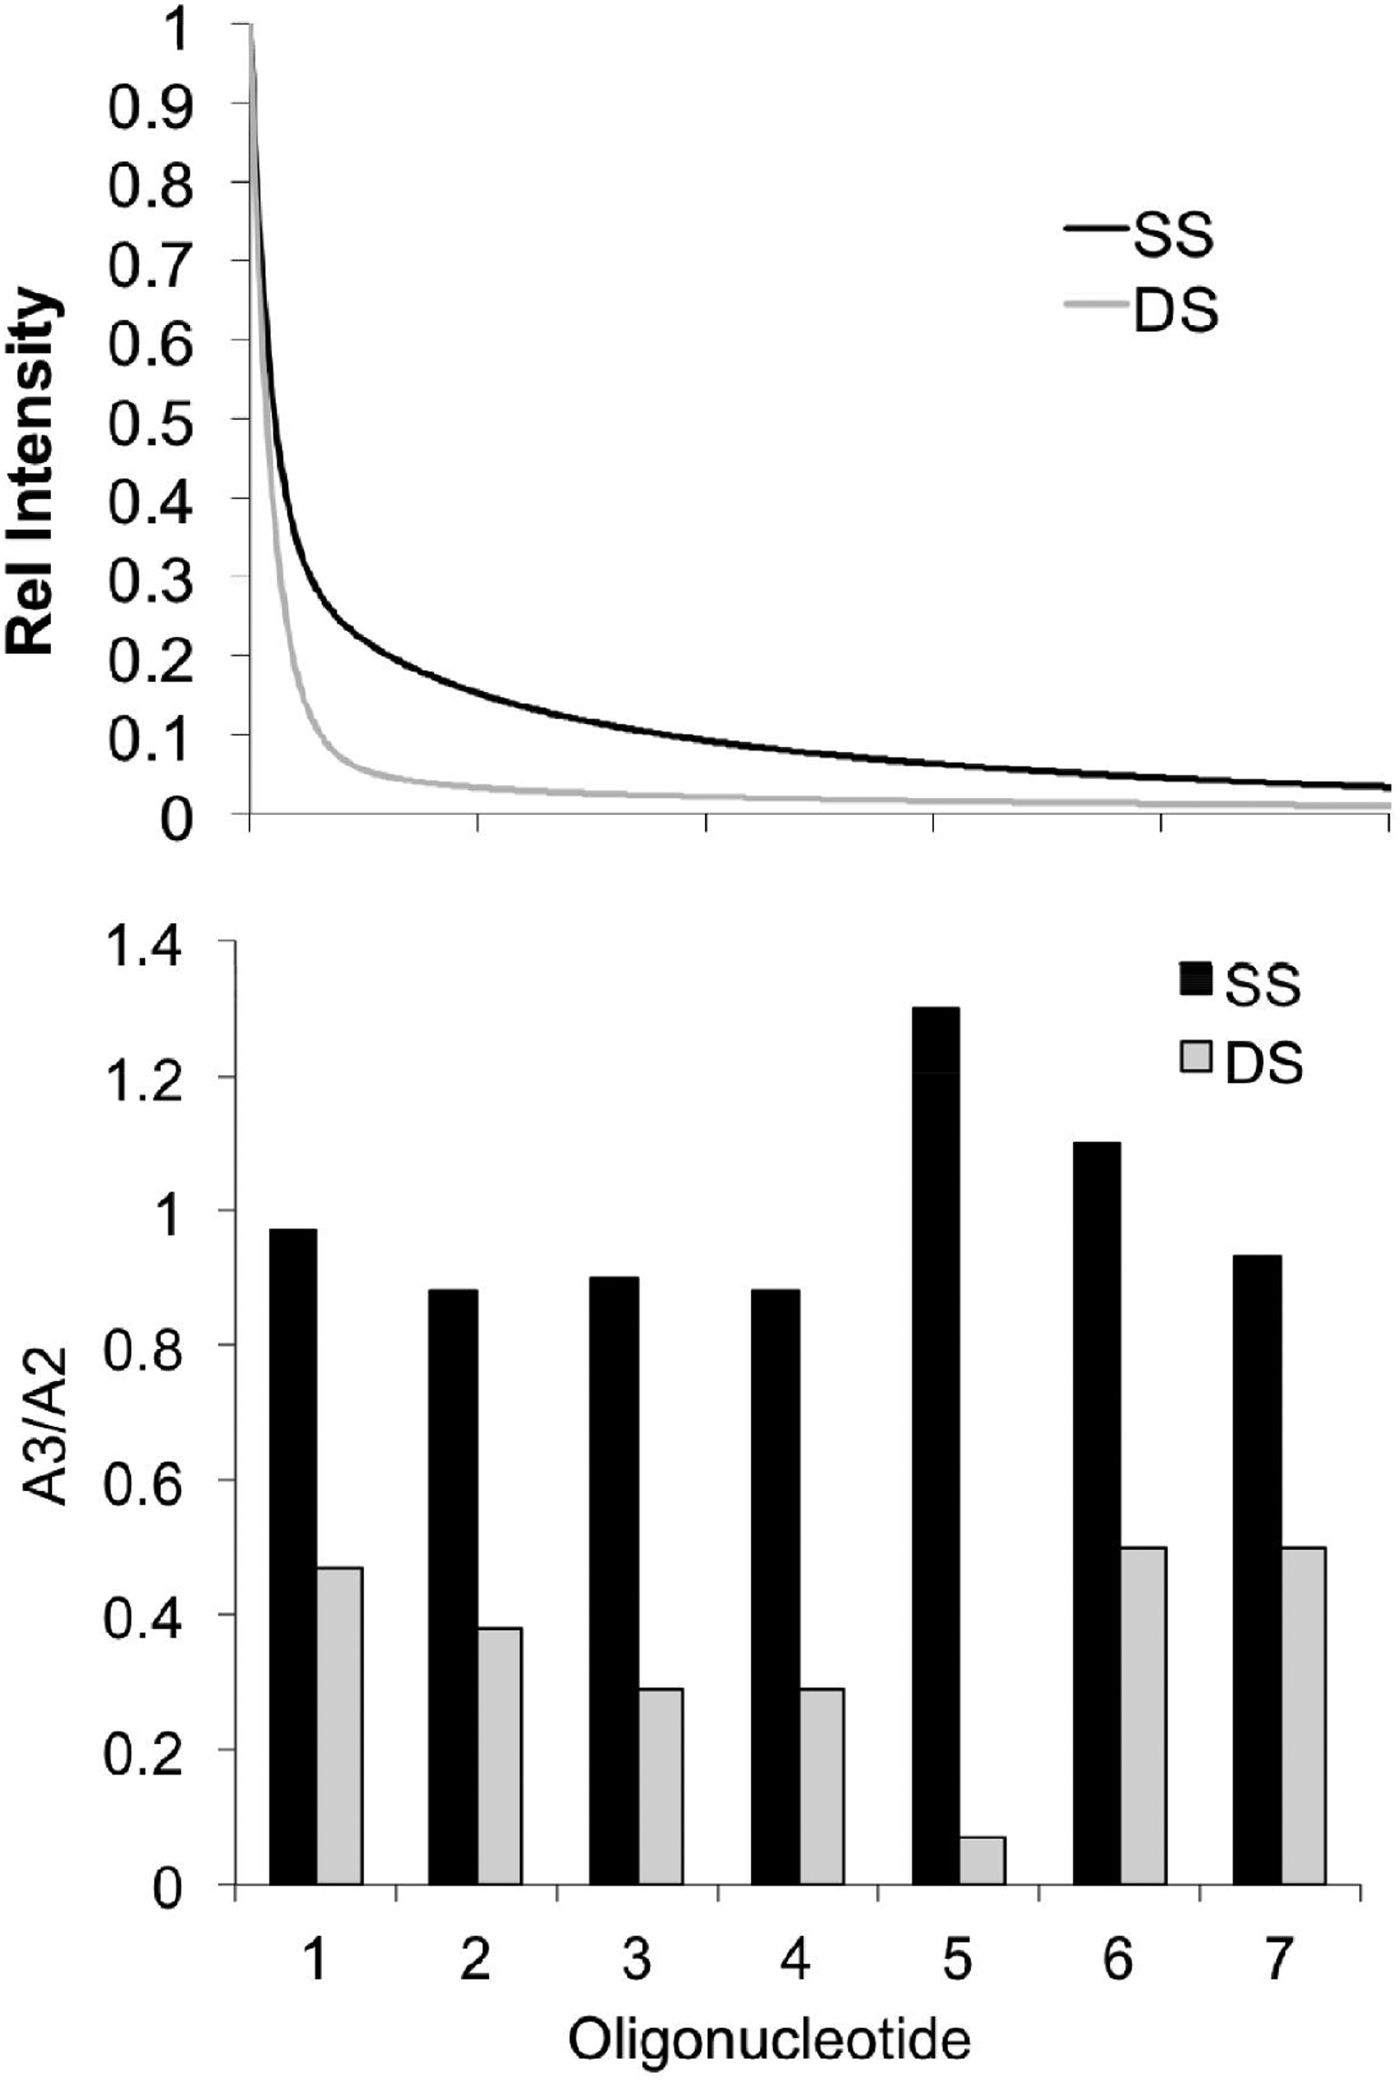
The fluorescence decay of 2AP is not sensitive to hydrogen-bonding interactions per se (Guest et al. Reference Guest, Hochstrasser, Sowers and Millar1991; Rachofsky et al. Reference Rachofsky, Osman and Ross2001a) and so 2AP is not a direct probe of base pairing. However, the perturbation of base-stacking interactions that occurs as a result of local unpairing of the duplex gives rise to characteristic changes in the fluorescence decay of 2AP, as we showed in a systematic comparison of seven 2AP-containing single strands with their corresponding duplexes (Ma, Reference Ma2012; Sabir et al. Reference Sabir, Toulmin, Ma, Jones, Mcglynn, Schroder and Magennis2012). As illustrated in Fig. 6a, the decay of 2AP in a single strand is qualitatively longer than in the corresponding duplex, implying an overall decrease in quenching, as might be expected. The decay parameters shown in Table 3, for a single 2AP at two different positions in a 50-base sequence are typical of those measured in this study. The decay parameters for the corresponding duplexes are given in Table 1.
(a) Comparison of the fluorescence decay curve of a 2AP-containing single strand (black) with that of the corresponding duplex (black). (b) Comparison of the ratio of the A-factors, A 3 and A 2, for 2AP in each of seven single-strand (black) and duplex (grey) oligonucleotides.
Fluorescence lifetimes, τi, and corresponding fractional amplitudes, Ai, for 2AP-containing single strands in which 2AP, denoted as P, is substituted at two alternative positions within the same sequence (Sabir et al. Reference Sabir, Toulmin, Ma, Jones, Mcglynn, Schroder and Magennis2012)
The very short decay component (τ 1) persists in the single strands, indicating that highly stacked conformations exist in the absence of base-pairing and, moreover, remain highly populated (values of A 1 >0·6). The longest lifetime (τ 4) is noticeably shorter in the single strands, showing that 2AP does not tend to escape completely from stacking interactions with neighbouring bases, whereas in duplexes this component is characteristic of extrahelical (solvent-exposed) 2AP. The population of this more-or-less destacked state remains low in single strands. The most characteristic difference between single strands and duplexes lies in the relative values of the A-factors. In duplexes, the values of the A-factors generally follow the trend: A 1≫A 2>A 3>A 4. In single strands, there is a transfer of population from well-stacked states (A 1 and A 2) to weakly stacked states (A 3), so that the trend becomes A 1≫A 2 ≈ A 3≫A 4. This is illustrated by comparing the ratio A 3/A 2 for each single strand with duplex, as shown in Fig. 6b; in the single strands this ratio is around 1, but is consistently much smaller in the duplexes. This increase in the heterogeneity of the conformational population is consistent with greater base mobility in the absence of base-pairing. The extent to which decay parameters change between duplex and single strand depends on the sequence context of 2AP. For example, in CPT, the large decrease in A 1 in the single strand can be correlated with release from the constraints of local G–C base-pairs, and the significant increase in τ 1 reflects the loss of inter-strand CT quenching of 2AP by adjacent Gs in the complementary strand. Our comparison of the decay parameters of three shorter, 18-nucleotide, single stands and duplexes (as part of our study of DNA unpairing by Flap Endonuclease-1) (Finger et al. Reference Finger, Patel, Beddows, Ma, Exell, Jardine, Jones and Grasby2013), yielded similar results to those described above, although unpairing resulted in a somewhat greater depopulation of the highly stacked states in these oligonucleotides.
Ramreddy et al. examined the position dependence of the 2AP decay in 30-nucleotide adenine repeats (Ramreddy et al. Reference Ramreddy, Rao and Krishnamoorthy2007) in comparison with the corresponding duplexes (already discussed above). They found that the short decay component was completely lost in the single strands, yielding a three-component decay and a significant increase in average lifetime (quantum yield). They also noted a reduction in the longest lifetime in the single strands, consistent with that noted above. The decay parameters of 2AP showed little dependence on position in the poly-A strand. Absence of the short component can be attributed to the low efficiency of CT quenching of 2AP by A, rather than the absence of stacked states. In the poly(A–T) duplexes, inter-strand quenching of 2AP by T is probably a significant contributor to the short decay time.
Avilov et al. demonstrated the role of base dynamics in the ultrafast quenching of 2AP in single-stranded DNA (Avilov et al. Reference Avilov, Piemont, Shvadchak, De Rocquigny and Mely2008). They examined the effect of viscosity on the decays of 2AP-containing hexanucleotides, with 2AP in four different sequence contexts, APCGCC, AACGPC, APTGCC and AATGPC. By carrying out complementary measurements of the steady-state quantum yield, they quantified the fractional population of the ultrafast-decaying dark species, which they include explicitly as an additional amplitude parameter, α 0, in their tabulated decay parameters. The value of α 0 is sequence-dependent, being significantly higher when 2AP is stacked with G, and is dramatically decreased at high viscosity (77% glycerol). This is consistent with an ultrafast CT quenching mechanism that involves base dynamics. For 2AP in the GPC context, α 0 has the remarkably high value of 0·8; that is to say 80% of the 2AP population exists in conformations (presumably extremely highly stacked) that are invisible to conventional (not ultrafast) fluorescence detection. Consistent with other reports, this study also found the value of the longest lifetime component to be substantially shorter than that of unquenched 2AP.
3.3 2AP in other DNA structures
Time-resolved fluorescence of 2AP has been used in few studies of non-duplex DNA structures, but these have addressed a variety of systems, including looped domains, junctions and G-quadruplexes. This approach is particularly valuable in exploring variations in conformational dynamics between base-paired and non-paired domains and investigating structural transitions.
Lee et al. substituted 2AP for adenine in selected positions within the 18-base loop domain of a (GC)3(CAG)6(GC)3 hairpin oligonucleotide, a model triple-repeat system (Lee et al. Reference Lee, Barch, Castner, Volker and Breslauer2007). The four-component exponential decays revealed differences in the global DNA conformation between duplex, hairpin and single strand and also position-dependent variations in conformation and dynamics within the repeat DNA domain. Since the 2AP probe was always in the same sequence environment in this model system, the values of the lifetimes showed little variation, but the conformational differences were apparent in the variations of the A-factors which reflect changes in conformational populations. In particular, the conformational distribution at the centre of the CAG repeat differed significantly from that close to the hairpin stem, showing substantially higher population of poorly stacked and destacked states.
More recently, Godet et al. investigated the position dependence of the 2AP decay in the 5-nucleotide loop domain of a DNA hairpin, in the context of studying the effect of binding of HIV-1 nucleocapsid protein (NC) on loop dynamics (Godet et al. Reference Godet, Ramalanjaona, Sharma, Richert, De Rocquigny, Darlix, Duportail and Mely2011). They continued the practice of this group to evaluate the fractional population of the 2AP dark species, as well as the decay parameters that are measured directly by TCSPC (see Section 3.2). The loop structure was found to restrict the inter-base quenching of 2AP within the loop, compared with single-strand oligonucleotides. Nevertheless, the dark species were again found to be dominant, representing 80–90% of the 2AP population, indicating efficient CT quenching by neighbouring guanine bases (in each position studied, 2AP was flanked by a G). The values of the longest lifetime (τ 4) were close to that of free 2AP indicating an extrahelical, fully destacked state. This differed from the shorter τ 4 value seen in single strands, confirming the limited flexibility of the loop. The low population of the extrahelical conformation (1–4%) showed the bases to be oriented towards the interior of the loop. 2AP placed at the 3′ end of the loop, stacked on the 3′ side with a G at the top of the stem, was quenched more efficiently than 2AP within the loop and showed the lowest destacked population. Interestingly, Gelot et al. subsequently made ultrafast fluorescence measurements on the same 2AP-containing loop structures (Gelot et al. Reference Gelot, Touron-Touceda, Cregut, Leonard and Haacke2012). For 2AP within the loop, two ultrafast decay components, of 3–5 and 10–40 ps, were revealed, with combined amplitudes consistent with the fractional population of the dark species estimated by Godet et al. For the most highly quenched 2AP, at the 3′ end of the loop, a third, sub-picosecond component was detected. There was good agreement between the quantum yields derived from the ultrafast decay parameters and those from the fluorescence intensities, showing that there remained no undetected decay processes faster than the 0·3-ps time resolution of the measurements. In further agreement with the observations of Mély et al., (Avilov et al. Reference Avilov, Piemont, Shvadchak, De Rocquigny and Mely2008), the sub-5 ps decay components were found to be entirely suppressed in the presence of 70% glycerol.
To assist in the development of a Holliday junction-based nanoswitch for detection of single-nucleotide mismatches in unlabelled targets, Campbell et al. use the fluorescence decay of 2AP positioned at the branchpoint to probe the conformation (switch state) and to detect structural differences arising from hybridization of matched and mis-matched targets (Campbell et al. Reference Campbell, Mountford, Stoquert, Buck, Dickinson, Ferapontova, Terry, Beattie, Walton, Crain, Ghazal and Mount2009). The decay parameters reported enhanced base-stacking at the branchpoint on switch closure and could resolve variations in switch structure that enabled discrimination between target mutations that were indistinguishable from steady-state measurements.
We used 2AP time-resolved fluorescence to complement single-molecule, multi-parameter FRET measurements to investigate branchpoint expansion in a three-way junction (Sabir et al. Reference Sabir, Toulmin, Ma, Jones, Mcglynn, Schroder and Magennis2012). While single-molecule time-resolved FRET delivers the three-dimensional (3D), global structure (in solution), the 2AP decay reports the local conformation at the single-base level. Having established the response of 2AP decay parameters to unpairing (as discussed above), measurement of the decay of 2AP placed at strategic positions in the junction structure confirmed that bases adjacent to the branchpoint are unpaired (despite the full Watson–Crick complementarity of the molecule), as had been inferred from the FRET-derived structure. As illustrated in Fig. 7, the decay of 2AP located in the junction arms, distant from the branchpoint, closely resembled that of the corresponding duplex, whereas the decay of 2AP lying adjacent to the branchpoint tended towards the single-strand, signifying local unpairing.
Comparison of the 2AP fluorescence decay in a three-way DNA junction (3WJ) to the corresponding decays for single-stranded (SS) and duplex (DS) DNA. (a) The three-way junction sequence and positions at which the 2AP base (P) was placed. (b) The fluorescence decays of a 3WJ (blue), with 2AP adjacent to the branchpoint, and of the respective SS (black) and DS (red). (c) The fluorescence decays of a 3WJ (blue), with 2AP distant from the branchpoint, and of the respective SS (black) and DS (red).
Kimura et al. reported fluorescence lifetime measurements on 2AP-containing G-quadruplexes, to complement fluorescence intensity measurements (Kimura et al. Reference Kimura, Kawai, Fujitsuka and Majima2004, Reference Kimura, Kawai, Fujitsuka and Majima2007). However, the value of these measurements, made using a streak camera, is doubtful, since only two (sub-nanosecond) decay components are reported for duplexes and one component for G-quadruplexes. This is due, presumably, to the limited time range that can be covered, precluding the measurement of the longer decay components. The lifetime measurements provide no additional insight into the conformational change from duplex to quadruplex beyond that deduced from intensity changes. In a more recent study, Buscaglia et al. employed (unusually for 2AP) frequency-domain measurements, rather than TCSPC (time-domain) to explore G-quadruplex structure and stability (Buscaglia et al. Reference Buscaglia, Jameson and Chaires2012). However, this paper is mainly concerned with promoting the use of phasor diagrams as model-free graphical representations of frequency-domain lifetime data, rather than an interpretation of decay parameters derived from exponential fitting. Phasor diagrams cannot provide high-resolution structural information but may be of value in monitoring changes in G-quadruplex conformation driven by changes in solution conditions.
Continuing their theme of utilizing 2AP-containing poly-adenine strands to investigate site-specific dynamics, the Rao group turned their attention to TAT triple helices (Ramreddy et al. Reference Ramreddy, Kombrabail, Krishnamoorthy and Rao2009). Significant findings of this work were the absence of the very short (<100 ps) decay component for 2AP in triplexes, implying a decrease in near-neighbour base-stacking interaction compared with duplexes, and an increase in the amplitude of the longest lifetime component, indicating a greater propensity for 2AP to occupy an extra-helical conformation. Strikingly, the decay data also revealed an asymmetry in the base dynamics at the two ends of the triplexes: the 5′ end of the A strand showed a higher degree of base stacking (more duplex-like) than the 3′ end. This was taken to reflect an asymmetry in the strength of the Hoogsteen base-pairing of the T strand with the A–T duplex, such that the triplex nature is more dominant towards the 3′ end.
4. 2AP as a probe of the DNA–enzyme interface
The supreme sensitivity of the 2AP fluorescence response to changes in its environment is something of a ‘double-edged sword’. Such sensitivity is exactly what we would hope for in a fluorescence reporter but the context of this reporting, i.e. the highly dynamic DNA duplex, makes quantitative interpretation of the signal extremely challenging. The magnitude of this challenge has been highlighted in the literature over several attempts to utilize changes in the fluorescence intensity of 2AP as a means to study enzyme-induced deformations of the DNA duplex. We discuss here the successful use and limitations of 2AP intensity as a probe of these systems and highlight the application of time-resolved fluorescence as a means for deriving greater insight and more quantitative information on the system of interest.
One important point to address here is the rationale behind using a non-natural base to probe a process such as base flipping. Indeed, both base pairing/stacking and the interactions that are formed by flipped bases in enzyme catalytic pockets tend to be highly specific. Hence, it is unreasonable to attempt an absolute quantitative assessment of the extent of base flipping using 2AP. Rather, as we shall show, 2AP is typically employed as a comparative measure of the key components of the flipping process using a range of complementary experiments (mutations, DNA sequence variations, etc.).
Towards the end of the 1980s the synthesis of DNA oligonucleotides was becoming increasingly routine such that (in principle) any laboratory could prepare short DNA molecules to study. This evolution in DNA synthesis played a central role in the story of 2AP, which despite its characterization in the 1960s, was not fully utilized as a probe of DNA structure until the early- to mid-1990s. These first studies utilized 2AP fluorescence intensity to report on the kinetics of DNA unwinding by a DNA helicase (Raney et al. Reference Raney, Sowers, Millar and Benkovic1994) and DNA melting and nucleotide incorporation by polymerase enzymes (Frey et al. Reference Frey, Sowers, Millar and Benkovic1995; Hochstrasser et al. Reference Hochstrasser, Carver, Sowers and Millar1994).
4.1 Base flipping: an extreme example of enzyme-induced distortion
Perhaps the first example of the use of 2AP to probe the DNA–enzyme interface was described in 1996 (Allan & Reich, Reference Allan and Reich1996). This study focussed on the DNA methyltransferase enzyme, M.EcoRI, an enzyme that is naturally found in the Eschericia coli bacterium, and set out to better understand the remarkable distortion of the DNA duplex, known as base (nucleotide) flipping, that is performed by this class of enzymes (among others). Here, we give a brief ‘aside’ on the DNA methyltransferase enzymes because of their critical role in the discovery of base flipping and the development of 2AP as a probe of base-flipping enzymes.
The DNA methyltransferases are present in both pro- and eukaryotic organisms and though their functions at the atomic-level are similar in these hosts (i.e. methylation of the DNA bases) the impacts of these methylation events are quite distinct (Jeltsch, Reference Jeltsch2002). In bacteria, for example, DNA methylation is a mechanism used by the bacterium to prevent digestion (cutting) of its own genome by the restriction enzymes it produces. Hence, both the DNA methyltransferases and restriction enzymes from the same host organism typically function symbiotically, targeting the same 4–8 base-pair recognition sites for modification and cleavage. This is part of a defence mechanism in bacteria against viral invasion. In mammals, methylation plays a critical role in health and development through the regulation of genes. Here, however, the methylation machinery is rather more involved, with multiple enzymes contributing to the maintenance of methylation at 5′-CG-3′ sites across the genome.
In bacteria, there are many hundreds of known DNA methyltransferase enzymes and thousands have been predicted from genomic DNA sequences, largely thanks to their homology with other methyltransferases. They ordinarily methylate one of the bases within their target recognition sequence, either an adenine (at the N6 atom) or a cytosine (C5 or N4 atoms). For example, the M.EcoRI targets the central adenine of the six-base motif 5′-GAATTC-3′ for methylation. In both prokaryotic and eukaryotic methylation, the methyltransferases catalyse the transfer of a methyl-group from the small cofactor molecule, S-adenosyl-L-methionine, to a DNA base (adenine or cytosine).
Like most enzymes, the methyltransferases perform chemistry that is remarkable when compared with what is possible on the benchtop. The basis for the process of DNA methylation was revealed for the first time when crystallographers were able to trap the M.HhaI DNA methyltransferase in a ternary complex with DNA and a cofactor analogue, as illustrated in Fig. 8. This amazing snapshot of methylation in action showed M.HhaI bound to its DNA target site with its target base for methylation flipped completely from the DNA duplex and into its catalytic pocket. This process is necessary because the enzyme needs to bring the base that it methylates into close proximity to the cofactor (S-adenosyl-L-methionine) from which it sources the methyl-group. Once flipping is complete, the enzyme is able to catalyse the methyl-transfer reaction.
Views from a crystal structure (PDB ID: 3MHT) showing base flipping of cytosine by M.HhaI (yellow), (a) looking from the side of the duplex and (b) looking down the axis of the duplex. DNA is shown in red with the S-adenosyl-L-homocysteine cofactor analogue in pale blue.
The remarkable DNA distortion performed by M.HhaI (in the absence of any external source of chemical energy, such as ATP) changed the way in which scientists perceived the DNA duplex. DNA has two seemingly opposed functions, acting as a stable store for vast quantities of genetic information yet at the same time being an accessible, readable molecule that is able to interact with the multitude of proteins, enzymes and other molecules that our cells rely upon to survive. The DNA duplex structure inferred by Watson and Crick satisfies the former function but not necessarily the latter. In order to be accessible, the duplex must be dynamic and the M.HhaI structure captured the most extreme distortion of DNA duplex conformation, for all to see. Of course, the immediate question, in the wake of the M.HhaI crystal structure was whether M.HhaI was a special case or if base flipping was a more general mechanism used not only by the methyltransferase enzymes to access their target bases but by all enzymes which might need to locally melt the DNA duplex to access its information, modify or repair it.
4.2 The fluorescence intensity of 2AP as a probe of base flipping
Since the creation of an enzymatic ternary complex in a crystal is very demanding, the search for other options to study this process in solution phase began, with 2AP being top of the list of possible probes for base-flipping enzymes. Allan and Reich (Allan & Reich, Reference Allan and Reich1996) synthesized short DNA duplexes, containing the recognition sequence for M.EcoRI (GAATTC, where the underlined adenine is the target for methylation), where 2AP was placed at the target site for methylation/ flipping, in place of adenine. Upon binding of M.EcoRI to this substrate (in the presence of a cofactor analogue) an increase in the fluorescence intensity of the 2AP of around 14-fold was observed. Hence, the authors rightly concluded that 2AP was shown to be a useful probe of the disruption of the DNA duplex (likely base flipping) by M.EcoRI. However, the interpretation of their results was not entirely straightforward. The observed increase in intensity of the 2AP emission was around two-fold less than expected (compared with the free nucleoside) and it was accompanied by a significant (10 nm) hypsochromic shift of the 2AP emission spectrum. Allan and Reich tentatively attributed the low fluorescence enhancement to the fact that M.EcoRI can bind in two possible orientations to its recognition site and implied that only half of the available 2AP may be flipped from the duplex at any given time. However, there is some indication here (i.e. both the spectral shift and ‘quenching’ relative to the free nucleoside) that the interaction between 2AP and enzyme can be as critical in determining its photophysical properties as that between 2AP and the DNA duplex.
Subsequent studies using 2AP to monitor base flipping showed further unravelling of the complex relationship between the environment of 2AP and its photophysical behaviour. Holz et al. (Reference Holz, Klimasauskas, Serva and Weinhold1998) applied similar methodology to Allan and Reich to compare base flipping by the prototypical M.HhaI with M.TaqI (an N6-adenine methyltransferase). Both enzymes show increase in 2AP fluorescence intensity upon enzyme binding and base flipping (of the 2AP) but the magnitude of the intensity increase is significantly different in each complex; 54-fold for M.HhaI and 14-fold for M.TaqI. A later study (Gowher & Jeltsch, Reference Gowher and Jeltsch2000) using the same assay to probe DNA duplex disruption by M.EcoRV confirmed the unpredictable response of the 2AP fluorescence intensity to base flipping. This enzyme targets the six-base sequence 5′-GATATC-3′ for methylation. When 2AP was substituted for the target adenine base, no significant increase in fluorescence intensity was observed upon ternary (EcoRV+DNA+cofactor analogue) complex formation. Indeed, this enzyme, known to bend the DNA duplex at its target binding site, gave a significant (11-fold) increase in 2AP fluorescence intensity upon ternary complex formation when the 2AP was substituted for the central (unflipped) adenine of the recognition sequence. Similar behaviour was observed for the EcoP15 enzyme (Reddy & Rao, Reference Reddy and Rao2000) which recognizes the six-base target CAGCAG. 2AP was substituted for each of the adenine bases in the enzyme's recognition sequence and a fluorescence enhancement of similar proportions was observed for 2AP at either site, upon enzyme binding. However, more complex photophysical behaviour from 2AP has been observed for the EcoKI DNA methyltransferase enzyme (Su et al. Reference Su, Connolly, Darlington, Mallin and Dryden2004). This enzyme gives a significant (fourfold) increase in 2AP intensity upon base flipping but also shows the formation (on the timescale of several minutes) of a new species with red-shifted excitation and emission spectra, relative to 2AP.
Taken together, these results are complex and confusing but the interesting question is whence this confusion arises? As we now know from studies on the DNA duplex alone, the fluorescence response of 2AP is quite predictable; by and large stacking results in quenching. What cannot be easily predicted is the myriad of conformations that the DNA duplex can adopt, and the specific interactions that can be formed between the 2AP and its environment, especially when it is complexed by an enzyme. Even though base flipping appears a simple ‘in’ or ‘out’ question it involves a complex series of interactions between the 2AP probe, the DNA duplex and the amino acids that comprise the enzyme.
The studies highlighted here show that, while the steady-state fluorescence intensity of 2AP can often provide good evidence for a distortion of the DNA duplex, it cannot be used reliably to identify nor quantify a specific rearrangement of the duplex. We lose much of the useful information that is provided by the 2AP because we observe the steady-state fluorescence intensity, which is an average signal from the entire 2AP population. One way to access this information is to look at the time-resolved fluorescence response of 2AP.
4.3 The fluorescence decay of 2AP as a probe of base flipping
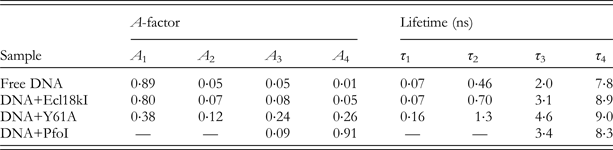
Following the lead of those groups pioneering the application of 2AP to study DNA duplex structure and dynamics, we employed TCSPC to study base flipping by a number of DNA methyltransferases, M.HhaI (Neely et al. Reference Neely, Daujotyte, Grazulis, Magennis, Dryden, Klimasauskas and Jones2005), M.TaqI (Lenz et al. Reference Lenz, Bonnist, Pljevaljčić, Neely, Dryden, Scheidig, Jones and Weinhold2007), M.EcoRV (Bonnist et al. Reference Bonnist, Liebert, Dryden, Jeltsch and Jones2012), M.EcoKI (Neely, unpublished work) and restriction enzymes, R.Ecl18kI, R.PspGI, R.EcoRII and R.PfoI (Neely et al. Reference Neely, Tamulaitis, Chen, Kubala, Siksnys and Jones2009), all of which were suspected or known base flippers. In short, we found that for every system, unlike the analogous steady-state measurements, there is a clear response to base flipping from the 2AP. Rather than deriving an overview of the average behaviour of the fluorophores within the ensemble (as seen in steady-state measurements) the fluorescence lifetimes reveal information about the heterogeneity of the ensemble, derived from the interaction between 2AP and enzyme and the dynamics of the flipping process.
The value of using a time-resolved measurement is clearly illustrated for the comparison of base flipping by M.HhaI and M.TaqI. In the fluorescence spectrometer, the fluorescence intensity arising from the free DNA duplexes containing 2AP is barely perceptible. Holz et al. (Reference Holz, Klimasauskas, Serva and Weinhold1998) showed that upon enzyme binding and base flipping of 2AP from these duplexes large increases in fluorescence intensity of 54-fold and 14-fold are observed for M.HhaI and M.TaqI, respectively. This disparate behaviour is puzzling since we naively expect that 2AP fluorescence is simply quenched when the base is stacked in the duplex and not quenched when the base is unstacked. The fact that the increase in intensity is not so great for flipping by M.TaqI as it is for M.HhaI (despite using saturating enzymatic conditions) cannot be readily explained from steady-state data alone. When we observed the fluorescence decay of 2AP-labelled DNA bound and flipped by M.HhaI we saw a dramatic fluorescence response that could be readily rationalized from earlier studies of 2AP in the duplex. As shown by the decay parameters in Table 4, the 2AP fluorescence response changes dramatically upon formation of the ternary complex. Indeed, we observe a significant increase in the fraction of 2AP molecules with lifetimes of around a nanosecond or longer (τ 2−τ 4) and a general increase of all of these lifetimes. Most noteworthy, however, is the significant reduction of A 1 on ternary complex formation, indicating a decrease in the amount of highly stacked 2AP in the DNA duplex. We confirmed the specificity of this result with a series of control experiments with 2AP at different locations in the DNA duplex, relative to the target site for flipping and concluded that, along with the corroborating biochemical and crystallographic data, the observed change in the 2AP response was indeed the fluorescence signature for base flipping.
Fluorescence response of 2AP in an unbound DNA duplex and in ternary complex with wild-type M.HhaI and cofactor, with 2AP at the target site for flipping
We subsequently moved on to look at the analogous behaviour of the M.TaqI enzyme (target site TCGA) in the hope of better understanding the reasons for the discrepancy in the steady-state fluorescence response to base flipping of 2AP by each enzyme. As shown in Table 5, the response of 2AP to base flipping by M.TaqI is quite dissimilar to that seen for base flipping by M.HhaI. The fluorescence response of the 2AP population complexed by M.HhaI is dominated by a slow ~11 ns component, whereas that of the 2AP population complexed by M.TaqI decays much more rapidly, with a lifetime of around 0·5 ns. Figure 9 summarizes this contrasting photophysical behaviour.
Plot of amplitudes (A-factors) versus lifetimes for DNA duplexes containing 2AP at the target site for flipping, in ternary complexes with either M.HhaI (blue diamonds) or M.TaqI (red squares) and cofactor (S-adenosyl-L-methionine).
Fluorescence response of 2AP in an unbound DNA duplex and in ternary complex with wild-type M.TaqI and cofactor, with 2AP at the target site for flipping

Critically, the very short decay component, τ 1, characteristic of a stacked 2AP population is completely absent from the decay of the MTaqI-complexed DNA duplex. We have already noted that this very shortest component (typically around 100 ps) of the 2AP decay is the result of de-excitation via electron transfer along the DNA duplex. We observed a dramatic reduction in the contribution of this component to the fluorescence decay upon base flipping by both M.HhaI and M.TaqI, showing a significant reduction in the fraction of the 2AP population that is stacked in the DNA duplex. In other words, the suggestion here is that, in the ternary complexes with both enzymes most, or the vast majority of, the 2AP population is in an extrahelical location. The differences that are observed in the time-resolved and steady-state fluorescence responses of these systems to base flipping are not related to base flipping or the lack of it but, rather, are derived from the fact that the 2AP is being flipped into quite distinct atomic environments in M.HhaI and M.TaqI.
We were able to dig a little further into the interpretation of the solution phase fluorescence response of 2AP in these complex molecular systems by recording the 2AP fluorescence response on single crystals formed from 2AP-modified DNA in ternary complexes with the M.HhaI and M.TaqI enzymes. In the case of M.HhaI, the ternary complex with the wild-type enzyme proved difficult to crystallize and so we resorted to studying a mutant (T250G) of this enzyme that is catalytically active and which shows a 100-fold increase in 2AP fluorescence intensity upon base flipping. The ternary complex with this enzyme crystallized readily, because of the pocket that is created in the enzyme by the T250G mutation, Fig. 10.
Structures of M.HhaI in the region around residue 250. (a) Wild-type enzyme with flipped cytosine base in the enzyme active site (PDB ID: 3MHT); (b) T250G mutant with flipped 2AP base occupying the void created by the T250G mutation (PDB ID:2C7R). Note that the R165 residue has apparently been displaced into the region defined as the enzyme ‘active site’ for the wild-type M.HhaI.
Figure 11 shows the crystal structures of the M.HhaI and M.TaqI ternary complexes in the immediate vicinity of the flipped 2AP base.
The immediate environment of 2AP (yellow) in crystalline ternary complexes of the T250G M.HhaI mutant (cyan) (PDB ID: 2C7R) and the wild-type M.TaqI (blue) enzyme (PDB ID: 2IBS).
Naively, we had anticipated that the 2AP population in the crystals would be both static and uniform and as a result, we would observe a simple, single exponential fluorescence decay from these samples that would allow us to accurately quantify the extent of base flipping in the solution phase. However, fluorescence responses from both crystals, shown in Table 6, require at least three decay components for a good fit, indicating a rather more complex, heterogeneous or dynamic crystal than imagined. This may, in part, be derived from the fact that the crystals from which we recorded fluorescence decays were at room temperature, allowing some thermal motion of the complexes therein.
Fluorescence response of 2AP in DNA at the target site for base flipping in ternary complexes in the crystal phase with T250G M.HhaI or wild-type M.TaqI enzymes
This highlights a very important feature of protein crystallography and our interpretation of the amazing images that can be derived; these images show only a snapshot of the multitude of conformations that the ensemble can adopt in the solution phase. In fact, they may not even represent the most populated state in the solution phase and as such, the achievable mechanistic insight for a complex enzymatic pathway, such as base flipping, is limited. This insight can be greatly extended by use of a complementary approach, such as time-resolved fluorescence, which derives information on the behaviour of an ensemble in the solution phase.
Indeed, we can clearly correlate some features of the fluorescence and structural data, thereby linking the static crystal snapshot with some of the behaviour we observe by time-resolved fluorescence studies in the solution phase. The complexes in both crystals display a 2AP fluorescence decay that can be fit using only three exponential components. The shortest lifetime component of the decays has been lost, indicating that, despite the apparent heterogeneity, there is no 2AP in the crystals that is stacked in the DNA duplex. The distribution of the 2AP population is quite different in each complex from the lifetime data. This can be correlated with the structures shown in Fig. 11 which indicate that the environment into which the 2AP is moved by the enzyme is quite distinct for M.HhaI (T250G mutant) and TaqI. Indeed, in the M.HhaI crystal structure the 2AP is surrounded by polar or charged groups and interacts closely with the phosphate group 5′- of it and with arginine residues from the M.HhaI. In M.TaqI, however, the 2AP is stacked between tyrosine 108 (shown behind the 2AP in Fig. 11) and valine 21. Its environment contains many apolar amino acids and it is π-stacked with an aromatic residue We know from studies made in solution on 2AP or its ribonucleoside that the fluorescence lifetime of 2AP is sensitive to polarity, dropping by about a factor of five when going from pure water to pure 1,4-dioxane. Moreover, 2AP fluorescence can be rapidly quenched by electron transfer from tyrosine (or tryptophan) (Harriman, Reference Harriman1987; Wan et al. Reference Wan, Xia, Becker and Zewail2005; Xia et al. Reference Xia, Becker, Wan, Frankel, Roberts and Zewail2003), in an analogous fashion to electron transfer quenching of intrahelical 2AP by guanine; this accounts for the observation of a sub-nanosecond decay component for the flipped 2AP in M.TaqI. We observed subsequently (Bonnist, Reference Bonnist2008; Bonnist & Jones, Reference Bonnist and Jones2008) that the close stacking interaction of 2AP with tyrosine 108 in the M.TaqI active site also gives rise to red-shifted fluorescence, analogous to that seen for 2AP in DNA (Bonnist & Jones, Reference Bonnist and Jones2008). This provided the explanation for the unusual emission reported previously for 2AP flipped into M. EcoKI (Su et al. Reference Su, Connolly, Darlington, Mallin and Dryden2004), where 2AP stacks closely with an aromatic residue in the active site, in this case phenyalanine.
These two studies, allowed us to link the fluorescence response of 2AP to specific molecular environments and have informed more recent work on a subset of base flipping restriction endonucleases (Neely et al. Reference Neely, Tamulaitis, Chen, Kubala, Siksnys and Jones2009), on the M.EcoRV and M.EcoRI methyltransferases (Bonnist et al. Reference Bonnist, Liebert, Dryden, Jeltsch and Jones2012; Youngblood et al. Reference Youngblood, Bonnist, Dryden, Jones and Reich2008), the Type III EcoP15I restriction-modification system (Ma et al. Reference Ma, Wu, Wilson, Jones and Dryden2014), the flap endonuclease-1 (Finger et al. Reference Finger, Patel, Beddows, Ma, Exell, Jardine, Jones and Grasby2013) and on the archaeal family-B DNA polymerase, Pfu-Pol (Richardson et al. Reference Richardson, Wu, Keith, Heslop, Jones and Connolly2013). In all of these systems, the basis of the interpretation of the 2AP signature is similar to that outlined using M.HhaI and M.TaqI. However, each system has its own idiosyncrasies and as the dataset expands, so does our ability to interpret the 2AP fluorescence response.
Our work on M.EcoRV (Bonnist et al. Reference Bonnist, Liebert, Dryden, Jeltsch and Jones2012) illustrates the ability of time-resolved fluorescence to clarify the different response to enzyme binding of 2AP placed at different positions within the recognition sequence, thereby resolving the apparently anomalous observation from steady-state measurements that 2AP substituted for the non-target adenine in the recognition sequence showed a much greater intensity increase than 2AP at the target site (Gowher & Jeltsch, Reference Gowher and Jeltsch2000). The fluorescence decay parameters showed that the target 2AP is indeed flipped by the enzyme, but its fluorescence is quenched by interaction with aromatic residues in the catalytic site, whereas bending of the duplex at the non-target site alleviates interbase quenching and exposes the 2AP to solvent. Furthermore, information on the conformational populations that can be gleaned from the decay parameters supported previous evidence for specific and non-specific binding.
A nice example of two very different fluorescence responses from 2AP flipped into an enzymatic environment comes from the Ecl18kI and PfoI restriction enzymes. These enzymes recognize the sequences CCNGG and TCCNGGA, respectively and in nature, make a sequence-specific, double-stranded DNA break at these sites. A surprising, yet critical part of this cleavage mechanism is base flipping. The central base of the recognition sequences (‘N’=any base) was found, in the Ecl18kI crystal structure, to be flipped from the DNA duplex on both sides of the duplex. This leads to a collapse of the DNA duplex and an effective shortening of its length while bound to the enzyme (Bochtler et al. Reference Bochtler, Szczepanowski, Tamulaitis, Grazulis, Czapinska, Manakova and Siksnys2006). Steady-state measurements using 2AP at the target site for flipping confirmed the flipping in the solution phase and also identified the analogous EcoRII and PspGI enzymes (recognizing the same sequence) as base flipping enzymes. Interestingly, the Ecl18kI enzyme forms a stacking interaction via tryptophan 61 to the base that is flipped from the duplex. When we examined the fluorescence response of 2AP flipped into these pockets of Ecl18kI we saw almost no perceptible change in the fluorescence response of the 2AP compared with the unbound DNA duplex, as shown in Table 7.
Fluorescence response of free DNA containing 2AP and this same DNA duplex bound by either wild-type Ecl18kI, the W61A mutant of Ecl18kI or PfoI, where 2AP is flipped from the duplex into a pocket of the enzyme
As we found with studies on M.HhaI and M.TaqI, the real power of the time-resolved measurements is realized when combined with either biochemical or structural information that leads to new understanding about the enzyme-DNA complex. In the case of Ecl18kI, the wild-type enzyme was mutated to replace the tryptophan residue that stacks with 2AP in the flipping pocket with an alanine residue. The fluorescence response of 2AP bound by this W61A mutant far more closely resembles that of the familiar flipped 2AP in complex with M.HhaI. This observation confirms the efficient quenching of 2AP fluorescence via stacking with the tryptophan 61 residue, resulting in a short lifetime component for 2AP flipped into the wild-type active site, comparable to that seen for intrahelical 2AP quenched by G. By contrast, base flipping by PfoI could barely be more simple to interpret. The 2AP decay becomes almost mono-exponential with 90% of the 2AP population having a lifetime similar to that of the free 2AP ribonucleoside. Hence, in this enzyme, 2AP is efficiently flipped into a hydrophilic or solvated environment and is effectively prevented from returning to the DNA duplex.
The seemingly similar Ecl18kI and PfoI enzymes act to stabilize their flipped bases using completely different mechanisms. Using time-resolved fluorescence to study this process not only reveals the dramatic extent of their disparate behaviour but allows us to gain some insight into what causes it. The extra information that the fluorescence decay yields enables greater understanding of (in this case) the base flipping process and when this is combined with complementary structural or biochemical studies, entirely new insight can be derived.
4.4 The fluorescence decay of 2AP as a probe of other enzyme-induced distortions
The use of 2AP time-resolved fluorescence to elucidate DNA–protein interactions is not limited to the study of base flipping. Further, more subtle binding-induced deformations can be addressed, as exemplified by the following studies.
Reha-Krantz et al., have used 2AP decay measurements in a series of investigations of the interactions of Bacteriophage T4 DNA polymerase with DNA (see, for example, Hariharan & Reha-Krantz, Reference Hariharan and Reha-Krantz2005; Reha-Krantz, Reference Reha-Krantz2009; Subuddhi et al. Reference Subuddhi, Hogg and Reha-Krantz2008; Tleugabulova & Reha-Krantz, Reference Tleugabulova and Reha-Krantz2007). These measurements have been made using a stroboscopic optical boxcar technique (James et al. Reference James, Siemiarczuk and Ware1992) which delivers lower time resolution and lower quality data than the other studies (employing TCSPC) considered in this review. This prevents the detection of short-lifetime components (less than about 200 ps) and compromises the reliability of multi-exponential fitting, precluding a detailed interpretation of the conformational behaviour. Nevertheless the time-resolved measurements have proved a valuable supplement to intensify data. In particular they have enabled the empirical identification of functionally different complexes, based on the dominance of different 2AP decay times.
Mély et al., have used 2AP in mechanistic studies of the role of NC in the lifecycle of human immunodeficiency virus type 1 (HIV-1) (Avilov et al. Reference Avilov, Piemont, Shvadchak, De Rocquigny and Mely2008, Reference Avilov, Godet, Piemont and Mely2009; Godet et al. Reference Godet, Ramalanjaona, Sharma, Richert, De Rocquigny, Darlix, Duportail and Mely2011). NC is a 55 amino acid protein which contains two highly conserved zinc fingers. In an initial study (Avilov et al. Reference Avilov, Piemont, Shvadchak, De Rocquigny and Mely2008), they demonstrated the ability of 2AP time-resolved fluorescence to report on the dynamics of target hexanucleotides in complex with NC. Site-specific changes in oligonucleotide dynamics were observed during NC binding and correlated with the known 3D structure of the complex. The 2AP decay parameters were interpreted to show that NC strongly restricts the oligonucleotide flexibility. This conformational ‘freezing’ seemed to be mainly supported by the folded zinc finger domain of the NC. Use of NC mutants allowed the restriction of local base dynamics to be more specifically attributed to the hydrophobic platform at the top of the folded fingers and to be identified with base interaction with specific aromatic residues. They then examined site-specific binding of NC to 2AP-substituted dodecanucleotides containing two binding sites (TG motifs) (Avilov et al. Reference Avilov, Godet, Piemont and Mely2009). Lifetime measurements again showed that NC-binding inhibits conformational fluctuations of the oligonucleotides and strongly decreases the population of fully stacked conformations. 2AP at a given position was found to respond mainly to the binding of NC to its closest TG motif, enabling site-specific investigations of NC binding to oligonucleotides with multiple binding sites. In a subsequent study (Godet et al. Reference Godet, Ramalanjaona, Sharma, Richert, De Rocquigny, Darlix, Duportail and Mely2011), they investigated the role of the nucleopcapsid zinc fingers in the mechanism of synthesis of HIV-1 viral DNA, a complex multi-step process catalysed by the viral reverse transcriptase. The mechanism involves two obligatory strand transfer reactions, the second of which relies on the annealing of two primer-binding site (PBS) DNA stem loops, which is chaperoned by NC. By exploiting sequence-specific insertion of 2AP into PBS loop sequences and site-specific mutations of NC, Godet et al. were able to show that NC can freeze PBS conformations competent for annealing via the loops and, moreover, the modifications to the loop structure and dynamics that govern the annealing reaction are dependent on the integrity of the zinc finger hydrophobic platform.
As discussed above (Section 3.2), the fluorescence decay of 2AP is sensitive to local disruption of base pairing. We have exploited this to investigate two cases in which enzyme-induced duplex unpairing had been postulated to be mechanistically essential, but for which there was no direct evidence: unwinding of primer-templates by an archaeal DNA polymerase (Richardson et al. Reference Richardson, Wu, Keith, Heslop, Jones and Connolly2013) and unpairing of substrate by a flap endonuclease (Finger et al. Reference Finger, Patel, Beddows, Ma, Exell, Jardine, Jones and Grasby2013).
Archaeal family-B DNA polymerases bind tightly to deaminated bases and stall replication on encountering uracil in template strands, four bases ahead of the primer–template junction (+4 position). Should the polymerase progress further towards the uracil, for example to a position where uracil is only two bases in front of the junction (+2 position), 3–5′ proof-reading endonuclease activity is stimulated to trim back the elongating primer and re-sets uracil to the +4 position. This uracil-sensing process serves to prevent the inappropriate copying of the deaminated base and the introduction of mutations into the genome. The polymerase and exonuclease domains of DNA polymerase are well separated and unwinding of the primer to expose a short, single-stranded region is required to position the three-terminal base of the primer in the exonuclease active site. The aim of our study (Richardson et al. Reference Richardson, Wu, Keith, Heslop, Jones and Connolly2013) was to test the hypothesis that if the polymerase approaches closer than four bases to uracil, the primer strand starts to unravel. The fluorescence decay parameters of 2AP showed clearly that binding of the polymerase caused pronounced unwinding of primer–template with uracil at the +2 position, whereas, with uracil at the +4 position, only minor distortion of the duplex structure occurred.
Flap endonuclease-1 (FEN-1) is a structure- and strand-specific phosphodiesterase that catalyses the essential removal of 5′-single-stranded flaps during DNA replication and repair. FEN-1 achieves this by selectively catalysing hydrolysis one nucleotide into the duplex region of the substrate, always targeting the 5′ strand. This specificity had been proposed to arise by unpairing of the 5′end of the duplex to permit the scissile phosphate diester to contact catalytic divalent metal ions in the active site. Using 2AP decay data, in conjunction with low-energy CD, enabled us (Finger et al. Reference Finger, Patel, Beddows, Ma, Exell, Jardine, Jones and Grasby2013) to provide the first direct evidence of unpaired conformations in DNA substrates bound to FEN-1 and to elucidate the role of 5′-nuclease superfamily conserved (K93, R100) and semi-conserved (Y40) residues in unpairing and stabilization of unpaired bases in the substrate and product complexes.
5. Extension of fluorescence decay measurements to ultrafast timescales
Fluorescence lifetime measurements can be extended to the ps and sub-picosecond timescale, beyond the resolution of TCSPC, by the use of the ultrafast, pump–probe technique of fluorescence up-conversion (or down-conversion). There are few groups equipped to carry out such measurements at the ultraviolet wavelengths required for 2AP and activity in this area has been dominated by Xia and co-workers who have focused mainly on the study of 2AP in RNA. Their work is the subject of a mini-review (Xia, Reference Xia2008) and will not be discussed further here.
To our knowledge there is only one example in the literature of directly comparable TCSPC and ultrafast fluorescence decay measurements on the same DNA system, the studies of Godet et al. (Reference Godet, Ramalanjaona, Sharma, Richert, De Rocquigny, Darlix, Duportail and Mely2011) and Gelot et al. (Reference Gelot, Touron-Touceda, Cregut, Leonard and Haacke2012), respectively, on 2AP-containg DNA hairpins. The TCSPC study reports typical four-component decays with lifetimes of ~100 ps, ~700 ps, ~3 ns and ~8 ns, together with an unresolvable dark species which accounts for about 80% of the 2AP population (as discussed in Section 3.3 above). The decays measured by femtosecond fluorescence down-conversion are also fitted by four exponential components, with lifetimes of ~3 ps, ~20 ps, ~100 ps and ~3 ns. The former two ultrashort lifetimes correspond to the dark species, undetectable by TCSPC, while the latter two longer lifetimes can be identified with two of the components measured by TCSPC. The limited time-range (3 ns) of the ultrafast measurements and the impossibility of extracting more than four decay components, means that the four longer decay times measured by TCSPC are compressed into two-components in the ultrafast decay measurement. A complete picture of the decay properties requires the use of both techniques. At present, this is a far-from-practical proposition.
6. Conclusions
Over 40 years since its remarkable fluorescence properties were first reported (Ward et al. Reference Ward, Reich and Stryer1969) 2AP remains unsurpassed as the most widely used fluorescent base analogue and probe of DNA conformation, because of its structural similarity to a natural base, its exquisite sensitivity to interbase interactions and its commercial availability. In spite of its success, 2AP is certainly not without its disadvantages and we will now reflect on these shortcomings and the possibility of improving upon them.
The short, UV excitation wavelength of 2AP is disadvantageous (particularly in the context of time-resolved fluorescence measurements, as discussed below), but is a consequence of its isomeric relationship to adenine. A shift to longer excitation wavelength requires a more delocalized electronic structure and results in greater structural deviation from a natural base.
The complex fluorescence decay of 2AP in DNA may seem disadvantageous, but is a consequence of the highly desirable sensitivity of the fluorophore to interbase quenching; a simpler decay function would be the signature of a less responsive probe. The shortness of its fluorescence lifetime (<100 ps), and consequently low quantum yield, in a fully stacked state is indeed disadvantageous, demanding the use of ultrafast lasers and fast-response detectors to measure its fluorescence decay, and often requiring long data acquisition times because of the low fluorescence intensity. The combination of low quantum yield and the need for UV excitation also makes it unpromising as a probe for single-molecule studies, although we note that detection of 2AP at the single-molecule level in surface-immobilized oligonucleotides has been reported recently (Aleman et al. Reference Aleman, De Silva, Patrick, Musier-Forsyth and Rueda2014).
The short lifetime is, in fact, essential to the wide dynamic range of lifetimes that 2AP exhibits in DNA, which makes its complex mutli-component decay tractable to reproducible and reliable analysis and interpretation. A fluorophore with similar responsiveness but a slower decay time would indeed be welcome in facilitating lifetime measurements, although, to maintain the same dynamic range of lifetimes would inevitably lead to the same low quantum yield for the highly quenched component. Aromatic fluorophores rarely have radiative lifetimes longer than about 100 ns, so an order of magnitude increase in decay times is the best that could be hoped for.
The susceptibility of 2AP to ultrafast quenching, resulting in species which are invisible to all but the most advanced, sub-picosecond measurements, is a cause for concern. This does not prevent the use of 2AP as a very effective probe, but the notion that a vast proportion of the conformational population evades observation is certainly disquieting. The use of ultrafast spectroscopy to provide a window on the ‘dark’ conformations that are invisible to TCSPC is undoubtedly valuable in increasing our understanding of base dynamics and the mechanism of quenching of 2AP in DNA. However, there is no evidence at present to indicate that ultrafast measurements would significantly enhance the utility of 2AP as a probe of DNA–enzyme interaction, even if they were practically feasible. An important, unanswered question is to what extent the dark conformational population(s) might behave differently, in response to enzyme binding, from the populations detectable by TCSPC. More specifically, would changes in the values of the ultrafast lifetimes themselves provide useful additional information or is it the fractional population that conveys the more valuable information? If, as our experience suggests, it is changes in the A-factors that are often more informative, then the most essential information can be gained by the combination of TCSPC and quantitative intensity measurements.
For photophysicists, 2AP is an object lesson in the subtle interplay of electronic states that controls fluorescence properties, and exposes the inadequacy of the current understanding of the excited state properties of complex molecules. We cannot still fully explain the fluorescence properties of 2AP, let alone predict precisely how to go about changing them for the better. Considerable efforts are being devoted to the development of new, environmentally sensitive, fluorescent, isomorphic base analogues (see, for example, Ben Gaied et al. Reference Ben Gaied, Glasser, Ramalanjaona, Beltz, Wolff, Marquet, Burger and Mely2005; Nadler et al. Reference Nadler, Strohmeier and Diederichsen2011; Noé et al. Reference Noé, Sinkeldam and Tor2013; Sinkeldam et al. Reference Sinkeldam, Greco and Tor2010; Wilhelmsson, Reference Wilhelmsson2010), and candidates with promising photophysical properties are emerging. However, there appears to be no immediate prospect of the displacement of 2AP as the base analogue of choice, given its long and successful track record.
In this review we have endeavoured to convey the detailed insight into DNA structure and dynamics, at the single-base level, that can be obtained from time-resolved fluorescence measurements of 2AP. At present, such measurements are restricted to a rather small number of groups because of the relatively sophisticated and costly apparatus required. However, recent and ongoing technological advances promise to make TCSPC measurements with UV excitation and sub-100 ps time resolution much more widely accessible. Compact, easy-to-use and relatively low-cost photonic-crystal-fibre-based supercontinuum (‘white light’) lasers have already started to replace mode-locked Ti:sapphire lasers as the excitation source of choice for TCSPC in the visible wavelength range, and are now beginning to make in-roads into the UV range. On the detection side, single-photon avalanche photodiodes and hybrid photomultiplier tube detectors (combing a photomultiplier tube front-end with an avalanche photodiode amplification stage) are now available as lower cost alternatives to expensive microchannel plate photomultipliers which were previously the only option for TSCPC with high time-resolution. We anticipate that, almost half-a-century since its potential as a fluorescent base analogue was first recognized, 2AP may be set for a revival as a fluorescence-lifetime probe.
7. Acknowledgements
We are indebted to David Dryden for making us aware of 2AP, inspiring us to embark on time-resolved fluorescence studies of base flipping, introducing us to numerous collaborators and being a continuing source of advice and support. We are very grateful to our many collaborators for their invaluable expertise in DNA enzymology and their enormous contribution to our knowledge and understanding of 2AP as a fluorescent probe. We warmly thank Eleanor Bonnist, Xiaohua Wu, Long Ma, Darren Smith and Grant McKenzie, without whose diligent work as PhD students we would not have been in a position to write this article.