Introduction
Herbicide-resistant weeds represent a major problem in agricultural systems worldwide. The almost exclusive reliance on chemical control for weed management during previous decades has led to the rapid evolution of resistance to herbicides spanning 23 of 26 sites of action (SOAs) in 254 different species. Since the beginning of the use of glyphosate in conjunction with glyphosate-resistant crops in 1996, 41 different species have evolved resistance to this single herbicide (Heap Reference Heap2018).
Common waterhemp (Amaranthus tuberculatus (Moq.) Sauer var. rudis (Sauer) Costea and Tardif) is the most problematic weed species in agronomic crops of Illinois, Iowa, and Missouri (Chatham et al. Reference Chatham, Wu, Riggins, Hager, Young, Roskamp and Tranel2015; Legleiter and Bradley Reference Legleiter and Bradley2008; McMullan and Green Reference McMullan and Green2011; Schultz et al. Reference Schultz, Chatham, Riggins, Tranel and Bradley2015), causing yield losses of up to 43% in soybean [Glycine max (L.) Merr.] (Hager et al. Reference Hager, Wax, Stoller and Bollero2002) and 74% in corn (Zea mays L.) (Steckel and Sprague Reference Steckel and Sprague2004). Amaranthus tuberculatus possesses a long germination period, rapid growth rate, and abundant seed production (Tranel and Trucco Reference Tranel, Trucco and Stewart2009). Because it is a dioecious species, obligate outcrossing allows for rapid allele enrichment and recombination associated with strong selection pressures (Busi and Powles Reference Busi and Powles2009). Thus, since the initial report of photosystem II (PSII)-inhibitor herbicide resistance in the early 1990s (Anderson et al. Reference Anderson, Roeth and Martin1996), resistance has rapidly evolved for other SOAs, including acetolactate synthase (ALS), protoporphyrinogen oxidase (PPO), 5-enolpyruvylshikimate-3-phosphate synthase (EPSPS), 4-hydroxyphenylpyruvate dioxygenase, and auxin receptors, with several cases of multiple herbicide resistance to two, three, four, and even five different SOAs in the same population (Bell et al. Reference Bell, Hager and Tranel2013; Foes et al. Reference Foes, Liu, Tranel, Wax and Stoller1998; Heap Reference Heap2018; Legleiter and Bradley Reference Legleiter and Bradley2008). Today, there are 56 unique cases of herbicide resistance reported in A. tuberculatus across 18 U.S. states (Heap Reference Heap2018). While some herbicide-resistance traits are highly localized to specific fields, others are widespread across large regions, as in the case of glyphosate resistance in the midwestern United States (Chatham et al. Reference Chatham, Wu, Riggins, Hager, Young, Roskamp and Tranel2015; Schultz et al. Reference Schultz, Chatham, Riggins, Tranel and Bradley2015; Vieira et al. Reference Vieira, Samuelson, Alves, Gaines, Werle and Krugger2018).
Weed scientists, and slowly farmers, are convinced about the urgent need for diversifying control practices within weed management programs (Norsworthy et al. Reference Norsworthy, Ward, Shaw, Llewellyn, Nichols, Webster, Bradley, Frisvold, Powles, Burgos, Witt and Barrett2012; Pannell et al. Reference Pannell, Tillie, Rodríguez-Cerezo, Ervin and Frisvold2016). Tools that advise producers while generating awareness about best management practices (BMPs) are necessary. Herbicide mixtures that use multiple effective SOAs represent one such BMP (Beckie and Harker Reference Beckie and Harker2017; Heap Reference Heap2014). However, the advantage of using herbicide mixtures is diminished when resistance to one or more mixture components is present within the population. Herbicide-resistance surveys provide insight on the extent of geographical distribution of resistance and potential resistance mechanisms and can facilitate accurate and responsible design of geolocated weed management strategies. These surveys inform management decisions on regional and landscape levels. Herbicide mixtures and rotations with different, effective SOAs in combination with pertinent nonchemical control practices could be specifically recommended for each location under the support of evidence-based field studies. Furthermore, maintaining separation between fields with herbicide-resistant and herbicide-sensitive weeds—through investigating existing pockets of susceptibility—can allow for more control options on a field-by-field basis. Such management practices may limit the spread of resistance.
In addition, the identification of molecular mechanisms endowing resistance to herbicides is a necessary component of field surveillance initiatives. Certain mechanisms are known to cause cross-resistance to some—but not all—classes of herbicides that target the same SOA. For instance, the Tyr-222-Phe mutation of the D1 protein conferring resistance to atrazine, a PSII inhibitor, results in supersensitivity to diuron, another PSII inhibitor of a different chemical family (Oettmeier Reference Oettmeier1999). Moreover, the mechanism of resistance can influence how resistance spreads. Target-site resistance to atrazine is maternally inherited (Oettmeier Reference Oettmeier1999), while non–target site atrazine resistance is inherited in a Mendelian manner (Huffman et al. Reference Huffman, Hausman, Hager, Riechers and Tranel2015). Nuclear inheritance allows for the reliable spread of resistance traits through pollen. Finally, understanding the molecular mechanism(s) endowing herbicide resistance allows the development of molecular markers specific to the mechanism. The discovery of glyphosate resistance mediated through EPSPS gene amplification enabled the development of a quantitative polymerase chain reaction (qPCR) assay to quantify the degree of amplification, enabling routine screening for this mechanism (Gaines et al. Reference Gaines, Zhang, Wang, Bukun, Chisholm, Shaner, Nissen, Patzoldt, Tranel, Culpepper, Grey, Webster, Vencill, Sammons, Jiang, Preston, Leach and Westra2010). If a mechanism—or series of mechanisms—of resistance is determined to be highly prevalent within a region, simply screening for the mechanism(s) may approximate total observable resistance.
Currently, validated reports of herbicide resistance in Ohio are sparse. For the driver weed species A. tuberculatus, resistance to only two SOAs have been reported in the state: resistance to ALS-inhibiting herbicides in soybean fields and to glyphosate in corn and soybean fields (Heap Reference Heap2018). Mechanisms of resistance in these populations have not been elucidated. In other states, A. tuberculatus resistance to PSII-inhibiting herbicides, for example, is widespread (Schultz et al. Reference Schultz, Chatham, Riggins, Tranel and Bradley2015). To inform BMPs in Ohio, the prevalence and distribution of herbicide resistance must be assayed. Furthermore, identification of predominant resistance mechanisms allows for high-throughput screening for resistance spread over time. Knowledge of resistance spread is critical for the management of existing resistant populations and the maintenance of herbicide sensitivity in other populations. In this context, it is pertinent to generate data to prevent this species from becoming as problematic as it already is in other states. The objective of this research was to determine the prevalence of resistance to glyphosate, atrazine, and lactofen in A. tuberculatus from Ohio, as well as the frequency of known mechanisms endowing resistance.
Materials and methods
Seed collection
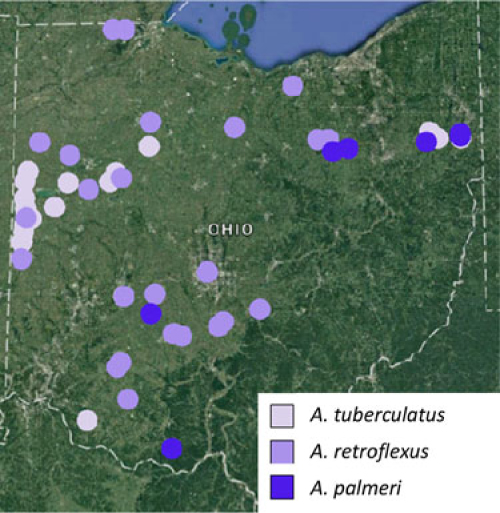
Seeds of Amaranthus spp. populations were collected during a 2016 late-season survey of weed infestations in soybean fields across 51 counties of Ohio (Figure 1). These counties had been planted to at least 4,000 ha of soybeans in prior years. Sampling was restricted to fields with infestation patterns indicative of possible herbicide-resistance issues. Seed samples were a composite of seed from several plants within small areas, to reflect the population present within the sampled field. Species identity for each population was determined through morphological analysis, and A. tuberculatus populations were selected for further analysis.
Distribution of Ohio Amaranthus spp. collected during a 2016 statewide survey.

Seed germination and growing conditions
Seeds from Ohio A. tuberculatus populations and the known sensitive control accession WUS (Wu et al. Reference Wu, Davis and Tranel2018) were surface sterilized and maintained at 4 C for 5 wk before planting. Surface sterilization consisted of a 2-min incubation in ethanol (70% v/v), followed by a 20-min incubation in a 1:1 deionized water and commercial bleach solution, four washes with deionized water, and a final resuspension in 0.1% agarose. Seeds were germinated in sterile Petri dishes containing water-saturated filter paper (Whatman) and incubated at 35 C with a 12:12 h day:night cycle. Seedlings were transplanted into individual Cone-tainers (3.8-cm top diameter by 21-cm deep; Cone-tainer™, Stuewe and Sons, 31933 Rolland Drive, Tangen, OR 97389) filled with 3:1:1:1 Sunshine® LC1 (Sun Gro Horticulture, 770 Silver Street, Agawam, MA 01001) growing mix:soil:peat:torpedo sand. Plants were grown in the greenhouse with a 12:12 h day:night cycle, with temperatures ranging from 28 to 30 C during the day and 25 to 27 C during the night. Plants were watered twice daily via mist irrigation.
Herbicide treatments
Once plants reached the 4- to 6-leaf stage, up to 20 uniform plants from each population were selected for treatment with each herbicide. Herbicide doses were selected based on delimiting rates for the sensitive population (unpublished data). Herbicide treatments included the following: glyphosate (Roundup WeatherMax®, Monsanto, St. Louis, MO 63141) at 840 g ae ha−1 and 1,260 g ae ha−1 with 2.5% (v/v) ammonium sulfate (1X and 1.5X a typical use rate, respectively), atrazine (Atrazine 90DF, WinField Solutions, Shoreview, MN 55126) at 1,284 g ai ha−1 (1X) with 1% (v/v) crop oil concentrate (COC), and lactofen (Cobra®, Valent USA, Walnut Creek, CA 94596) at 5.48 g ai ha−1 (0.03X) with 1% (v/v) COC. Adjuvants were included based on specifications from herbicide labels. Plants from the A. tuberculatus WUS population were used as herbicide-sensitive controls, and nontreated control plants were also included. Herbicide treatments were applied using a spray chamber equipped with an 80015 even flat-fan nozzle (TeeJet® Technologies, P.O. Box 7900, Wheaton, IL 60187) maintained approximately 46 cm above the plant canopy. The spray chamber was calibrated to deliver 187 L ha−1.
Phenotyping
Plant survival (%) was evaluated at 3 wk after glyphosate treatment and 2 wk after lactofen or atrazine treatment. Sensitive and resistant plants were delimited by the presence of newly growing green tissue appearing after herbicide application.
DNA extractions
Single leaves from all resistant plants and several untreated WUS plants were used to obtain DNA. DNA was extracted using the hexadecyltrimethylammonium bromide method, as previously described in Doyle and Doyle (Reference Doyle and Doyle1990). Samples were assessed for DNA quality and quantity using a spectrophotometer (NanoDrop 1000 Spectrophotometer, Thermo Fisher Scientific, 81 Wyman Street, Waltham, MA 02451), and then diluted to a concentration of 10 ng μl−1 for molecular diagnostics.
Molecular screening for resistance mechanisms
EPSPS gene amplification
qPCR was conducted on DNA from survivors of 1X and 1.5X glyphosate to determine EPSPS gene copy number. A single-copy gene (CPS, encoding the large subunit of carbamoylphosphate synthase) was used as a reference, and a qPCR protocol was carried out as previously described (Délye et al. Reference Délye, Duhoux, Pernin, Riggins and Tranel2015; Ma et al. Reference Ma, Kaundun, Tranel, Riggins, McGinness, Hager, Hawkes, McIndoe and Riechers2013). The difference between control gene and target gene cycle threshold (Ct) values (ΔCt) was calculated, and this value was compared with that obtained from susceptible control samples to obtain ΔΔCt. A ΔΔCt value of −1.14, representing 3 SDs from the mean value of susceptible control samples, was used to delimit samples with the gene amplification mechanism.
EPSPS Pro-106-Ser substitution
DNA from survivors of 1X glyphosate applications was used to detect the prevalence of the Pro-106-Ser substitution in each A. tuberculatus population. A derived cleaved amplified polymorphic sequence assay was used to differentiate wild-type from mutant alleles. PCR and digestion were performed as described previously (Chatham et al. Reference Chatham, Wu, Riggins, Hager, Young, Roskamp and Tranel2015), and bands were visualized on 2% agarose gel stained with GreenGlo Safe DNA Dye (Denville Scientific). Control DNAs were included to validate the fidelity of the test, and plants showing the undigested band were classified as having the Pro-106-Ser substitution. DNA sequencing was conducted on survivors of 1.5X glyphosate. DNA amplification of the Pro-106-Ser region was conducted using procedures similar to those described by Nandula et al. (Reference Nandula, Ray, Ribeiro, Pan and Reddy2013). In brief, PCR products were purified using the EZNA cycle-pure kit (Omega Bio-tek). Purified products were subjected to Sanger sequencing using a BigDye™ Terminator v3.1 Cycle Sequencing Kit (Thermo Fisher Scientific), with reactions consisting of 1 μl of BigDye mix, 2 μl of 5X sequencing buffer, 5.2 μl of 12.5% glycerol, 2 μl of R98-F primer (5′-CTTGGGATACGTGAGAAGCAACAGTTG-3′), 1 μl of template DNA, and 1.8 μl of deionized water to reach a final volume of 13 μl per reaction. Sequencing reactions were subjected to an initial denaturation at 96 C for 5 min followed by 40 cycles consisting of 96 C for 10 s, 50 C for 5 s, and 60 C for 4 min, and a final extension at 60 C for 5 min. PCR products were sequenced by the University of Illinois Core Sequencing Facility (Urbana, IL). In addition to the analysis for the presence of the Pro-106-Ser mutation, a subset of the sequences (61) were inspected for other mutations.
PPO Gly-210 deletion
A TaqMan qPCR assay was conducted on lactofen survivors, together with four WUS controls, to determine whether a plant was wild type or heterozygous/homozygous for the Gly-210 deletion (ΔG210). Experimental design and allele-specific probes were as described in Wuerffel et al. (Reference Wuerffel, Young, Lee, Tranel, Lightfoot and Young2015), using the primers described in Giacomini et al. (Reference Giacomini, Umphres, Nie, Mueller, Steckel, Young, Scott and Tranel2017).
PPO Arg-128 substitutions
A 500-bp region of the PPO gene from lactofen survivors was sequenced as described by Giacomini et al. (Reference Giacomini, Umphres, Nie, Mueller, Steckel, Young, Scott and Tranel2017) with the following modifications. In the initial PCR, forward primer was southernF (5′-TCCATTACCCACCTTTCACC) and reverse primer was southernR (5′-AGCGGGATTTGAAGGTAGTAG). In the second PCR, reverse primer was R98M_XhoII (5′-AGCGGGATTTGAAGGTAGTAG). Amplification products were checked in a 1% agarose gel stained with GreenGlo Safe DNA Dye and then purified with the EZNA Gel Extraction Kit following the manufacturer’s protocol. Sequencing reactions were carried out as described in the “EPSPS Pro-106-Ser Substitution” section.
D1 Protein Ser-264-Gly substitution
Atrazine survivors were tested for Ser-264-Gly substitution in the D1 protein of photosystem II. DNA samples were subjected to a cleaved amplified polymorphic sequences assay in which only the wild-type allele of the psbA gene is cleaved by BfaI restriction enzyme. Amplification, digestion, and data analysis were performed as described in Schultz et al. (Reference Schultz, Chatham, Riggins, Tranel and Bradley2015).
Distribution maps
The Web program PhyloGeoVis (phyolgeoviz.org) was used to generate kml files based on sample location data, herbicide-resistance screening, and mechanism identification. A Google map of Ohio was used as an underlay for the generated kml files.
Results and discussion
Amaranthus spp. distribution
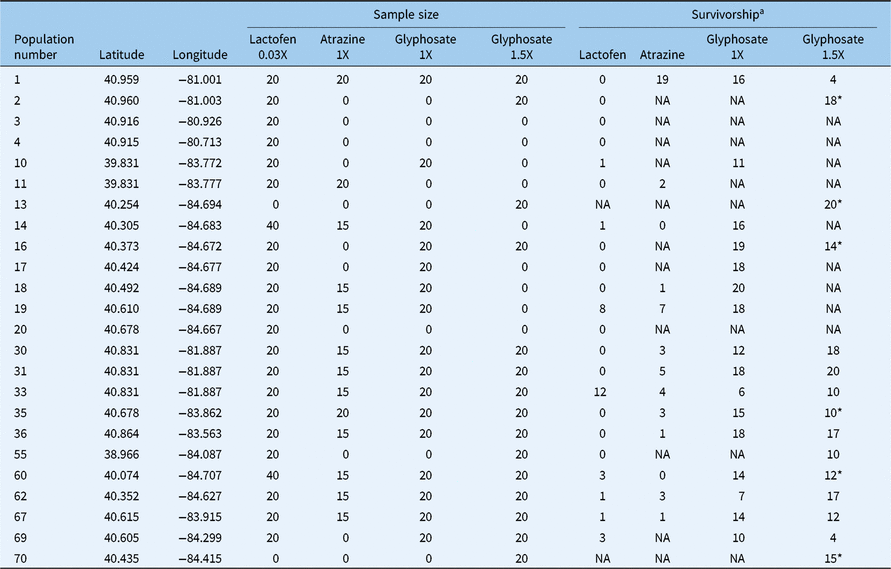
A mixture of A. tuberculatus, A. retroflexus, and A. palmeri was observed in the statewide samples (Figure 1). The survey was not random and, therefore, may not accurately reflect the true distribution and abundance of these species. Amaranthus tuberculatus populations were primarily clustered to the west, while A. retroflexus was observed throughout the state. Amaranthus palmeri was infrequently observed throughout the state. In general, samples representing the northwest corner and east-southeast were absent. While the east-southeast has limited soybean production (USDA-NASS 2016), the northwest corner has a production scenario similar to the other surveyed regions. Of the 51 populations collected, 29 were A. tuberculatus. Of these populations, 24 had sufficient seed availability and germinability for phenotypic screening with at least one herbicide. Herbicides were prioritized in the following order: lactofen, glyphosate, and atrazine. Lactofen and glyphosate were prioritized due to the widespread use of EPSPS and PPO inhibitors in soybean cropping systems (USDA-NASS 2018). Lactofen was further prioritized, because no PPO-inhibitor resistance has been reported in Ohio. A total of 22 and 13 populations were screened for resistance to lactofen and atrazine, respectively. A total of 16 and 15 populations were screened for resistance to glyphosate at 1X and 1.5X the labeled rate, respectively (Table 1).
Ohio Amaranthus tuberculatus populations’ sample sizes and survivorship against the herbicides lactofen, atrazine, and glyphosate

a NA, not analyzed. A subset of survivors of glyphosate at the 1.5X rate were selected for gene amplification mechanism evaluation, denoted with an asterisk (*). The subset comprised all populations not screened at the 1X field rate and a random selection of overlap between the two doses.
Glyphosate resistance
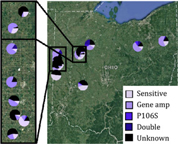
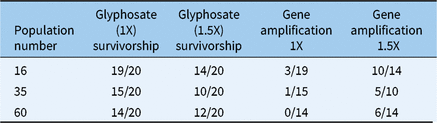
Resistance to glyphosate was frequent among all samples regardless of location within Ohio (Figure 2). Because the sensitive WUS control exhibited some survival at the 1X rate, an additional screen at 1.5X was conducted on a subset of populations. This population subset was selected by seed availability and population germination. The 1.5X rate was lethal to the WUS population, allowing resistance frequency to be investigated. Survivors at the 1X rate likely comprised both true resistant plants and escapes. In general, frequency of resistant plants within populations screened at the 1.5X rate decreased in comparison to the 1X rate, further supporting the presence of escapes at the 1X rate (Table 1). While the potential for escapes within the survivors of the 1X rate limits accurate resistance-frequency determination, the presence of a resistance mechanism is sufficient to classify a plant as resistant but, in the case of unknown or low-level resistance mechanisms, could underestimate resistance frequency. Of 320 plants screened at the 1.5X glyphosate rate across all the populations, 232 (73%) exhibited a resistant phenotype. This high frequency of resistance could be a result of glyphosate application in the sampling sites earlier in the season, selecting against glyphosate-sensitive A. tuberculatus. The prevalence of the gene amplification mechanism varied across survivors at the 1X and 1.5X rates, with a higher proportion of survivors having gene amplification at the 1.5X rate (Table 2). A range of phenotypic responses to glyphosate has been reported under similar circumstances in Nebraska by Vieira et al. (Reference Vieira, Samuelson, Alves, Gaines, Werle and Krugger2018), who proposed that some populations possessed “reduced sensitivity” to glyphosate. The accumulation of minor genes associated with resistance might produce a similar phenotype (Busi and Powles Reference Busi and Powles2009).
Distribution of glyphosate-resistance mechanisms within Ohio Amaranthus tuberculatus populations. Each pie chart represents the collection site of the given population. Within each pie, the proportion of each class (sensitive; resistant through known mechanisms; resistant through unknown mechanisms) is shown. Gene amp, gene amplification.

EPSPS gene amplification frequency within Ohio populations

Gene amplification appeared to be the dominant mechanism of glyphosate resistance present in Ohio A. tuberculatus populations, being present in 34% of all treated plants at both rates (Supplementary Tables 1 and 2). Gene amplification occurred in 49% of the resistant plants. Gene amplification has been reported as the dominant form of resistance in A. tuberculatus populations tested in Missouri and Illinois (Chatham et al. Reference Chatham, Wu, Riggins, Hager, Young, Roskamp and Tranel2015; Vieira et al. Reference Vieira, Samuelson, Alves, Gaines, Werle and Krugger2018). Additionally, the frequency of the Pro-106-Ser substitution was low (6% in resistant plants) relative to the gene amplification mechanism, similar to the observations in Missouri and Illinois (Chatham et al. Reference Chatham, Wu, Riggins, Hager, Young, Roskamp and Tranel2015; Vieira et al. Reference Vieira, Samuelson, Alves, Gaines, Werle and Krugger2018). Multiple instances of “double” resistant plants were observed, that is, a single plant contained both gene amplification and the Pro-106-Ser mutation. If both resistance mechanisms are present within a given population, crossing among plants is expected to occur at some frequency, giving rise to these double-mutant plants. Our procedures did not allow us to determine whether Pro-106-Ser exists within duplicated copies of the EPSPS gene. Perhaps a CASFISH approach (Deng et al. Reference Deng, Shi, Tjian, Lionnet and Singer2015), in which a dCRISPR-dCas9 probe specific to the Pro-106-Ser allele is created and applied to selected plants, would provide insight into the position of the mutation within the genome. The partial EPSPS sequence data obtained from survivors of the 1.5X rate revealed four nonsynonymous mutations resulting in the following substitutions: Asp-88-Tyr, Glu-91-Asp, Gln-94-Lys, and Phe-96-Leu (numbering relative to Pro-106). The Glu-91-Asp substitution was found in 12 out of 61 plants analyzed, whereas the other three were each found in only 1 plant. Alignments with other EPSPS sequences indicated that Glu-91 is not highly conserved (unpublished data), suggesting that the observed Glu-91-Asp substitution does not contribute to resistance.
About 60% of the plants surviving the 1.5X rate could not be explained by known resistance mechanisms. Previously, Chatham et al. (Reference Chatham, Wu, Riggins, Hager, Young, Roskamp and Tranel2015) and Nandula et al. (Reference Nandula, Ray, Ribeiro, Pan and Reddy2013) proposed that a third mechanism of resistance may be present within A. tuberculatus populations. The prevalence of resistant plants without a known resistance mechanism in Ohio not only supports this observation, but also provides evidence that this third mechanism may be nearly as widespread as other resistance mechanisms.
Lactofen resistance
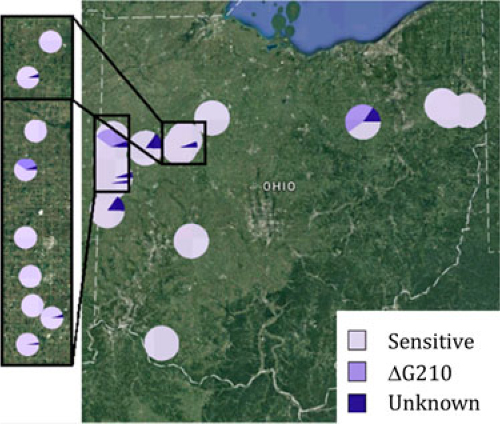
A low frequency of resistance to lactofen was observed in eight A. tuberculatus populations (Figure 3). In fact, 14 of the 22 screened populations were observed to have no survivors of lactofen (Supplementary Table 3). The presence of sensitive populations indicates that resistance to PPO inhibitors may be highly localized geographically within Ohio. The identification of fields with and without regionally rare herbicide resistances allows for isolation and maintenance of susceptible alleles throughout the region. In this study, 6% (30 out of 480) plants were resistant to lactofen. Of these resistant plants, 57% possessed the ΔG210 deletion, but the Arg-128 substitution was not observed. Several instances of plant survival without a known resistance mechanism occurred. Furthermore, none of the resistant plants in several populations (Populations 14, 60, 62, 67, and 69) could be explained with known resistance mechanisms. An additional herbicide screening was conducted on populations 14 and 60, selected based on seed availability, with an additional 20 plants per population. There were no survivors following this treatment, and it remains unclear if the initial surviving plants without known resistance mechanisms were truly resistant or failed to be controlled for other reasons.
Distribution of lactofen resistance mechanisms within Ohio Amaranthus tuberculatus populations. The Arg-128 mutation was not observed in any population. Each pie chart represents the collection site of the given population. Within each pie, the proportion of each class (sensitive; resistant through known mechanisms; resistant through unknown mechanisms) is shown.

Atrazine resistance
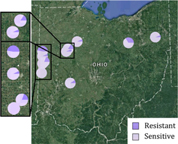
Resistance to atrazine was observed in most populations (Figure 4). Only population 14 had no resistant plants, but this could be an artifact of small sample size. Population 1 exhibited 95% survivorship to the atrazine treatment, whereas for all other populations tested, survival was less than 50% (Table 1). The presence of atrazine resistance within nearly all populations indicates that atrazine may not be a reliable herbicide for total control of A. tuberculatus within Ohio, but may be used in combination with other herbicides. While application of atrazine may be able to control A. tuberculatus at a reasonable level in most fields, the presence of resistance at measurable levels would indicate repeated applications could swiftly lead to herbicide failure (Jasieniuk et al. Reference Jasieniuk, Brûlé-Babel and Morrison1996). The sole known characterized target-site resistance mechanism to atrazine in A. tuberculatus, the Ser-264Gly substitution, was not observed in any resistant plants (Supplementary Table 4). Schultz et al. (Reference Schultz, Chatham, Riggins, Tranel and Bradley2015) observed a similar situation with atrazine resistance in Missouri A. tuberculatus populations. Currently, reliable genomic-based assays for non–target site mechanisms for resistance to atrazine, such as metabolic resistance, do not exist. Existing assays rely on RNA (Evans et al. Reference Evans, O’Brien, Ma, Hager, Riggins, Lambert and Riechers2017), which is impractical for routine surveillance.
Distribution of atrazine resistance within Ohio Amaranthus tuberculatus populations. The Ser-264-Gly mutation was not observed in any population. Each pie chart represents the collection site of the given population and the proportion of resistant and sensitive plants obtained through screening.

Integrated analysis and perspectives
As new resistance alleles are characterized, the effectiveness of quantifying resistance through molecular screening will begin to approach that of traditional phenotyping. However, as observed here in A. tuberculatus for glyphosate, lactofen, and atrazine resistance, substantial gaps can exist in our knowledge of resistance mechanisms. Surveillance provides a unique opportunity not only to quantify resistance at a field scale over a large region, but also to identify populations that harbor new resistance alleles for characterization. Continued screening of targeted populations will not only increase our understanding of how herbicide resistance changes over years, but also can lead to the identification of populations in which new resistance mechanisms have been enriched to the point where characterization is required. Resistance to multiple SOAs was identified within a subset of populations investigated in this study. Resistance to two SOAs occurred in seven populations (1, 10, 18, 30, 31, 35, 69), and resistance to three SOAs occurred in five populations (19, 33, 36, 62, 67). While an individual plant was treated with only one herbicide, the outcrossing nature of A. tuberculatus is expected to combine resistance mechanisms, leading to individual plants displaying multiple resistance.
All populations were collected from infested soybean fields near the end of the growing season, and glyphosate is a commonly used herbicide in soybean production. Although the herbicide-use history of the surveyed fields is unknown, in-season application of glyphosate would enrich the current populations for glyphosate-resistant plants. Should a subset of the field be left untreated and subsequently sampled, the proportion of any given population possessing glyphosate resistance may decrease.
A further consideration is how fields were selected for sampling. Infested fields were specifically targeted for population collection. If a population had very low or no resistance to the herbicide program implemented on a given field, the field would not be considered for sampling, because of low weed densities. This sampling procedure probably enriched the population set for resistance to the dominant herbicide programs within the region and, consequently, high levels of resistance to at least one herbicide SOA would be expected. If a more random sampling approach was used across the state of Ohio, the frequency of resistance observed in this project would likely be lower.
In summary, this study suggests that glyphosate and atrazine resistance in A. tuberculatus is widespread within Ohio soybean fields. The major mechanism of glyphosate resistance appears to be gene amplification; however, unknown mechanisms of resistance likely exist within the surveyed populations. Resistance to PPO-inhibiting herbicides was not observed in more than half of the tested populations, providing an opportunity for use on a field-by-field basis.
Supplementary material
To view supplementary material for this article, please visit https://doi.org/10.1017/wsc.2018.91.
Author ORCID
Patrick J. Tranel https://orcid.org/0000-0003-0666-4564.
Acknowledgments
This work was supported by the Ohio Soybean Council and the USDA National Institute of Food and Agriculture, Hatch project 1014071. ASL was supported by a Fulbright Scholarship. No conflicts of interest have been declared.