Introduction
Depressed mood and loss of interest or pleasure are hallmark symptoms of major depressive disorder (MDD; APA, 2000). Biopsychological models of emotion postulate a behavioral activation system (BAS) that regulates reward sensitivity and behavioral approach (e.g. Fowles, Reference Fowles1988; Depue & Iacono, Reference Depue and Iacono1989; Gray, Reference Gray, Goozen, Poll and Sergeant1994), which, when underactive, manifests as the diminished positive affect and goal motivation that characterizes MDD (e.g. Davidson, Reference Davidson1992; Mineka et al. Reference Mineka, Watson and Clark1998). These models also postulate a behavioral inhibition system (BIS) that regulates sensitivity to threat and behavioral avoidance; higher levels of BIS functioning have been associated with both depression and anxiety disorders (for reviews of this literature, see Zinbarg & Yoon, Reference Zinbarg, Yoon and Corr2008; Bijttebier et al. Reference Bijttebier, Beck, Claes and Vandereycken2009).
Investigators have reliably documented a relationship between diminished BAS functioning and unipolar depression (e.g. Henriques et al. Reference Henriques, Glowacki and Davidson1994; Harmon-Jones & Allen, Reference Harmon-Jones and Allen1997). Based on the proposal by Davidson (Reference Davidson1992) that electrophysiological activity in the left hemisphere is positively associated with BAS functioning, researchers have used electroencephalography to demonstrate that depressed individuals are characterized by left relative to right frontal hypoactivation (e.g. Henriques & Davidson, Reference Henriques and Davidson1991; Gotlib et al. Reference Gotlib, Ranganath and Rosenfeld1998). Carver & White (Reference Carver and White1994) developed the commonly used self-report BIS/BAS scales, in which the BIS scale measures sensitivity to experiencing fear and anxiety in response to imminent punishment, and the BAS scales measure sensitivity to experiencing positive emotions such as happiness, excitement and hope in response to imminent reward. Researchers using these measures have found that depressed individuals report lower levels of BAS functioning than do non-depressed controls (e.g. Kasch et al. Reference Kasch, Rottenberg, Arnow and Gotlib2002), and that in unselected samples, lower levels of BAS functioning are associated with more severe depressive symptoms (e.g. Beevers & Meyer, Reference Beevers and Meyer2002; Spielberg et al. Reference Spielberg, Heller, Silton, Stewart and Miller2011). Importantly, individuals who have recovered from depression have been found to exhibit the same patterns of frontal cortical asymmetry (Henriques & Davidson, Reference Henriques and Davidson1990; Gotlib et al. Reference Gotlib, Ranganath and Rosenfeld1998; reviewed in Thibodeau et al. Reference Thibodeau, Jorgensen and Kim2006) and self-reported levels of BAS functioning (Pinto-Meza et al. Reference Pinto-Meza, Caseras, Soler, Puigdemont, Pérez and Torrubia2006) that have been documented in depressed individuals. Furthermore, in a recent study of individuals with no history of depression, Nusslock et al. (Reference Nusslock, Shackman, Harmon-Jones, Alloy, Coan and Abramson2011) found that left frontal hypoactivation predicted the subsequent onset of a first depressive episode, suggesting that reductions in BAS sensitivity are not simply a consequence or scar of previous depressive episodes. In sum, the results of cross-sectional and longitudinal research converge on the formulation that BAS functioning is related to vulnerability to depression (Carver & White, Reference Carver and White1994; Gray, Reference Gray, Goozen, Poll and Sergeant1994; Campbell-Sills et al. Reference Campbell-Sills, Liverant and Brown2004).
The BAS scale (Carver & White, Reference Carver and White1994) is composed of three subscales: BAS-Reward Responsiveness (BAS-RR), BAS-Drive and BAS-Fun-Seeking (BAS-Fun) (e.g. Huebeck et al. Reference Heubeck, Wilkinson and Cologon1998; Jorm et al. Reference Jorm, Christensen, Henderson, Jacomb, Korten and Rodgers1999; Ross et al. Reference Ross, Millis, Bonebright and Bailley2002; Campbell-Sills et al. Reference Campbell-Sills, Liverant and Brown2004; Levinson et al. Reference Levinson, Rodebaugh and Frye2011). BAS-RR measures affective responding, BAS-Drive assesses behavioral responding, and BAS-Fun measures affective and behavioral responding (Carver & White, Reference Carver and White1994; Campbell-Sills et al. Reference Campbell-Sills, Liverant and Brown2004). Interestingly, within samples diagnosed with MDD, BAS-RR most consistently predicts the general course of the disorder, whereas BAS-Drive predicts specific aspects of disorder course. For example, Kasch et al. (Reference Kasch, Rottenberg, Arnow and Gotlib2002) found that in participants with MDD, lower BAS-RR and BAS-Drive scores predicted the subsequent persistence of the diagnosis and a higher number of depressive symptoms at an 8-month follow-up assessment; lower baseline BAS-RR scores also predicted greater severity of depressive symptoms. Similarly, McFarland et al. (Reference McFarland, Shankman, Tenke, Bruder and Klein2006) found that after controlling for baseline clinical variables, lower BAS-RR and BAS-Drive scores predicted the maintenance of MDD at a 6-month follow-up assessment; lower BAS-RR scores also predicted a higher number of subsequent depressive symptoms and poorer psychiatric status. These findings indicate that, even within depressed groups, variation in BAS functioning may be a marker for disorder persistence and subsequent symptomatology. Indeed, BAS sensitivity may be a particularly potent risk factor for depression in persons who are already vulnerable to MDD because of having experienced prior episodes.
The precise mechanisms explaining the association between reductions in BAS functioning and risk for depression are not yet known. Theorists have proposed that because persons with diminished BAS sensitivity are less responsive to positive stimuli, they have a lower likelihood of exerting effort toward or engaging in potentially rewarding experiences, which thereby increases their risk for depression (e.g. Depue & Iacono, Reference Depue and Iacono1989; Fritzsche et al. Reference Fritzsche, Dahme, Gotlib, Joormann, Magnussen, Watz, Nutzinger and von Leupoldt2010). It is also possible that BAS functioning is related to aspects of cognitive vulnerability to depression. Spurred by Beck's concept of negative cognitive schemas as risk factors for depression (Beck, Reference Beck1967), a large body of research has demonstrated that depression is associated with negative biases in the processing of self-referent information, as one such facet of cognitive vulnerability (for reviews, see Beevers, Reference Beevers2005; Gotlib & Joormann, Reference Gotlib and Joormann2010).
In this context, investigators have used the Self-Referential Encoding Task (SRET; Derry & Kuiper, Reference Derry and Kuiper1981), an information-processing task that assesses self-schema function, to examine the processing of valenced stimuli in depressed, recovered depressed, and non-depressed participants. Depressed individuals have been shown to endorse and recall more negative and/or less positive self-referent information than do their non-depressed counterparts. Findings for persons who have recovered from MDD are less consistent; an initial negative mood induction appears necessary to detect negatively biased self-referent processing in this group (e.g. Dobson & Shaw, Reference Dobson and Shaw1987; Fritzsche et al. Reference Fritzsche, Dahme, Gotlib, Joormann, Magnussen, Watz, Nutzinger and von Leupoldt2010).
Researchers have recently begun to explore the relationships between BAS functioning and different facets of cognitive vulnerability to depression, although they have not yet examined self-referent processing. Beevers & Meyer (Reference Beevers and Meyer2002) found in an unselected sample of participants that positive experiences and expectancies mediated the relationship between self-reported level of BAS functioning and anhedonic symptoms of depression. Similarly, Nusslock et al. (Reference Nusslock, Shackman, Harmon-Jones, Alloy, Coan and Abramson2011) found that left frontal hypoactivation in their sample of currently non-depressed participants was associated with the extent to which the participants attributed negative events to stable and global causes and endorsed likely negative consequences of the events.
The present study is the first to examine associations among BAS functioning and one aspect of cognitive vulnerability to depression in both a clinical sample (participants with a history of recurrent major depression; RMD) and in never-depressed control (CTL) participants. As we noted above, BAS sensitivity has been found to be related to risk for depression in both clinical and non-clinical samples; therefore, we hypothesized that a lower self-reported level of BAS functioning would be associated with less positive and more negative self-referent processing across both groups. Given the particularly striking relationship of BAS sensitivity to risk for future depression within samples of individuals who are already vulnerable to MDD, however, we hypothesized that these associations between BAS functioning and self-referent processing would be stronger in the RMD group than in the CTL group. In the present study we focused on level of BAS-RR because it is the BAS subscale that has been found most consistently to predict depression course. To assess the specificity and robustness of the association of BAS-RR with self-referent processing, we controlled for current levels of depressive and anxiety symptoms (e.g. Kasch et al. Reference Kasch, Rottenberg, Arnow and Gotlib2002) and also assessed the relationship between BIS functioning and self-referent processing.
Method
Participants
Participants were 152 women (70 RMD and 82 CTL) between the ages of 18 and 60 years who were fluent in English. Participants were recruited through advertisements and online postings, and were screened for initial inclusion/exclusion through a telephone interview. Exclusion criteria included: history of severe head trauma; learning disabilities; bipolar disorder; psychotic symptoms; and DSM-IV (APA, 1994) alcohol or substance abuse within the past 6 months. The telephone interview identified participants who were likely to meet criteria for inclusion in one of the two study groups: (a) individuals with a history of two or more major depressive episodes who did not meet DSM-IV criteria for current MDD (RMD); and (b) individuals with no past or current DSM-IV Axis I disorder (CTL). These individuals were invited to participate in an interview in the laboratory using the Structured Clinical Interview for the DSM-IV (SCID; First et al. Reference First, Spitzer, Gibbon and Williams1996), conducted by a trained interviewer. Inter-rater reliability is excellent among our laboratory interviewers, both for classifying a major depressive episode (k = 0.93) and for classifying control participants (k = 0.92; Levens & Gotlib, Reference Levens and Gotlib2010).
Self-report measures
Participants completed several self-report questionnaires, including the Beck Depression Inventory – II (BDI-II; Beck et al. Reference Beck, Steer and Brown1996), Beck Anxiety Inventory (BAI; Beck et al. Reference Beck, Epstein, Brown and Steer1988) and BIS/BAS scales (Carver & White, Reference Carver and White1994). As we noted above, the 20-item BIS/BAS assesses how individuals typically react to situations across four subscales. Sample subscale items include: ‘If I think something unpleasant is going to happen, I usually get pretty “worked up”‘ (BIS); ‘When I'm doing well at something, I love to keep at it’ (BAS-RR); ‘I go out of my way to get things I want’ (BAS-Drive); and ‘I'm always willing to try something new if I think it will be fun’ (BAS-Fun). Participants rate each item on a four-point Likert scale (1 = very true for me, 4 = very false for me). In the current study, internal consistencies of the subscales were moderate to high (BIS = 0.79; BAS-RR = 0.62; BAS-Drive = 0.79; BAS-Fun = 0.63); intercorrelations among the BAS subscales were moderate (r's = 0.48–0.50). None of the BAS subscales was correlated significantly with the BIS subscale.
Procedure
Participants completed the telephone interview and the SCID; immediately following the SCID, participants completed the self-report questionnaires. A second laboratory session was scheduled within 1 week. During this session, participants completed a baseline mood assessment in which they rated their current mood on a five-point Likert scale (1 = very sad, 5 = very happy). Immediately before completing the SRET, participants underwent a negative mood induction (see below) and subsequently completed a mood assessment in the same manner as at baseline. Participants then completed the SRET. The SRET was one of three counterbalanced tasks completed by participants in the session. The results for BAS-RR presented below did not change when including task order as a predictor.
Mood induction
Previous research has found that cognitive biases are present after recovery from a depressive episode, but may remain dormant or latent until activated by a negative mood (for a review, see Scher et al. Reference Scher, Ingram and Segal2005). Therefore, we induced a negative mood in all participants before they completed the SRET. Participants were randomly assigned to view one of three 6-min sadness-inducing film clips (Dead Poets Society, directed by Peter Weir, 1989; My Girl, directed by Howard Zieff, 1991; Stepmom, directed by Chris Columbus, 1998). Participants were instructed to ‘imagine being in the situation’ and ‘imagine the feelings you would experience in the situation’ while viewing it, an instructional set demonstrated to be highly effective in inducing negative mood (Westermann et al. Reference Westermann, Spies, Stahl and Hesse1996). Following the film clip, participants were instructed to think for an additional 2 min about how they would feel if they had experienced the situation. The results for BAS-RR presented below did not change when including film clip as a predictor.
SRET
The SRET was composed of a set of 40 adjectives: 20 positive (e.g. happy, interesting, smart); and 20 negative (e.g. boring, lazy, stupid). Adjectives were selected from several sources, including previous studies of information processing in depression (e.g. Gotlib & Cane, Reference Gotlib and Cane1987; McCabe & Gotlib, Reference McCabe and Gotlib1993; Gotlib et al. Reference Gotlib, Kasch, Traill, Joormann, Arnow and Johnson2004). A larger set of adjectives was rated on positive and negative valence by five psychology graduate students; adjectives were retained for the final set only if agreement was unanimous. The positive and negative word lists did not differ in word length, familiarity, or level of arousal (all p's >0.05).
Participants were seated in front of a computer and were instructed to place their right index finger on a key labeled ‘yes’ and their left index finger on a key labeled ‘no’. For each trial, participants were presented with the phrase ‘Describes me?’ in the middle of the screen for 500 ms. After a pause of 250 ms, participants were presented with one of the stimulus words in random order and were instructed to indicate as quickly and accurately as possible whether the word described them by pressing the corresponding key. Participants' responses were recorded on each trial. A fixation cross was presented for 1000 ms during each inter-trial interval. Participants first completed a series of practice trials, followed by the experimental trials during which the experimenter waited outside of the room.
After the encoding task, the experimenter returned to the room to administer an incidental recall task. The experimenter provided a sheet of paper to participants and asked them to recall as many words as possible from the previous task, regardless of whether or not they had endorsed the words as self-descriptive. The task did not have a time limit. Participants were instructed to notify the experimenter when they were done.
Results
Participant characteristics
Demographic and clinical characteristics for the RMD and CTL groups are presented in Table 1. The groups did not differ in age (t 134.37 = 0.52, n.s.), proportion of college-educated participants [(χ2(1), n = 151) = 1.62, n.s.], or distribution by race/ethnicity [(χ2(5), n = 150) = 3.83, n.s.]. RMD participants were more likely than were CTL participants to be taking psychotropic medication [(χ2(1), n = 152) = 33.63, p < 0.001]. The results for BAS-RR presented below did not change when including the presence of psychotropic medication as a predictor. RMD participants obtained significantly higher scores than did CTL participants on the BDI-II (t 91.02 = 6.87, p < 0.001). Because of the subsyndromal level of depressive symptoms reported by some participants, we controlled for BDI-II scores in our statistical analyses. As indicated below, results for one analysis became more significant when removing BDI-II score as a predictor or when removing participants with BDI-II scores of 14 (mild depressive symptoms) or higher. RMD participants also obtained significantly higher scores than did CTL participants on the BAI (t 98.44 = 6.04, p < 0.001). A total of 13 RMD participants had a current DSM-IV anxiety disorder: three had social phobia; two had specific phobia; two had obsessive–compulsive disorder; two had post-traumatic stress disorder; four had generalized anxiety disorder; and one had anxiety disorder not otherwise specified. The results for BAS-RR did not change when removing BAI score as a predictor or when removing participants with current anxiety disorders. Finally, RMD participants obtained significantly higher scores on the BIS subscale (t 150 = 4.39, p < 0.001), and significantly lower scores on the BAS-Drive subscale (t 150 = − 3.05, p < 0.005), than did CTL participants; the groups did not differ in scores on the BAS-RR (t 150 = 0.91, n.s.) or BAS-Fun (t 150 = 1.18, n.s.) subscales.
Demographic and clinical characteristics of the RMD and CTL groupsa

RMD, Currently non-depressed participants with a history of recurrent major depression; CTL, never-depressed control participants; s.d., standard deviation; BDI-II, Beck Depression Inventory – II; BAI, Beck Anxiety Inventory; BIS, Behavioral Inhibition subscale; BAS, Behavioral Activation subscale; BAS-RR, BAS Reward Responsiveness; BAS-Fun, BAS Fun-Seeking.
a Education data were missing for one CTL participant, and race/ethnicity data were missing for one CTL participant and one RMD participant. BDI-II data were missing for five CTL participants and one RMD participant.
b Due to missing data the percentages do not sum to 100%.
Mood induction
Self-reported mood data were missing for one CTL participant and two RMD participants. To examine the effectiveness of the mood induction, a group (CTL, RMD) × time (baseline, after mood induction) repeated-measures analysis of variance was conducted on self-reported mood. As expected, this analysis yielded a main effect of time (F 1,147 = 424.58, p < 0.001): participants reported more negative mood after the induction than before the induction. The analysis also yielded a main effect of group (F 1,147 = 5.39, p < 0.05): RMD participants reported more negative mood than did CTL participants. The interaction of group and time was not significant (F 1,147 = 1.14, n.s.). Given these findings, in all subsequent analyses we controlled for self-reported mood.
SRET
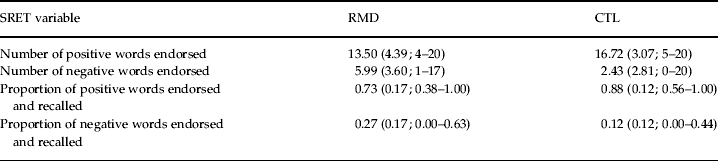
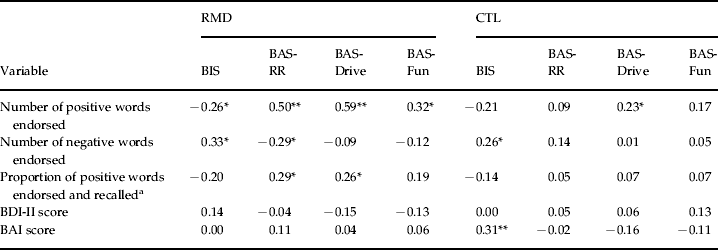
Descriptive statistics for the SRET variables are presented in Table 2. Correlations among BIS/BAS scores and SRET variables, BDI-II scores, and BAI scores within the RMD and CTL groups are presented in Table 3. There were two outliers for SRET negative words endorsed (>3 s.d. from the mean). The results for BAS-RR below did not change with these values Winsorized. Hierarchical regression analyses (Cohen & Cohen, Reference Cohen and Cohen1983) were conducted to test the unique associations of group, BIS and BAS-RR, and the interactions of group with BIS and BAS-RR with each of the SRET variables, controlling for the effects of BDI-II and BAI scores and self-reported mood. Each SRET variable was modeled separately. To first assess group differences in self-referent processing, group (b 1), BDI-II score (b 2), BAI score (b 3) and self-reported mood (b 4) were entered in model 1. Next, BIS level (b 5) and BAS-RR level (b 6) were entered in model 2. Finally, the interactions of group with BIS level (b 7) and with BAS-RR level (b 8) were entered in model 3. The CTL group was coded as 0 and the RMD group was coded as 1; all other variables were centered at their respective grand means.
SRET performance by the RMD and CTL groups
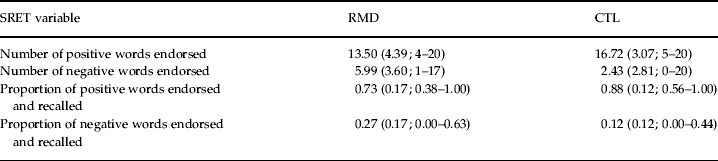
Data are given as mean (standard deviation; range).
SRET, Self-Referential Encoding Task; RMD, currently non-depressed participants with a history of recurrent major depression; CTL, never-depressed control participants.
Correlations among variables within the RMD and CTL groups
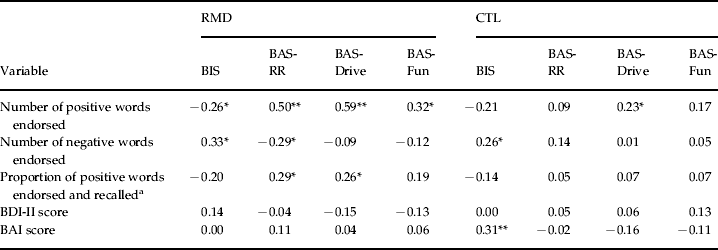
RMD, Currently non-depressed participants with a history of recurrent major depression; CTL, never-depressed control participants; BIS, Behavioral Inhibition subscale; BAS, Behavioral Activation subscale; BAS-RR, BAS Reward Responsiveness; BAS-Fun, BAS Fun-Seeking; BDI-II, Beck Depression Inventory-II; BAI, Beck Anxiety Inventory.
a Correlations with proportion of negative words endorsed and recalled are identical with the opposite sign.
Significant correlation: * p < 0.05, ** p < 0.01.
Group differences
Controlling for BDI-II and BAI scores and self-reported mood, RMD participants endorsed significantly fewer positive words (b 1 = − 0.22, t 138 = − 2.60, p = 0.01), and significantly more negative words (b 1 = 0.25, t 138 = 3.29, p = 0.001), than did CTL participants. Consistent with the recall analyses reported in previous research (e.g. Fritzche et al. Reference Fritzsche, Dahme, Gotlib, Joormann, Magnussen, Watz, Nutzinger and von Leupoldt2010), to control for individual differences in overall endorsement and recall we computed recall of endorsed positive and negative words as proportions of the total number of words endorsed and recalled. Because these proportions sum to 1, and analyses of positive and negative words produce identical coefficients with the opposite sign, we present recall results only for positive words. Controlling for BDI-II and BAI scores and self-reported mood, RMD participants exhibited poorer recall of endorsed positive words than did CTL participants (b 1 = − 0.21, t 138 = − 2.65, p < 0.01).
Main effects of BIS and BAS-RR
Across groups, higher BIS scores were associated with endorsement of fewer positive words (b 5 = − 0.27, t 136 = − 3.90, p < 0.001) and more negative words (b 5 = 0.24, t 136 = 3.67, p < 0.001), and with poorer recall of endorsed positive words (b 5 = − 0.14, t 136 = − 2.03, p < 0.05). Across groups, lower BAS-RR scores were associated with endorsement of fewer positive words (b 6 = 0.31, t 136 = 4.70, p < 0.001) and with poorer recall of endorsed positive words (b 6 = 0.19, t 136 = 2.95, p < 0.005).
Interactions of group with BIS and BAS-RR
There were no group differences in the association of BIS scores with endorsement of positive (b 7 = 0.09, t 134 = 0.94, n.s.) or negative (b 7 = 0.05, t 134 = 0.48, n.s.) words, or recall of endorsed positive words (b 7 = − 0.05, t 134 = − 0.52, n.s.). There was a significant group difference in the association of BAS-RR scores with endorsement of positive words (b 8 = 0.26, t 134 = 2.94, p < 0.005). Tests of the simple slopes indicated that for RMD participants, lower BAS-RR scores were significantly associated with fewer positive words endorsed [t 134 = 5.56, p < 0.001, 95% confidence interval (CI) for β 0.68–1.44] whereas for CTL participants, BAS-RR scores were unrelated to endorsement of positive words (t 134 = 1.54, n.s., 95% CI for β –0.08 to 0.64) (Fig. 1). There was also a significant group difference in the association of BAS-RR scores with endorsement of negative words (b 8 = − 0.25, t 134 = − 3.01, p < 0.005). Tests of the simple slopes indicated that for RMD participants, lower BAS-RR scores were associated with more negative words endorsed (t 134 = − 3.12, p < 0.005, 95% CI for β –0.84 to –0.19), whereas for CTL participants, this association was not significant and, indeed, was in the opposite direction (t 134 = 1.10, n.s., 95% CI for β –0.14 to 0.48) (Fig. 2). Finally, there was a marginally significant group difference in the association of BAS-RR scores with recall of endorsed positive words (b 8 = 0.17, t 134 = 1.91, p = 0.06). Tests of the simple slopes indicated that for RMD participants, lower BAS-RR scores were significantly associated with poorer recall of endorsed positive words(t 134 = 3.41, p = 0.001, 95% CI for β 0.01–0.04), whereas for CTL participants, BAS-RR scores were unrelated to recall of endorsed positive words (t 134 = 0.79, n.s., 95% CI for β –0.01 to 0.02). The interaction term was significant when BDI-II score was removed as a predictor (b 7 = 0.20, t 141 = 2.16, p < 0.05) and when participants with BDI-II scores of 14 (mild depressive symptoms) or higher were removed (b 8 = 0.23, t 106 = 2.14, p < 0.05).
Association between behavioral activation system-reward responsiveness (BAS-RR) score and number of positive words endorsed within the currently non-depressed participants with a history of recurrent major depression (RMD) and never-depressed control participants (CTL). Group reference lines were computed using unstandardized coefficients from the hierarchical regression.

Association between behavioral activation system-reward responsiveness (BAS-RR) score and number of negative words endorsed within the currently non-depressed participants with a history of recurrent major depression (RMD) and never-depressed control participants (CTL). Group reference lines were computed using unstandardized coefficients from the hierarchical regression.

To ensure the specificity of association between BAS-RR functioning and self-referent processing, we also tested the unique associations of the interactions of group with BAS-Drive and BAS-Fun with each of the SRET variables, controlling for the effects of BDI-II and BAI scores and self-reported mood. Only one interaction was significant: across groups, higher BAS-Drive scores were associated with endorsement of more positive words (b = 0.38, t 137 = 5.74, p < 0.001) and there was a significant group difference in the association of BAS-Drive scores with endorsement of positive words (b = 0.24, t 136 = 2.55, p = 0.01). Tests of the simple slopes indicated that for RMD participants, lower BAS-RR scores were significantly associated with fewer positive words endorsed (t 136 = 5.98, p < 0.001, 95% CI for β 0.58–1.16), and for CTL participants, this association was less strong but still significant (t 136 = 2.11, p < 0.05, 95% CI for β 0.02–0.63).
Discussion
This is the first study to examine associations among BIS/BAS functioning and cognitive processing in individuals at high risk for MDD by virtue of having experienced previous recurrent depressive episodes. Replicating the findings of Fritzsche et al. (Reference Fritzsche, Dahme, Gotlib, Joormann, Magnussen, Watz, Nutzinger and von Leupoldt2010), RMD participants endorsed and recalled fewer positive and more negative self-referent adjectives than did CTL participants. It is notable that these group differences remained even after controlling for depressive and anxiety symptoms and current mood. With respect to BAS functioning, lower BAS-RR level was associated with the endorsement and recall of fewer positive words across the full study sample. Importantly, however, we found that group and BAS-RR interacted in their relationships with self-referent processing such that self-reported level of BAS-RR functioning was more strongly associated with self-referent processing for RMD participants than it was for CTL participants. Indeed, only in the RMD group was lower BAS-RR level related to endorsement of more positive and fewer negative self-referent words and with poorer recall of endorsed positive words. Below we discuss the potential implications of these findings.
These results expand findings of previous studies relating diminished BAS sensitivity to a poorer course of depression (e.g. Kasch et al. Reference Kasch, Rottenberg, Arnow and Gotlib2002; McFarland et al. Reference McFarland, Shankman, Tenke, Bruder and Klein2006), and add to a growing literature integrating BIS/BAS functioning and cognitive risk for depression (Beevers & Meyer, Reference Beevers and Meyer2002; Nusslock et al. Reference Nusslock, Shackman, Harmon-Jones, Alloy, Coan and Abramson2011). Theorists have suggested that low BAS sensitivity increases risk for depression through behavioral mechanisms such as low levels of engagement in potentially rewarding activities (e.g. Depue & Iacono, Reference Depue and Iacono1989). Interestingly, Abramson et al. (Reference Abramson, Alloy, Hankin, Haeffel, MacCoon, Gibb, Gotlib and Hammen2002) conceptualize deficiencies in BAS functioning as a reflection of hopelessness, which arises from negative perceptions and assumptions, including those about the self. In demonstrating distinctive relationships of low BAS affective responsivity to more negatively biased self-perceptions and memory biases in persons vulnerable to depression, the present findings generally support this notion. Furthermore, these findings suggest that, rather than being associated in a uniform fashion across the population, BAS functioning and cognitive processing are more rigidly interconnected in individuals with a history of recurrent depression. In fact, such rigid interrelationships between affective and cognitive functioning, in contrast to a more flexible system of responding, may underlie a proneness to repeatedly experience depressive episodes, especially in response to stressors. By focusing on self-referent cognitive processing, these findings extend the results of Nusslock et al. (Reference Nusslock, Shackman, Harmon-Jones, Alloy, Coan and Abramson2011) linking BAS functioning with inferences about hypothetical negative events. It will be important for future studies to investigate associations among BAS functioning and cognitive processing in response to laboratory and real-world stressors.
We found in this study that a higher level of BAS-RR functioning in RMD participants was associated with the endorsement and recall of more positive words and fewer negative words. These findings suggest that higher levels of affective responding to reward incentives may serve as a buffer against the development of negative self-schemas in individuals at high risk for experiencing further episodes of depression. Building on the formulation of Beevers & Meyer (Reference Beevers and Meyer2002), it is possible that stronger reward sensitivity motivates individuals to engage in more pleasurable or more frequent mastery experiences that boost their positive self-schemas and reduce their susceptibility to the effects of negative self-schemas. It is also possible that self-relevant cognitions mediate or moderate the effort exerted toward positive experiences. In future research, investigators should address these different directions of effects by examining explicitly the temporal relationships among the cognitive and behavioral expressions of reward responsivity. In addition, investigators should also examine the extent to which motivational and cognitive factors, alone and in their interaction, predict the course and recurrence of MDD.
It is noteworthy that BAS-RR functioning had different effects in the recovered and control participants despite the fact that the two groups of participants did not differ in their mean level of BAS-RR. Thus, investigators who compare high-risk and control groups on BIS/BAS and cognitive processing should examine differential correlations as well as group differences in average levels of functioning. Importantly, however, the recovered and never-depressed participants generally did not differ in their associations between BAS-Drive, BAS-Fun, or BIS and self-referent processing. In the one analysis in which the two groups did differ, BAS-Drive was significantly associated with the endorsement of positive words in both groups, but this association was stronger in the RMD than in the CTL group. Given that BDI-II scores were slightly negatively correlated with BAS-Drive and BAS-Fun scores in RMD participants, it is possible that these measures were sources of shared variance in the regression analyses. BAS-RR scores, on the other hand, were unrelated to BDI-II scores and thus captured an aspect of functioning that was statistically independent of depressive symptoms. With respect to BIS functioning, for both RMD and CTL participants a higher BIS level was associated with the endorsement of fewer positive and more negative words, suggesting that avoidance motivation is related more generally to less positive and more negative self-referent processing. Given the relevance of BIS to anxiety disorders (for reviews, see Zinbarg & Yoon, Reference Zinbarg, Yoon and Corr2008; Bijttebier et al. Reference Bijttebier, Beck, Claes and Vandereycken2009), investigators should continue to examine the relationship between BIS and cognitive processing in anxiety disorders.
We should note four limitations of the present study. First, our use of a recovered depressed sample did not allow us to assess whether BAS functioning is related to cognitive biases prior to the initial onset of depression. Thus, it is possible that these observed associations stem from a scar model rather than a broader risk model of depression (Just et al. Reference Just, Abramson and Alloy2001). Second, as evidenced by our BDI-II data, some participants were reporting depressive symptoms, albeit below the syndromal threshold, at the time of study participation. We controlled for symptom severity statistically, and findings for BAS-RR held when removing these control variables and when removing participants with BDI-II scores at or above the cut-off for mild symptoms. Nevertheless, it is important that investigators examine these hypothesized relationships in other samples unaffected by previous depressive episodes. Third, because we did not include a group of currently depressed participants, we do not know whether BAS also moderates information processing during a major depressive episode. Finally, we used the SRET in this study and assessed self-referent processing only following a negative mood induction. Investigators have used a range of cognitive tasks to study information processing in emotional disorders, and it will be important in future studies of clinical samples to examine whether BIS/BAS functioning influences aspects of cognitive functioning other than self-referent processing. In addition, our use of a negative mood induction may enhance the relevance of our findings to theoretical models that emphasize the role of stressors in eliciting cognitive biases (i.e. Abramson et al. Reference Abramson, Alloy, Hankin, Haeffel, MacCoon, Gibb, Gotlib and Hammen2002). Although the use of negative mood inductions is common in depression-related research (for a review, see Scher et al. Reference Scher, Ingram and Segal2005), future studies should assess whether these RMD-specific effects also occur in the absence of such an induction.
In summary, the present results suggest that BAS functioning is uniquely associated with cognitive vulnerability to depression in individuals at high risk for MDD by virtue of having experienced prior depressive episodes. Although BAS is presumed to reflect a trait-like risk factor for depression, it clearly interacts with other factors, such as cognitive and behavioral responding, in contributing to the onset of a depressive episode. The assessment of BAS sensitivity may help to identify individuals who could benefit from prevention or intervention efforts focused on enhancing positive cognitions, motivation and engagement.
Acknowledgements
This research was supported by National Institute of Mental Health Grants MH74849 to Ian H. Gotlib and MH096385 to Katharina Kircanski.
Declaration of Interest
None.