





Key messages of the article:
What is already known on this topic: AT is an important public health problem, because when it is inadequate it leads to poorer disease control, quality of life and morbidity and mortality.
What this study adds: an adequate doctor–patient relationship is associated with greater AT. Empathy, courtesy and patient participation in shared decision-making are the factors that most influence adherence.
How this study might affect research, practice or policy: patient participation in decision-making and good doctor–patient communication should be of choice to promote AT and better health outcomes.
Introduction
The World Health Organization (WHO) defines adherence to treatment (AT) as ‘the degree to which a person’s behaviour corresponds to the agreed recommendations of a health care provider, in relation to taking medication, following diet or modifying lifestyle habits’ (Benavides et al., Reference Benavides, Jaramillo Rosero, Rendón, Valenzuela, Argotty and Mafla2013; Castañeda Hernández, Reference Castañeda Hernández2015; Dilla et al., Reference Dilla, Valladares, Lizán and Sacristán2009; Olvera Arreola, Reference Olvera Arreola2012; Pantuzza et al., Reference Pantuzza, Ceccato, Silveira, Junqueira and Reis2017; Ramos Morales, Reference Ramos Morales2015; Reyes-Flores et al., Reference Reyes-Flores, Trejo-Alvarez, Arguijo-Abrego, Jimenez-Gómez, Castillo-Castro, Hernández-Silva and Mazzoni-Chávez2016; Hernández, Reference Hernández, Sarmiento, González, Galarza, De la Bastida, Terán and Terán2018; Andrikopoulou et al., Reference Andrikopoulou, Scott, Herrera and Good2019; Ibrahim et al., Reference Ibrahim, Schommer, Morisky, Rodriguez, Gaither and Snyder2021; Lemay et al., Reference Lemay, Waheedi, Al-Sharqawi and Bayoud2018; Prados-Moreno et al., Reference Prados-Moreno, Sabio, Pérez-Mármol, Navarrete-Navarrete and Peralta-Ramírez2018). This definition implies patient participation and shared decision-making (Reyes-Flores et al., Reference Reyes-Flores, Trejo-Alvarez, Arguijo-Abrego, Jimenez-Gómez, Castillo-Castro, Hernández-Silva and Mazzoni-Chávez2016). AT is closely related to patient self-care related to medication intake, disease monitoring and lifestyle habits (Sabaté y World Health Organization, Reference Sabaté2003; Reyes-Flores et al., Reference Reyes-Flores, Trejo-Alvarez, Arguijo-Abrego, Jimenez-Gómez, Castillo-Castro, Hernández-Silva and Mazzoni-Chávez2016). It is a complex behaviour conditioned by the patient’s beliefs and social support, characteristics of their disease and treatment, health information and doctor–patient relationship (DPR) (Palop Larrea y Martínez Mir, Reference Palop Larrea and Martínez Mir2004; Dilla et al., Reference Dilla, Valladares, Lizán and Sacristán2009; Hernández, Reference Hernández, Sarmiento, González, Galarza, De la Bastida, Terán and Terán2018).
AT is considered a major public health problem and a priority (Sabaté y World Health Organization, Reference Sabaté2003; Palop Larrea y Martínez Mir, Reference Palop Larrea and Martínez Mir2004; Rodríguez Chamorro et al., Reference Rodríguez Chamorro, García-Jiménez, Amariles, Rodríguez Chamorro and José Faus2008; Pasina et al., Reference Pasina, Brucato, Falcone, Cucchi, Bresciani, Sottocorno, Taddei, Casati, Franchi, Djade and Nobili2014; González-Bueno et al., Reference González-Bueno, Calvo-Cidoncha, Sevilla-Sánchez, Espaulella-Panicot, Codina-Jané and Santos-Ramos2017). Non-compliance leads to poorer disease control, increased susceptibility to potentially serious complications, lower quality of life and higher morbidity and mortality (Sabaté y World Health Organization, Reference Sabaté2003; Palop Larrea y Martínez Mir, Reference Palop Larrea and Martínez Mir2004; Rodríguez Chamorro et al., Reference Rodríguez Chamorro, García-Jiménez, Amariles, Rodríguez Chamorro and José Faus2008; Pasina et al., Reference Pasina, Brucato, Falcone, Cucchi, Bresciani, Sottocorno, Taddei, Casati, Franchi, Djade and Nobili2014; González-Bueno et al., Reference González-Bueno, Calvo-Cidoncha, Sevilla-Sánchez, Espaulella-Panicot, Codina-Jané and Santos-Ramos2017). These circumstances reduce the effectiveness of health recommendations and increase health expenditure (Soria Trujano, Vega Valero y Nava Quiroz, Reference Soria Trujano, Vega Valero and Nava Quiroz2009; Napolitano et al., Reference Napolitano, Napolitano and Angelillo2015; González-Bueno et al., Reference González-Bueno, Calvo-Cidoncha, Sevilla-Sánchez, Espaulella-Panicot, Codina-Jané and Santos-Ramos2017; Lemay et al., Reference Lemay, Waheedi, Al-Sharqawi and Bayoud2018; Pantuzza et al., Reference Pantuzza, Ceccato, Silveira, Junqueira and Reis2017; Shahin, Kennedy y Stupans, Reference Shahin, Kennedy and Stupans2019; Alsaqabi y Rabbani, Reference Alsaqabi and Rabbani2020; Wu et al., Reference Wu, Chen, Talley and Kuo2021; Yang et al., Reference Yang, Hui, Zeng, Liu and Lee2020). Inadequate AT may rise the likelihood of treatment errors, develop dissatisfaction and affect DPR (Cófreces, Ofman y Dorina, Reference Cófreces, Ofman and Dorina2014; Pasina et al., Reference Pasina, Brucato, Falcone, Cucchi, Bresciani, Sottocorno, Taddei, Casati, Franchi, Djade and Nobili2014; Prados-Moreno et al., Reference Prados-Moreno, Sabio, Pérez-Mármol, Navarrete-Navarrete and Peralta-Ramírez2018; Reyes-Flores et al., Reference Reyes-Flores, Trejo-Alvarez, Arguijo-Abrego, Jimenez-Gómez, Castillo-Castro, Hernández-Silva and Mazzoni-Chávez2016), due to the complexity of managing drug treatment in people with chronic pathologies and poor adherence (Kvarnström, Airaksinen y Liira, Reference Kvarnström, Airaksinen and Liira2018).
Chronic non-communicable diseases are the leading cause of morbidity and mortality worldwide (Castañeda Hernández, Reference Castañeda Hernández2015). They are more frequent in the elderly (Cavalcanti et al., Reference Cavalcanti, Doring, Portella, Bortoluzzi, Mascarelo and Dellani2017), who also have higher morbidity (Ramos Morales, Reference Ramos Morales2015). Although the prevalence of chronic diseases is increasing globally, AT remains persistently low (Kvarnström, Airaksinen y Liira, Reference Kvarnström, Airaksinen and Liira2018). In developed countries, the WHO establishes 50% AT in patients with chronic diseases (Sabaté y World Health Organization, Reference Sabaté2003; Benavides et al., Reference Benavides, Jaramillo Rosero, Rendón, Valenzuela, Argotty and Mafla2013). In the last 30 years it has remained between 20 and 50%, being higher in acute than in chronic diseases (Romero, Reference Romero2014; Alsaqabi y Rabbani, Reference Alsaqabi and Rabbani2020). In Spain around 33 to 50% of elderly patients do not take their medication properly (Palop Larrea y Martínez Mir, Reference Palop Larrea and Martínez Mir2004). Insufficient AT is an important determinant of morbidity and mortality in chronic pathologies and is currently relevant due to the progressive ageing of the population and the rise in the prevalence of these diseases.
One factor that can affect AT is DPR, understood as a complex phenomenon made up of various aspects. These include patient-doctor communication, patient satisfaction and participation in decision-making (Martín-Fernández et al., Reference Martín-Fernández, Cura-González, Gómez-Gascón, Fernández-López, Pajares-Carabajal and Moreno-Jiménez2010; Amin et al., Reference Amin, Soliman, McIvor, Cave and Cabrera2020). Deficient DPR can contribute to erroneous beliefs and inadequate knowledge about medication, which can affect adherence in chronic diseases, along with a lack of shared decision-making and inadequate understanding of illness (Amin et al., Reference Amin, Soliman, McIvor, Cave and Cabrera2020). Enhanced patient-physician communication and trust would lead to better AT and consequently better health outcomes (Ibrahim et al., Reference Ibrahim, Schommer, Morisky, Rodriguez, Gaither and Snyder2021; Jiraporncharoen et al., Reference Jiraporncharoen, Pinyopornpanish, Junjom, Dejkriengkraikul, Wisetborisut, Papachristou, Hashmi and Angkurawaranon2020). Adequate DPR has been confirmed to have a small but significant effect on AT. It should be valued as a fundamental tool for adequate AT (Reyes-Flores et al., Reference Reyes-Flores, Trejo-Alvarez, Arguijo-Abrego, Jimenez-Gómez, Castillo-Castro, Hernández-Silva and Mazzoni-Chávez2016) that affects health outcomes (Kelley et al., Reference Kelley, Kraft-Todd, Schapira, Kossowsky, Riess and Timmer2014).
In this context, studies and clinical guidelines focus on individual pathologies, but Primary Care (PC) consultations face multiple healthcare challenges conditioned by multiple conditions and polypharmacy (Nuñez Montenegro et al., Reference Núñez Montenegro, Montiel Luque, Martín Aurioles, Torres Verdú, Lara Moreno and González Correa2014), and it is essential to know and quantify the factors that influence AT.
This study is therefore based on the hypothesis that good patient-doctor relationship is associated with adherence to treatment and lifestyle recommendations among patients with chronic conditions. The main aim was thus to assess the association between effective patient-doctor relationship and the AT and lifestyle recommendations made by family doctors to patients with multiple chronic conditions.
Methods
A multicentre, cross-sectional survey was conducted in 23 health centres in the Region of Murcia (Spain) between 01/2022 and 03/2022 (data collection lasted approximately 3 months). Inclusion criteria were age between 18 and 85 years, patients with multiple pathologies (diagnosed with at least two chronic pathologies, according to the Charlson comorbidity index) and with basic reading and writing skills. The exclusion criteria were cognitive impairment that made it difficult to understand the study, dependency, not knowing how to read and/or write or not agreeing to take part. The study was approved by the health care ethics committee of the participating health areas.
The selection of potential patients was carried out by the Deputy Directorate-General for Information Technology of the Murcia Health Service, which identified them in the database of our Electronic Health Record Management Program for Primary Care (OMI AP). Random sampling was used to obtain a sample of patients who met the inclusion criteria and none of the exclusion criteria. These patients came from the quotas of the 49 participating doctors. Data collection was performed by means of self-administered questionnaires to the patients, after the physician researcher explained the aims and content of the study, agreed to participate and signed the informed consent form. To calculate the sample size, the following was considered: infinite population, 95% confidence level, precision 7%, expected proportion 40% and expected proportion of losses 7%. The sample size was estimated using the formula for a proportion in an infinite population, n= Z2·p·(1−p)/d 2, where Z = 1.96 (95% confidence level), p = 0.40 (expected proportion) and d = 0.07 (precision). This yielded 188 participants, which, after adjusting for an expected 7% loss rate [n/(1−0.07)], resulted in a final loss-adjusted sample size of 202 patients. The participation rate was very high, as all patients to whom the study was offered agreed to take part. Following the first analysis, one case was excluded due to incomplete questionnaire responses, meaning the study was ultimately conducted on a sample of 201 patients.
The Therapeutic Adherence Scale (EAT, for its acronym in Spanish) was used to assess AT (Soria Trujano, Vega Valero y Nava Quiroz, Reference Soria Trujano, Vega Valero and Nava Quiroz2009). It consists of 21 items grouped into three dimensions: ‘Control over medication and food intake’, ‘Medical-behavioural monitoring’ and ‘Self-efficacy’ (hereafter referred to as ‘Control’, ‘Monitoring’ and ‘Self-efficacy’). This scale gives a score from 0 to 100 for each of the items and dimensions. It classifies as low adherence a score from 0 to 33, moderate adherence from 34 to 67 points and high adherence between 68 and 100 points (Olvera Arreola, Reference Olvera Arreola2012). The questionnaire is validated in Spanish (Soria Trujano, Vega Valero y Nava Quiroz, Reference Soria Trujano, Vega Valero and Nava Quiroz2009). Throughout this manuscript, AT refers to the construct, which was operationalized by the EAT scale; the categorized global EAT score constitutes the adherence outcome used as the dependent variable in the models.
The DPR was assessed using the PREMEPA questionnaire on the perception of the doctor–patient relationship (Ramos Rodríguez, Reference Ramos Rodríguez2008a). It consists of 11 items distributed in 6 dimensions: empathy, courtesy, humanity, trust, patient participation in decision-making and intention to return to the consultation (Ramos Rodríguez, Reference Ramos Rodríguez2008a). Previously, a cross-cultural adaptation and validation was carried out for use in chronic PC patients in our setting (Zarza-Arribas et al., Reference Zarza-Arribas, Menárguez Puche, Morales López, Barber Valles and Orozco Beltrán2024). The items are assessed using a 5-choice Likert scale. DPR was defined as inadequate up to 13 points, moderately adequate between 14 and 24 points and adequate with a score of more than 24 points.
In the first phase, descriptive analysis of the data was carried out, and in the second phase, bivariate and multivariate modelling analyses were performed. In the initial analysis, a large majority of patients reported ‘high’ AT scores. This ceiling effect (a marked accumulation of scores in the highest category) left little variability for analysis. Therefore, to recover analytical sensitivity, the highest category of the EAT and of each of its dimensions was split into two subcategories: ‘high’ (68–83 points) and ‘very high’ (≥84 points).
During the modelling phase, a bivariate linear correlation analysis and the corresponding Chi-square test were first carried out. Subsequently, log-linear models (based on the generalized linear model, Poisson regression) were used to study the relationships between variables. In practical terms, an exponentiated coefficient [exp(B)] greater than 1 indicates that higher levels of a given factor are associated with a higher expected count in the upper adherence categories, whereas a value below 1 indicates the opposite; a 95% confidence interval excluding 1 denotes statistical significance. This analysis included 97.5% of the cases (5 cases excluded). The dependent variable was the global adherence category derived from the EAT, in four levels (low, moderate, high and very high). The categorized PREMEPA score was the weighting variable, and the EAT subdimensions (control, monitoring, self-efficacy), together with the PREMEPA dimensions, age, sex and number of drugs, were entered as covariates. Because the EAT subdimensions are components of the same instrument as the global score, part of their association is expected (a part–whole relationship), as noted in the limitations. The degree of association was assessed by Cramer’s V. Prior to fitting, goodness-of-fit and omnibus tests gave acceptable results, supporting the validity of the log-linear model.
Results
The study was finally conducted on 201 patients, 56.1% of whom were women. 45.7% were between 60 and 75 years old, 23.9% between 45 and 59 years old and 21.3% were older than 75 years old.
Of the 49 participating doctors, 73.5% were women. 48.5% were over 55 years old, while 44.4% were between 40 and 55 years old. 68.4% of these participating doctors belonged to urban health centres, while 31.6 per cent worked in rural areas. In addition, 77.7% of the participating doctors had specific training in communication skills.
Before analysing the questionnaires, their reliability was assessed; it was found to be adequate in both cases, with a Cronbach’s α of 0.767 for the EAT and 0.711 for the PREMEPA questionnaire.
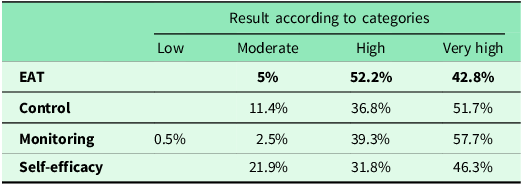
In the EAT assessment, 95% of the patients scored high adherence. When segmenting this high adherence category: 52.2% of patients had high adherence and 42.8% very high adherence. Considering the four possible categories for each EAT dimension, the most common outcome was a very high adherence in all, followed by high adherence. These data are detailed in Table 1.
Percentage distribution of the distribution by categories of the EAT questionnaire and its dimensions

Table 1 Long description
The table presents the percentage distribution of adherence categories in the EAT questionnaire and its dimensions. It has four rows and four columns. The columns are labeled Low, Moderate, High, and Very high. The rows are labeled EAT, Control, Monitoring, and Self-efficacy. Row 1: EAT, Low, 5 percent; Moderate, 52.2 percent; High, 42.8 percent; Very high, not applicable. Row 2: Control, Low, 11.4 percent; Moderate, 36.8 percent; High, 51.7 percent; Very high, not applicable. Row 3: Monitoring, Low, 0.5 percent; Moderate, 2.5 percent; High, 39.3 percent; Very high, 57.7 percent. Row 4: Self-efficacy, Low, 21.9 percent; Moderate, 31.8 percent; High, 46.3 percent; Very high, not applicable.
For the PREMEPA questionnaire, 86.6% of the patients achieved a high score for perception of DPR. The remaining 13.4% scored moderate, as there were no participants who perceived an inadequate DPR.
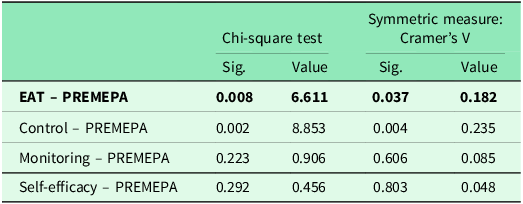
A Chi-square test was performed between adherence to treatment and DPR, also considering the dimensions. This test was statistically significant overall (Cramer’s V 0.182), reflecting a weak association (p < 0.05). Regarding the EAT dimensions, the result was similar for ‘Control’ (p < 0.01). The dimensions ‘Monitoring’ and ‘Self-efficacy’ did not have statistically significant results. In these tests the behaviour of the residuals was as expected. Table 2 develops these results. This analysis was repeated grouping the categories low and moderate, with little variation in the results.
Analysis of the association between perception of the DPR (PREMEPA questionnaire) and adherence to treatment (EAT)

Table 2 Long description
A table comparing Chi-square test and Symmetric measure for different dimensions. The table has four rows and three columns. The columns are labeled Chi-square test Sig, Chi-square test Value, Symmetric measure: Cramer's V Sig, and Symmetric measure: Cramer's V Value. The rows are labeled EAT - PREMEPA, Control - PREMEPA, Monitoring - PREMEPA, and Self-efficacy - PREMEPA. Row 1: Chi-square test Sig, 0.008; Chi-square test Value, 6.611; Symmetric measure: Cramer's V Sig, 0.037; Symmetric measure: Cramer's V Value, 0.182. Row 2: Chi-square test Sig, 0.002; Chi-square test Value, 8.853; Symmetric measure: Cramer's V Sig, 0.004; Symmetric measure: Cramer's V Value, 0.235. Row 3: Chi-square test Sig, 0.223; Chi-square test Value, 0.906; Symmetric measure: Cramer's V Sig, 0.606; Symmetric measure: Cramer's V Value, 0.085. Row 4: Chi-square test Sig, 0.292; Chi-square test Value, 0.456; Symmetric measure: Cramer's V Sig, 0.803; Symmetric measure: Cramer's V Value, 0.048.
The same statistical analysis was performed for each population group in the sample. In women, a weak association was shown between PREMEPA and EAT, and a moderate association between PREMEPA and the ‘Control’ dimension (Cramer’s V values of 0.26 and 0.34, respectively). In those over 60 years of age, the association of PREMEPA with EAT and with the ‘Control’ dimension was weak (Cramer’s V-value of 0.25 and 0.24, respectively). The same study was also conducted in men and other age groups without obtaining statistically significant results.
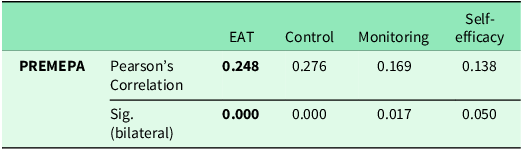
A linear correlation study of DPR (PREMEPA) with each dimension of the EAT questionnaire was performed, considering the final quantitative score of both questionnaires. As Table 3 shows, all correlations were statistically significant.
Table analysing the correlation between the perception of the DPR (PREMEPA questionnaire) and adherence to treatment (EAT), including also the dimensions of EAT

Table 3 Long description
A table analyzing the correlation between the perception of the DPR (PREMEPA questionnaire) and adherence to treatment (EAT), including the dimensions of EAT. The table has 2 rows and 4 columns. The row labels are Pearson's Correlation and Sig. (bilateral). The column headers are EAT, Control, Monitoring, and Self-efficacy. Row 1: Pearson's Correlation, EAT 0.248, Control 0.276, Monitoring 0.169, Self-efficacy 0.138. Row 2: Sig. (bilateral), EAT 0.000, Control 0.000, Monitoring 0.017, Self-efficacy 0.050.
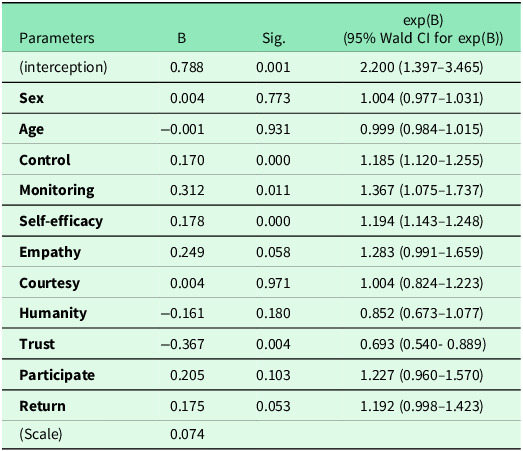
Generalized linear analysis showed an overall significant model (p < 0.001). The factors positively associated with higher adherence were gender, control, monitoring, self-efficacy, empathy, courtesy, participation in decision-making and return to consultation. The covariates humanity and trust (both from the PREMEPA questionnaire) showed a negative association. The full results are presented in Table 4.
Summary of the generalised linear model between perception of the DPR (PREMEPA questionnaire) and adherence to treatment (EAT). The 95% confidence interval is included in column exp(B)

Table 4 Long description
A table with 14 rows and 5 columns summarizing the results of a generalized linear model. The columns are labeled Parameters, B, Sig., exp(B), and 95% Wald CI for exp(B). The table includes data on various factors such as Sex, Age, Control, Monitoring, Self-efficacy, Empathy, Courtesy, Humanity, Trust, Participate, and Return. Each row provides the B value, significance level, exp(B) value, and 95% Wald confidence interval for exp(B) for each parameter. Notable trends include significant positive associations for Control, Monitoring, Self-efficacy, and significant negative associations for Trust.
Note: the dependent variable is the global adherence category (EAT, four levels); the EAT subdimensions (control, monitoring, self-efficacy) and the PREMEPA dimensions are entered as covariates. exp(B) > 1 indicates a higher expected count in the upper adherence categories; a 95% CI excluding 1 denotes statistical significance.
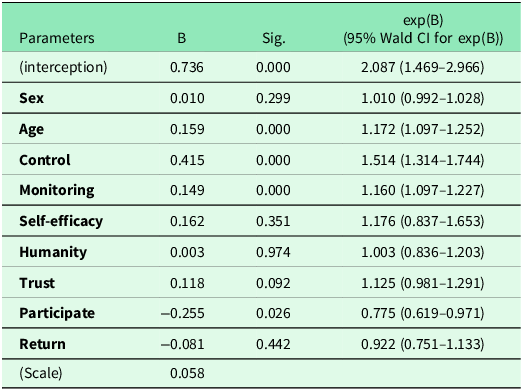
Since the Chi-square test analysis had shown an association between PREMEPA and EAT only in the female population groups and in patients over 60 years of age, it was decided to repeat the analysis only for these population groups.
Generalized linear statistical analysis in women confirmed a significant model, with a positive association of the global adherence outcome (EAT category) with the EAT subdimensions of control, monitoring and self-efficacy. The empathy, courtesy and humanity dimensions were positively associated with adherence, while the return dimension did not yield a valid result. These results are shown in Table 5.
Table summarising the generalised linear model between the perception of the DPR (PREMEPA questionnaire) and adherence to treatment (EAT) for women. The 95% confidence interval is included in column exp(B)

Table 5 Long description
A table summarizing the generalized linear model between the perception of the DPR and adherence to treatment for women. The table has 12 rows and 4 columns. The columns are labeled Parameters, B, Sig., and exp(B) (95% Wald CI for exp(B)). The rows list various parameters including (interception), Sex, Age, Control, Monitoring, Self-efficacy, Humanity, Trust, Participate, and Return. Each row provides values for B, Sig., and exp(B) with corresponding 95% Wald confidence intervals. Notable parameters with significant values (Sig. = 0.000) include Age, Control, and Monitoring, indicating a strong association with adherence to treatment.
Note: the dependent variable is the global adherence category (EAT, four levels); the EAT subdimensions (control, monitoring, self-efficacy) and the PREMEPA dimensions are entered as covariates. exp(B) > 1 indicates a higher expected count in the upper adherence categories; a 95% CI excluding 1 denotes statistical significance.
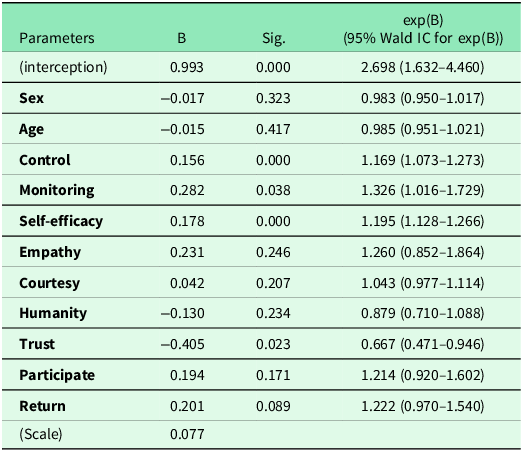
In people over 60 years of age, the global adherence outcome (EAT category) was positively associated with the EAT subdimensions and with the PREMEPA dimensions of empathy, courtesy, participation and return. These results are shown in Table 6.
Table summarising the generalised linear model between the perception of DPR (PREMEPA questionnaire) and adherence to treatment (EAT) in people over 60 years of age. The 95% confidence interval is included in column exp(B)

Table 6 Long description
A table summarizing the generalized linear model between the perception of DPR and adherence to treatment in people over 60 years of age. The table has 14 rows and 5 columns. The columns are labeled Parameters, B, Sig., exp(B), and 95% Wald IC for exp(B). The rows include various parameters such as Sex, Age, Control, Monitoring, Self-efficacy, Empathy, Courtesy, Humanity, Trust, Participate, and Return. Each row lists the corresponding values for B, Sig., exp(B), and the 95% Wald IC for exp(B). Notable values include significant p-values for Control, Monitoring, Self-efficacy, and Trust, indicating their positive or negative association with adherence to treatment.
Note: the dependent variable is the global adherence category (EAT, four levels); the EAT subdimensions (control, monitoring, self-efficacy) and the PREMEPA dimensions are entered as covariates. exp(B) > 1 indicates a higher expected count in the upper adherence categories; a 95% CI excluding 1 denotes statistical significance.
Discussion
The importance of this research lies in the fact that it is the first to analyse the role of DPR in AT among patients with multimorbidity in the primary care setting within the Spanish population.
The EAT scale measures the degree to which the patient’s behaviour, in terms of taking medication and prescribed lifestyle changes, aligns with the recommendations set by healthcare professionals (Olvera Arreola, Reference Olvera Arreola2012). This tool was designed and validated for chronic patients (Soria Trujano, Vega Valero y Nava Quiroz, Reference Soria Trujano, Vega Valero and Nava Quiroz2009; Soria Trujano et al., Reference Soria Trujano, Vega Valero, Nava Quiroz and Saavedra Vázquez2011). In the present study, the scale was selected based on its favourable assessment in measuring both therapeutic compliance and lifestyle recommendations. The original validation of the EAT was also carried out using a generalized linear statistical model (Olvera Arreola, Reference Olvera Arreola2012).
The PREMEPA questionnaire allows the quality of DPR to be studied as perceived by patients. It is based on the treatment, interest shown, information provided and resolution of the problem for which the patient consulted (Ramos Rodríguez, Reference Ramos Rodríguez2008a; Ramos Rodríguez, Reference Ramos Rodríguez2008b). There is another questionnaire adapted to Spanish and validated in PC (Doctor-Patient Relationship Questionnaire, PDRQ-9), aimed more specifically at patient satisfaction with DPR (Martín-Fernández et al., Reference Martín-Fernández, Cura-González, Gómez-Gascón, Fernández-López, Pajares-Carabajal and Moreno-Jiménez2010). The PREMEPA questionnaire was preferred because it was considered more complete, assessing DPR more broadly and with a more focused approach to shared decision-making than the PDRQ-9.
In our search for information, we found few studies that analysed the relationship between AT and DPR, which impeded us to compare the results of our study to those of others. The positive relationship found with DPR factors is consistent with the results of other previous studies, such as Soria Trujano (Soria Trujano et al., Reference Soria Trujano, Vega Valero, Nava Quiroz and Saavedra Vázquez2011), which also used the EAT questionnaire and indicated that patients with better doctor–patient communication obtained greater adherence, thereby supporting the positive relationship identified with empathy, courtesy, participation and return in our model.
Multiple factors influencing AT have been described in literature, widely pointing to the importance of DPR (Romero, Reference Romero2014; Shahin, Kennedy y Stupans, Reference Shahin, Kennedy and Stupans2019; Amin et al., Reference Amin, Soliman, McIvor, Cave and Cabrera2020), although it is not quantified. Considering the differences written down by population groups, empathy was the DPR factor with the greatest influence on AT. Empathy is a fundamental component of DPR, extensively documented in the literature (Bellón, Reference Bellón2001; Kelley et al., Reference Kelley, Kraft-Todd, Schapira, Kossowsky, Riess and Timmer2014), highlighting its impact on improving patient satisfaction and AT (Mendoza, Ramos Rodríguez y Gutiérrez, Reference Mendoza, Ramos Rodríguez and Gutiérrez2016), corroborating our findings of a positive relationship with adherence in the Log-linear model.
Trust is a key element of DPR (Martín-Fernández et al., Reference Martín-Fernández, Cura-González, Gómez-Gascón, Fernández-López, Pajares-Carabajal and Moreno-Jiménez2010; Kelley et al., Reference Kelley, Kraft-Todd, Schapira, Kossowsky, Riess and Timmer2014) and a contributing factor to adherence (Cófreces, Ofman y Dorina, Reference Cófreces, Ofman and Dorina2014; Wu et al., Reference Wu, Chen, Talley and Kuo2021). Lack of trust in the healthcare professional is a predictor of low adherence (Bender, Reference Bender2014). In contrast, our model showed a counter-intuitive negative coefficient for trust, across the whole sample and in the subgroups of women and patients over 60 years. Rather than a true inverse effect, this most likely reflects statistical instability: the very limited variability of the PREMEPA scores (86.6% of patients reported an adequate relationship, with no inadequate ratings) produced a ceiling effect, and the high inter-correlation among PREMEPA dimensions (trust, humanity and empathy) can generate multicollinearity and suppression effects, yielding unstable and occasionally sign-reversed coefficients with wide confidence intervals. Measurement limitations of self-reported scales may also contribute. This finding should therefore be interpreted with caution and not as evidence that greater trust reduces adherence. A similar caveat applies to courtesy, whose coefficient was not significant in the full sample.
Patient participation is another important aspect of DRP (Martín-Fernández et al., Reference Martín-Fernández, Cura-González, Gómez-Gascón, Fernández-López, Pajares-Carabajal and Moreno-Jiménez2010), referring to shared decision-making, facilitating adequate adherence (Cófreces, Ofman y Dorina, Reference Cófreces, Ofman and Dorina2014; Reyes-Flores et al., Reference Reyes-Flores, Trejo-Alvarez, Arguijo-Abrego, Jimenez-Gómez, Castillo-Castro, Hernández-Silva and Mazzoni-Chávez2016) and reflected in the positive relationship obtained in our log-linear model for the entire sample and the group aged over 60 years of age, with no explanation for the negative result in the group of women.
Our results are consistent with the view that limited ability to follow recommendations is a risk factor for low adherence (Benavides et al., Reference Benavides, Jaramillo Rosero, Rendón, Valenzuela, Argotty and Mafla2013; Reyes-Flores et al., Reference Reyes-Flores, Trejo-Alvarez, Arguijo-Abrego, Jimenez-Gómez, Castillo-Castro, Hernández-Silva and Mazzoni-Chávez2016). This capacity corresponds to ‘self-efficacy’ – believing in one’s own ability to manage chronic diseases (Shahin, Kennedy y Stupans, Reference Shahin, Kennedy and Stupans2019; Wu et al., Reference Wu, Chen, Talley and Kuo2021) – and improving it in older patients could enhance adherence (Mahmoodi et al., Reference Mahmoodi, Jalalizad Nahand, Shaghaghi, Shooshtari, Jafarabadi and Allahverdipour2019). ‘Control’, as an intrinsic part of AT derived from the WHO definition, was also positively associated with adherence.
As mentioned by Sustersic et al. (Reference Sustersic, Gauchet, Kernou, Gibert, Foote, Vermorel, Bosson and Graetz2018), there is no consensus definition in the medical and psychological literature of what should be measured by doctor–patient communication. Furthermore, the dimensions commonly used are not universal, making it difficult to compare the results obtained with those of previous studies.
We also observed better adherence among women, although evidence on sex differences is inconsistent: some studies link lower adherence to male sex (Castellano-Muñoz et al., Reference Castellano-Muñoz, Miranda-Ruiz, Sojo-González, Perea-Milla, García-Alegría and Dolores Santos-Rubio2008; Tilea et al., Reference Tilea, Petra, Voidazan, Ardeleanu and Varga2018), others to women, while (Naik et al., Reference Naik, Kallen, Walder and Street2008) report better adherence to lifestyle changes among women.
The limitations of this study include: a potentially insufficient sample size, although the estimated sample size was achieved through random sampling and the sample was representative of the target population; possible selection bias due to the voluntary participation of doctors, and due to the type of scales used, as they were self-administered, and due to possible social desirability bias as they were based on patients’ subjective assessments, a limitation inherent to studies employing such questionnaires and scales. A further limitation is that the EAT subdimensions and the global EAT score derive from the same instrument; their association therefore partly reflects a part–whole relationship and should not be read as an independent predictive effect.
From a practical standpoint, these findings offer a useful resource for several stakeholders. For health professionals, they reinforce that investing in communication skills – particularly empathy, courtesy and shared decision-making – may support better adherence and should be incorporated into clinical training and routine consultations with multimorbid patients. For patients and users, the results underline the value of active participation in decisions about their own treatment. For health-service managers and policymakers, they support embedding communication-skills training in continuing professional development and designing primary-care models that protect adequate consultation time, given the association observed between the quality of the doctor–patient relationship and adherence.
Conclusions
This study found that an adequate DPR was associated with greater AT.
By population group, the highest degree of relationship between DPR and adherence was found in women and patients over 60 years of age.
Among the components of DPR that showed the strongest association with adherence to treatment, empathy stands out.
Courtesy and patient participation in shared decision-making were also noted as favourable factors for adequate adherence.
Overall, the magnitude of the associations observed was weak to modest which, together with the cross-sectional design, precludes any causal inference.
For future research, consideration should be given to conducting longitudinal studies, as well as interventions aimed at verifying improvements in treatment adherence through enhanced doctor–patient relationship.
Data availability statement
The data are available upon request from the corresponding author.
Author contributions
All authors have reviewed and approved the final version of the manuscript submitted.
Authorship contribution statement (CRediT Roles) : Maria Zarza-Arribas: Conceptualization, Methodology, Validation, Formal analysis, Investigation, Resources, Data Curation, Writing, Editing, Visualization; Juan Francisco Menárguez Puche: Conceptualization, Methodology, Validation, Resources, Review & Editing. Visualization; Rosario Morales López: Conceptualization, Resources, Review & Editing, Visualization; Josep Xavier Barber Valles: Methodology, Validation, Review, Visualization; Domingo Luis Orozco Beltrán: Methodology, Review, Visualization.
Funding statement
This study received funding from the semFYC private foundation when it won an Isabel Fernández 2023 grant for doctoral thesis and 4th Salvador Tranche Prize for Research in Family Medicine (article category) in 2025.
Competing interests
The authors declare no conflicts of interest in publishing this article.
Ethical standards
This work has been approved by the ethics committees of the Santa María del Rosell University Hospital and the Morales Meseguer General University Hospital of the Murcian Health System. All participating patients were duly informed and provided their written informed consent for inclusion in the study.
Use of artificial intelligence
Artificial intelligence has not been used at any stage of the development or preparation of this work.

 Open access

