Introduction
Many scholars agree that key observable elements of a range of public sector reforms implemented in recent years such as disaggregation, competition and incentivisation have not produced the expected gains in terms of, for instance, performance improvements or cost reductions (see e.g. Hood and Peters Reference Hood and Peters2004; Dunleavy et al. Reference Dunleavy, Margetts, Bastow and Tinkler2005; Meier and O'Toole Reference Meier and O'Toole2008). The article does not question this widely held consensus. Instead, the dashed expectations on a range of economic and performance-related parameters invite a closer look at a potential and valuable political side effect of such reforms, namely, blame avoidance. It may turn out that devolution of authority to public enterprises, for instance, does not result in (expected levels of) service improvements or cost reductions. However, if it does transfer blame down the system, this may be an important asset for political incumbents (Fiorina Reference Fiorina1982; Weaver Reference Weaver1986; Horn Reference Horn1995; Hood Reference Hood2011).
Given the discrepancy between how much attention the concept of blame avoidance has received in explanations of choices over institutional design, and how little attention it has been offered in empirical studies of reform effects, this article advocates increased scholarly focus on the blame avoidance effects of public sector reforms.
The article advances this research agenda on blame (avoidance) effects from public sector reform in two ways. Firstly, based on the large but somewhat scattered literature on blame avoidance, it discusses blame avoidance (and credit claiming) effects from public sector reforms that involve changes in the formal allocation of authority. Secondly, it investigates such effects empirically based on a major public sector reform, the Norwegian hospital reform of 2002. Like many other new public management (NPM)-inspired public sector reforms (see e.g. Hood et al. Reference Hood, James, Jones, Scott and Travers1999, 193; Stark Reference Stark2002; Soss et al. Reference Soss, Fording and Schram2011), the Norwegian hospital reform contains disparate traits of both separation and centralisation. Rather than a pure market and management model, a decentralised company structure has been integrated into a system of relatively tight executive control and instruction from the central government. The reform has brought about a complete centralisation of financial competence by transferring ownership from the regional counties to the central state and by giving the minister of health overall responsibility for the management of hospital services (Opedal and Rommetvedt Reference Opedal and Rommetvedt2010; Kjekshus and Veggeland Reference Kejkshus and Veggeland2011).
This reform offers a unique opportunity to actually assess empirically whether the centralising changes in terms of regulation and ownership responsibility outweigh the increased delegation of health-care provision management to separate legal health-care enterprises. The question is which of these dimensions of change in the formal allocation of authority tends to be reflected in public attribution of responsibility when things go wrong within the Norwegian health-care sector?
The main data source for the empirical examination consists of a systematic content coding of more than 1,200 newspaper articles about health-care issues before and after the hospital reform in Norway implemented 1 January 2002. Media coverage is of course not the only indicator of blame avoidance or credit claiming effects, but given the media's central role in shaping people's perception and understanding of public issues (Iyengar Reference Iyengar1989; Hetherington Reference Hetherington1996; Gilens and Murakawa Reference Gilens and Murakawa2002), news media offer a natural starting point for investigating the link between changes in the design of government institutions and public attribution of responsibility.Footnote 1
Blame avoidance and changes in the formal allocation of authority
Traditionally, the effects of changes in the formal allocation of authority have been evaluated in terms of efficiency gains, cost reductions, credibility and performance improvements. In recent years, however, there has been increased scholarly attention to other and more subtle political benefits from changes in the formal allocation of authority. Particularly, it has been claimed that such changes are (also) about directing public blame away from the reformers when things go wrong (see e.g. Hood and Lodge Reference Hood and Lodge2006; Weimer Reference Weimer2006; Hood Reference Hood2011, Chapter 4).
Such claims are typically inspired by Reference FiorinaFiorina's work on regulatory policies, where he argues that: “by charging the agency with the implementation of a general regulatory mandate, legislators […] avoid or at least disguise their responsibility for the consequences of the decisions ultimately made” (1982, 47). Applying this idea to the domain of public service provision, Christopher Hood (Reference Hood2011, 68) argues:
… whether or not privatization, agencification, and outsourcing of public service provision really do cut costs, improve quality, or produce all the other effects that are so confidently and earnestly claimed for them (on the basis of so little hard evidence), what those arrangements can offer is the apparent prospect of shifting blame away from politicians and central bureaucrats to private or independent operators.
The argument rests on the assumption that a close relationship exists between institutional (re-)allocation of responsibility and public assignment of blame (see also Hood Reference Hood2007, 201). Recently, this basic assumption has been corroborated in laboratory studies. Bartling and Fischbacher (Reference Bartling and Fischbacher2012) demonstrate in a set of experiments that responsibility can be effectively shifted by delegating an unpopular decision to an agent (see also Hamman et al. Reference Hamman, Loewenstein and Weber2010). Coffman (Reference Coffman2011) extends these insights by demonstrating that the use of intermediaries generally reduces punishment from a third party even when the intermediary actor is completely passive.
This is strong and important experimental evidence that information about changes in formal authority matters to people's assignment of responsibility for unpopular outcomes. Furthermore, research on government popularity has shown that the process of assigning responsibility is crucial for voters’ decision to reward or punish governmental actors. For instance, perceptions of national economic conditions exert more influence on presidential approval when an attribution of presidential responsibility is made (see Peffley and Williams Reference Peffley and Williams1985; Nicholson et al. Reference Nicholson, Segura and Woods2003; Rudolph Reference Rudolph2003). Similarly, perceptions of state conditions have a greater impact on gubernatorial support when an attribution of gubernatorial responsibility is made (see Atkeson and Partin Reference Atkeson and Partin2001; Arceneaux Reference Arceneaux2006). In other words, voters do not behave as myopic automatons. Instead, they do use available information and cues about institutional responsibilities.
The important lessons of this research are that information matters to responsibility assignment and assignment of responsibility may affect voter sanctioning of governmental actors. What we do not know is how public sector reforms may change blame attribution when things go wrong, as well as assignment of credit when things go well.
Firstly, institutional settings are characterised by more or less power sharing and thus some inherent ambiguity that leaves room for interpretation about who is in fact responsible for a given outcome (see e.g. Birkland and Waterman Reference Birkland and Waterman2008; Maestas et al. Reference Maestas, Atkeson, Croom and Bryant2008). Though NPM reforms, for instance, have often been claimed to clarify such lines of competence and responsibility, the fact is that they are embedded in political systems where delegation of authority on one dimension is often mirrored by increased oversight and central control on another dimension (Schick Reference Schick1996, 42; Hood et al. Reference Hood, James, Jones, Scott and Travers1999, 193).
Secondly, as noted by Hood (Reference Hood2002b, 27), delegatees’ reluctance to accept the role of public scapegoat may reduce the incumbents’ benefit from a change in the direction of more delegation of authority. McGraw (Reference McGraw1990, Reference McGraw1991) lists a range of excuses that delegatees may use to shift blame back to the delegator. Similarly, the delegator may be tempted to seek public credit for benign outcomes, despite a delegation of formal authority, a strategy that might result in a deadlock, where the delegator seeks to delegate blame but not credit, and the delegatee accepts credit but not blame (cf. Hood Reference Hood2002a, 326).
Thirdly, the public visibility of the delegator may be so strong relative to the visibility of the delegatee that public blame/credit always sticks to the delegator. This argument has its proponents in a US context where it has been argued that the president and the White House are so visible that no one, in any real sense, can share the burden of blame (Laski Reference Laski1940; Cronin Reference Cronin1980). This critical view of the “shift the responsibility” rationale has also been extended to parliamentary systems, where Horn (Reference Horn1995, 46) argues that in a parliamentary system legislators cannot shift the responsibility for delegated decisions (see also Bishop Reference Bishop1990). Moreover, as argued by Ellis (Reference Ellis1994), delegatees may at times even become a liability to the delegator in the sense that they do attract criticism; however, rather than deflecting blame away from the delegator, they generate dissatisfaction with the delegator. Cases of ministerial resignations provide several examples of this phenomenon (Thompson and Tillotsen Reference Thompson and Tillotsen1999; Woodhouse Reference Woodhouse2004).
Above all, this discussion illustrates that there is nothing trivial or self-evident in assuming a strong link between changes in the distribution of formal responsibility and attribution of public blame when stories of administrative failures or policy fiascos hit the newspapers. To move the literature on public sector reform and blame avoidance beyond mere speculation, we have to begin investigating blame avoidance effects empirically. As argued in the following sections, the Norwegian hospital reform from 2002 offers a strong starting point for such an endeavour.
The 2002 Norwegian hospital reform
The Norwegian hospital reform was decided by a majority in the national parliament (Stortinget) in 2001 and implemented by 1 January 2002. Central to the reform was a distinct NPM-inspired separation of political–administrative relations, changing the organisational form of hospitals from public administration entities to health enterprises (Lægreid et al. Reference Lægreid, Opedal and Stigen2005; Opedal and Rommetvedt Reference Opedal and Rommetvedt2010; Kjekshus and Veggeland Reference Kejkshus and Veggeland2011). More specifically, five regional health enterprisesFootnote 2 with separate professional boards have been established under the Ministry of Health. The regional health enterprises are separate legal entities and thus not an integral part of the central government administration (Kjekshus and Veggeland Reference Kejkshus and Veggeland2011, 1036). In other words, the reform implied a change from a traditional integrative model to a model of separation, where the enterprise model should protect the enterprises from governing in detail by the central state owner (see Opedal and Rommetvedt Reference Opedal and Rommetvedt2010, 196; Kjekshus and Veggeland Reference Kejkshus and Veggeland2011).
Like health-care reforms in many other countries as well as other public administration reforms, the Norwegian hospital reform is a hybrid adapted to the specific Norwegian historical–institutional context (Lægreid et al. Reference Lægreid, Opedal and Stigen2005, 1033). Rather than being a pure market and management model, the decentralised company structure has been integrated into a system of relatively tight executive control and instruction from the central government. The reform has brought about a complete centralisation of financial competence by transferring ownership from the regional counties to the central state, and by giving the minister of health overall responsibility for the management of hospital services (Opedal and Rommetvedt Reference Opedal and Rommetvedt2010). Furthermore, and contrary to the county councils, members of the new regional boards are professionals appointed by the minister of health, not elected by popular vote.Footnote 3 Since the 1970s, and up to the reform in 2002, hospitals were integrated parts of the counties’ administration. Delivery of health-care services was the responsibility of the directly elected county councils, but took place within a national regulatory framework and a set of agreements between central and county authorities. The Norwegian reform, as noted by Lægreid et al. (Reference Lægreid, Opedal and Stigen2005, 1034): “… marked the end of thirty years of ownership by the nineteen counties and may signify a break with the common Nordic decentralized model of health care”. Thus, on the ownership dimension, the Norwegian reform implies a clear centralising movement (see also Kjekshus and Veggeland Reference Kejkshus and Veggeland2011).
If the move towards independent health enterprises on the political–administrative dimension is decisive to public responsibility attribution, we would expect the Norwegian reform to result in decreased attribution of responsibility (blame and credit) to the central state-level government. However, things may be different, if it turns out that the centralisation of hospital ownership and political–democratic authority from the regional counties to the national government is more important to the attribution of responsibility in public than the delegation of day-to-day responsibility to separate health enterprises.
The relative importance of these changes can only be decided through empirical examination. The disparate traits of both separation and centralisation are not unique to the Norwegian hospital reform and have – in various disguises – been observed in several studies of NPM-inspired reforms (see e.g. Hood et al. Reference Hood, James, Jones, Scott and Travers1999, 193; Stark Reference Stark2002; Soss et al. Reference Soss, Fording and Schram2011). In the present case, it offers the opportunity to actually assess empirically – in terms of blame and credit attribution effects – whether the centralising changes in terms of regulation and ownership responsibility outweigh the increased delegation of health-care provision management to separate legal health-care enterprises. The next section describes how such an empirical evaluation may be conducted.
Measuring attribution of blame and credit
As noted above, research on government popularity has shown that assessment of responsibility conditions voter sanctions of the government, and laboratory studies of delegation and blame assignment have shown that the information available to voters about changes in formal authority influences their assignment of responsibilities. Thus, as most voters receive the bulk of their information and news about politics from the media, media represents an obvious starting point for the investigation of a relationship between public sector reform and public blame. Many people have little factual knowledge about structures of formal responsibility for public service provision (Delli et al. Reference Delli, Michael and Keeter1996), and most people lack direct personal experience with many social issues, which means that they learn about events and issues from the media (Sotirovic Reference Sotirovic2003). Through the content and balance of their coverage, the media hence provide important cues to the public about which institutions or parties may be responsible for particular outcomes (Iyengar Reference Iyengar1989; Brody Reference Brody1991; Gilens and Murakawa Reference Gilens and Murakawa2002). Media coverage is of course not the only indicator of blame or credit effects; however, given the media's central role in shaping people's perception and understanding of public issues, the media offer a natural starting point for measuring public attribution of responsibility for health-care issues.
In this study, responsibility attribution is assessed through a content coding of more than 1,200 articles from regional and national Norwegian newspapers.Footnote 4 Whereas previous blame avoidance studies have focused on newspaper coverage of particular scandals (see e.g. Brändström et al. Reference Brändström, Kuipers and Daléus2008; Hood et al. Reference Hood, Jennings, Dixon, Hogwood and Beeston2009), this research is the first to investigate systematically newspaper coverage before and after a major public sector reform.
The following selection and coding procedures were used. An important objective in terms of years covered was to get comparable observations from both before and after the reform that was decided in 2001 and implemented by 1 January 2002. The bourgeois government led by Kjell Magne Bondevik was in power in 1998–1999 before reform negotiations started and again in 2002–2003 after the reform was implemented. Hence, to increase pre- and post-reform comparability it was decided to analyse Norwegian newspaper coverage of health-care issues in 1998–1999 (before reform negotiations) and again in 2002–2003 (after implementation of the reform). In addition, newspaper coverage in 2005 and again in 2008 was coded to examine delayed and longer term reform effects.
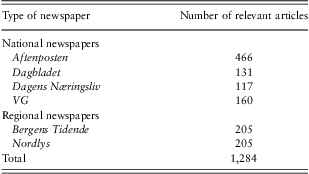
To identify relevant newspaper articles, a set of key word searches was conducted in the electronic database Retriever in the four national newspapers, with the largest circulation and two regional newspapers covering different parts of the country (see Table B.1 in Appendix B for a list of the newspapers). Firstly, a very simple search string was applied that contained only the Norwegian words (including derivatives and compound words) for either hospital or health service. This key word search returned an unmanageable number of between 8,000 and 10,000 articles per year. To reduce the overall number of articles and to make sure that the search also returned articles relevant to the centralising financial elements of the Hospital reform, the Norwegian words (including derivatives and compound words) for expenses or budget were added to the search string. The additional search criterion reduced the number of articles per year to between 500 and 900, which is still high but manageable.
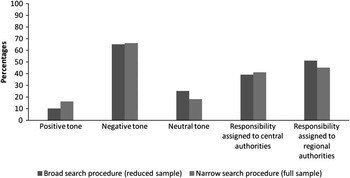
The potential sampling bias induced by this search filter has been investigated in two ways. Firstly, I compared fluctuations in the number of articles per quarter returned by the broad and the narrow search procedure and found that they are strongly correlated (see Appendix A). Secondly, I content coded an additional sample of more than 200 newspaper articles returned by the broad search procedure and compared it with the content coding of the main sample (the content-coding procedure is described below). Again, the results look rather similar across the two samples, which reduce the suspicion of a “peculiar” sample generated by the specific key word search. If there is a difference between the two samples, it may be that the inclusion of expenses and budgets in the search string generates a sample with slightly lower attribution of responsibility to regional-level authorities and generally more attribution of responsibility to central-level authorities, compared with a sample generated by the broader key word search (see Appendix A for more details on the comparison of the two samples).
Excluding the number of irrelevant articles, the applied key word search (including the terms expenses and budget) returned more than 1,200 relevant articles for the years of interest, that is, 1998, 1999, 2002, 2003, 2005 and 2008.Footnote 5 In the next stage, these articles were coded as positive, negative or neutral in their coverage of health-care issues. The main objective was to identify positive and negative newspaper articles in order to subsequently content code the responsibility attributions in these articles. Many conflicting interests are at stake with respect to health-care policy, which means that what is considered positive or negative may depend on who you are and what interests you pursue. In line with the blame avoidance literature's emphasis on re-election-motivated policy-makers (see Weaver Reference Weaver1986), the guiding principle behind the coding has been to identify positive and negative articles from the viewpoint of the majority of voters. For instance, articles noting that public health has improved, that investments in public health have increasedFootnote 6 or that waiting lists have been shortened were coded as positive. Conversely, articles noting a shortage of doctors and nurses, a deterioration of public health, poor treatment of patients, increasing waiting time for treatments, spending cuts in or inadequate health care were coded as negative. Neutral articles were articles that could not meaningfully be coded as either positive or negative.
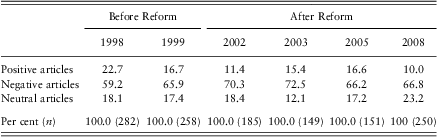
The frequency distribution of articles is shown in Table 1. Firstly, it is important to note how the frequent finding of a negativity bias in public news (cf. Soroka Reference Soroka2006) also applies to health-care news in Norway. In this case, negative articles on average outnumber the positive articles by almost 4:1. This finding, of course, underscores the assumption that, also with respect to public health-care provision, avoiding blame in bad news may be a general and important concern for decision-makers (see also Anand Reference Anand1998).
Categorisation of newspaper articles about health issues
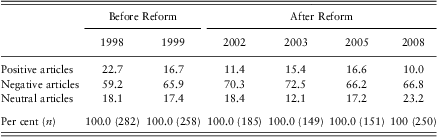
Total number of newspaper articles = 1,275.
Secondly, although Table 1 shows some variation across years, the main impression is that the relative distribution of positive, negative and neutral articles is rather stable before and after the reform. According to Table 1, the reform has not been followed by a significant reduction in the relative number of negative articles about health-care issues.Footnote 7 The question then is whether it has been followed by a relative transfer of blame from one level of government to another.
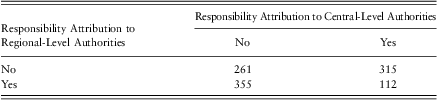
To address this question, the next coding stage was a detailed coding of responsibility assignment in negative and positive articles. To capture attribution of responsibility, all articles were coded with respect to the following criteria: whether a set of national political actors/institutions (e.g. a minister, a national department, the cabinet, the national government, the central state) were actually blamed in negative articles or credited in positive articles; and whether a set of regional actors/institutions (e.g. elected members of county councils/members of regional boards, regional health enterprises) were actually blamed in negative articles or credited in positive articles. In this coding, it is possible that both levels of government get blame (or credit) in the same article; however, as Table 2 shows, shared responsibility is not the main characteristic of these newspaper articles. Reliability scores and further information about the coding procedure are reported in Appendix B.
Responsibility attribution to regional- and central-level authorities
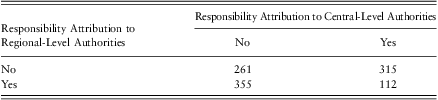
Note: The units are the identified newspaper articles about health-care issues where the tone of coverage has been coded either positive or negative. Measure of association (with standard error in parenthesis): γ = −0.59 (0.05). n = 1,043.
In the following analysis, pre- and post-reform attribution of responsibility is investigated in a set of logit regressions.Footnote 8 In addition to the main reform variable, the analysis statistically controls for two other variables that may affect the media's attribution of responsibility. Firstly, the media's assignment of blame and credit may depend on the type of outlet. For instance, focusing on the case of Hurricane Katrina, Birkland and Waterman (Reference Birkland and Waterman2008) compared coverage in New York Times with coverage in the local New Orleans newspaper Times-Picayune and found significant differences in the number of times President Bush was mentioned compared with New Orleans Mayor, Nagin, and Louisiana Governor, Blanco. Consequently, a control for type of newspaper (national versus regional) is included in the empirical analysis.
Secondly, given the media's fascination with conflicts and high-profile national authorities (Shoemaker and Reese Reference Shoemaker and Reese1996), national representatives may be more involved in negative than in positive newspaper articles. Or put differently, the credit slippage effect may be larger than the blame avoidance effect, which means that it may be more difficult for the central state level to avoid blame for failures and unpopular policies than to lose credit for popular policy improvements (see also Hood Reference Hood2002b, 27). Hence, a control for the tone of coverage (negative versus positive) is included when responsibility attribution is analysed.
The analysis concludes with a critical discussion of potentially relevant alternative explanations as well as a further exploration of the observed reform effects.
Findings
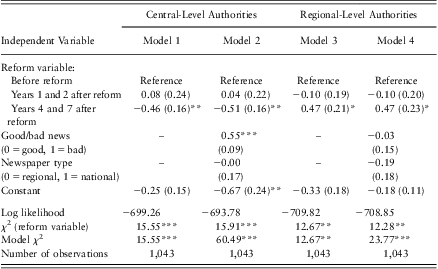
Table 3 reports the results of a set of logit regressions. The units are positive and negative articles about health-care issues with attribution of responsibility to central and/or regional level government.Footnote 9 In Models 1 and 2 in Table 3, the dependent variable is coded such that 0 equals no attribution of responsibility to central-level authorities, and 1 equals attribution of responsibility to central-level authorities. In Models 3 and 4 in Table 3, the dependent variable measures attribution of responsibility to regional authorities and is coded such that 0 equals no attribution of responsibility to regional-level authorities, and 1 equals attribution of responsibility to regional-level authorities. To disentangle potential short- and long-term reform effects, the reform variable is construed as a set of dummy variables, one for the first two years after the reform (2002 and 2003) and one for the last two years after the reform (2005 and 2008). The pre-reform years are used as reference category. Newspaper type is coded as 1 if national newspaper, and 0 if regional newspaper. Negative articles are coded as 1 and positive articles as 0. To take into account the hierarchical structure of the data (articles within newspapers), robust clustered standard errors clustered on newspapers are used (see e.g. Williams Reference Williams2000).Footnote 10
Responsibility attribution (logit regressions)
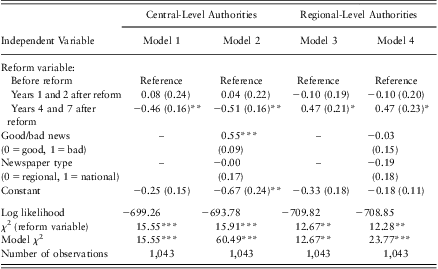
Note: The dependent variables are coded so that 1 = responsibility attributed to central (regional)-level authorities, 0 = no responsibility attributed to central (regional)-level authorities. Table entries are logit coefficients with robust clustered standard errors in parentheses (clustered on newspapers).
***p ⩽ 0.001; **p ⩽ 0.01; *p ⩽ 0.05 for two-tailed tests.
The regression results – both with and without control for newspaper type and tone of coverage – are shown in Table 3. Of most interest, there is a change in responsibility attribution, but the effect seems to be substantially delayed in the sense that the first two post-reform years do not differ significantly from the pre-reform reference category. Then in years 4 and 7 after the reform, the effect turns statistically significant and there is a clear transfer of responsibility attribution from the central state level to the regional level. The introduction of controls does not change these estimated reform effects (see Models 2 and 4). As expected, Table 3 shows a higher average level of responsibility attribution to central state-level authorities in bad news than in good news, but no systematic difference in responsibility attribution between articles from regional and national newspapers.Footnote 11
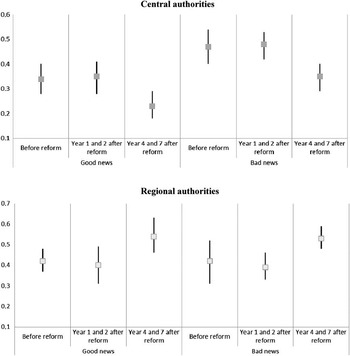
In Figure 1, to gauge the substantive main effects, the estimated probability of the reform scores from Models 2 and 4 in Table 3 is plotted for good and bad news, respectively (assuming average values of the statistically insignificant newspaper variable). Strikingly, while the estimated probabilities across all newspaper articles in years 1 and 2 after the reform are almost identical to the pre-reform years, in the subsequent years after the reform the score for central-level authorities in bad news is down to 0.35 and up to 0.53 for regional-level authorities. Note also in the upper part of Figure 1 how the blame reduction effect in bad news has been followed by a relative loss of credit in the sense that the central-level authorities are attributed less credit in good news after the reform than before the reform.
Probability of responsibility attributions. Note: The figures display estimated probabilities of responsibility attribution assuming average values on all other variables (calculated on the basis of the logit coefficients from Models 2 and 4 in Table 3). □ = mean estimates, ∣ = 95% confidence interval.

On the basis of Table 3 and Figure 1, it appears that the Norwegian central state level of government with this hospital reform actually did manage to centralise ownership and political–democratic authority without attracting more blame in post-reform media coverage of health-care issues. Maintaining a regional buffer (the regional health enterprises), the central state level has increased its influence on health-care regulation and financing without increasing its responsibility in news media coverage of health-care issues. Given the assumption that blame avoidance in general is deemed more important to politicians than credit claiming (cf. Weaver Reference Weaver1986), this is an important political consequence of the reform overlooked by previous evaluations of the rather discouraging economic consequences of the reform. Consistent with the view in the blame avoidance literature on agency strategies (Hood Reference Hood2011, Chapter 4), reorganisation is not a short-term blame avoidance device, but the long-term changes may be substantial as the Norwegian case indicates. In the remaining part of the paper, these results are discussed and explored in more detail.
Discussion
The empirical findings raise two important questions: What alternative explanations may account for the observed empirical pattern? Why did the reform apparently result in increased attribution of responsibility to the regional level?
Alternative explanations
By design, the comparison of pre- and post-reform health-care news in Norway controls for a range of alternative explanations. Firstly, it holds constant the national political system, which in Norway may be characterised as a unitary parliamentary state, but with a substantially higher level of local and regional government autonomy than we usually find in a unitary state (see Hooghe et al. Reference Hooghe, Marks and Schakel2010). Secondly, election studies have shown that the public's general trust in the central government and the local government institutions are rather stable throughout the period from 2001 to 2009 (see Listhaug and Aardal Reference Listhaug and Aardal2011, 298), which reduces the likelihood that changes in responsibility attribution over time are caused by more general shifts in attitudes towards these institutions.
Thirdly, the focus on Norway ensures that the media structure is the same throughout the period of investigation and pre- and post-reform comparability is increased by the fact that the relative extent of negative media coverage has been rather stable over time (see Table 1). A brief look at the leads of the articles also reveals that many of the health-related issues and problems covered by the media after the reform are similar in character to issues reported by the media before the reform, something that may reflect the discouraging conclusions drawn by other scholars with respect to the reform's success in terms of solving the problems it was intended to solve (see Hagen and Kaarbøe Reference Hagen and Kaarbøe2006; Tjerbo and Hagen Reference Tjerbo and Hagen2009). With respect to the present analysis, however, this similarity of types of issues before and after the reform increases the likelihood that changes in responsibility attribution are in fact related to the reform rather than to a shift of the health-care-related issues dominating the political agenda.
In October 2005, the Labour Party (Arbeiderpartiet) took office and Jens Stoltenberg became prime minister. This shift from a minority government to a majority government has been claimed to harden the budget constraints and increase the budgetary discipline within the Norwegian health-care sector (see Tjerbo and Hagen Reference Tjerbo and Hagen2009). The question is whether this also shapes the attribution of blame or credit and, if so, in what direction? Owing to collinearity with the latest post-reform year dummy variable, a government variable is not included in Table 3, but additional investigations do not imply that this change of government is the real explanation behind the estimated reform effects. Firstly, responsibility attribution in 2005 only shows no difference before and after the change of government in October that year. Secondly, a trend towards less central state responsibility attribution is also evident when we look only at the period until the change of government.Footnote 12 Thirdly, it seems more likely that a hardened budget constraint and increased budget discipline would lead to more attribution of blame (or credit) to the national-level government and increased use of blame-shifting rhetoric at the regional level. Note that what we observed over time was less attribution of blame and credit to the central-level authorities. Hence, a more strict and credible national budgeting of health-care expenditures after 2005 does not represent a strong alternative explanation of the relative distribution of public blame and credit identified above.Footnote 13
With observational data, one never achieves full control over assignment to the independent variables; however, in combination, the statistical controls as well as the “most similar systems design” logic characterising the pre- and post-reform comparison in this study nevertheless increase confidence that the observed variation in responsibility attribution is related to the reform. The next question is why the reform matters.
Further explorations of the reform effects
The observation that attribution of responsibility to the central state level has declined provides strong evidence against the dominance of the financial ownership dimension of the hospital reform, but increasing interest in the changes along the political–administrative dimension, especially the creation of the independent health-care enterprises. This is not least interesting because other studies suggest that the central state-level politicians in Norway have not really observed their part of the rationales behind the new regional health enterprises. As argued by Opedal and Rommetvedt (Reference Opedal and Rommetvedt2010, 209), one of the explicit rationales of the hospital reform was that the political–administrative separation should lead to less political intervention, but what they observe by analysing parliamentary activities around health-care issues in the years after the reform is actually increased political intervention by the central state level. As concluded by Opedal and Rommetvedt (Reference Opedal and Rommetvedt2009, 99): “The formal governance model is influenced by NPM, but in practice the model has not influenced the governance style of the Parliament”.
But what about the regional-level decision-makers – how did they respond? We know from other studies that they have not found effective solutions to many of the problems that pushed the hospital reform in the first place (see Hagen and Kaarbøe Reference Hagen and Kaarbøe2006; Tjerbo and Hagen Reference Tjerbo and Hagen2009). However, the shift from directly elected local county politicians to regional board members appointed by the minister of health may actually have changed regional-level decision-makers’ incentives to express opposition to the central state-level government in public.
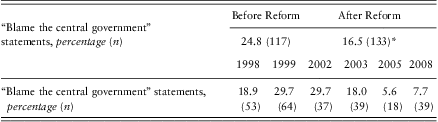
To further investigate this aspect of the reform, all the negative articles were read to identify public statements from regional-level decision-makers. This resulted in a total of 250 relevant public statements – 117 before and 133 after the reform. Inspired by McGraw's (Reference McGraw1990, Reference McGraw1991) seminal work on public blame avoidance accounts, each identified statement was coded as 1 if it represented any kind of blaming the central government excuse; otherwise it was coded 0.Footnote 14
Table 4 indicates that the rhetoric of the regional-level decision-makers has actually changed over time. Before the reform, almost 25 per cent of regional-level decision-makers’ responses to public criticism were variants of “blame the central state government”, compared with slightly above 16 per cent after the reform. Subdividing by year, the total number of coded statements becomes rather low (see lower part of Table 4), but the decreasing use of blame-shifting rhetoric in the years after reform is nevertheless intriguing and almost parallel to the observed change in blame attribution across all negative articles (see Table 3 and Figure 1).Footnote 15 They still blame the central state-level government after the reform, but less than before the reform when regional-level decision-makers were elected county council members and not board members appointed by the minister.
Regional officials’ use of “Vertical diffusion of responsibility” accounts
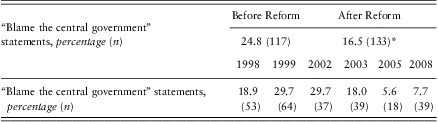
n = total number of coded statements.
*p = 0.053 for a one-tailed difference of proportion test (24.8–16.5).
This result is even more striking, given the responses in post-reform surveys among the leaders of the regional health enterprises. In 2003, 91 per cent, and in 2004, 100 per cent of the regional leaders answered in surveys that the national department of health has a large impact on the priorities of the regional health enterprises; 76 and 80 per cent, respectively, said that the national parliament had a large impact, and only 60 and 56 per cent, respectively, said that the local health enterprises have a large impact (see Opedal and Rommetvedt Reference Opedal and Rommetvedt2009, 125). Thus, instead of politicising and escalating conflicts by blaming the central state-level government, the appointed regional board members tend to stay loyal in their public statements even though they indicate in survey responses that they believe that the central state-level authorities have a large influence on regional health priorities.
As the change in regional-level rhetoric and the change in media attribution of responsibility happen almost simultaneously, we cannot, on the basis of these data, explain one with the other. Nevertheless, these additional explorations of reform effects contribute to our understanding of how the reform works. Furthermore, the substantial delay in observed post-reform changes is intriguing. It may be taken as empirical evidence that institutional reorganisations – so-called agency strategies – are blame-avoidance devices that work in the long run mainly (see Hood Reference Hood2011). The aforementioned laboratory studies of delegation and blame avoidance show that immediate effects of delegation may occur in very simple settings, but also that people struggle with responsibility attribution even when no ambiguity exists (see Coffman 2011; Hamman et al. 2010; Bartling and Fischbacher Reference Bartling and Fischbacher2012). Thus, the delay identified in this paper may, of course, also be a consequence of the size and complexity of this particular hospital reform, which implies that we might observe more immediate effects in a less complex reform with less disparate traits. However, a more thorough investigation of this question would require a comparison of responsibility attribution across a larger number of diverse public sector reforms.
Conclusion
The central empirical finding of the article is that central state-level authorities in Norway were attributed less blame in media coverage of health-care problems after the reform than before the hospital reform. The effect is substantially delayed, but substantial and robust to various modifications in model estimations. This result is particularly noteworthy, given the reform's centralisation of hospital ownership, and in light of other studies that show how national-level politicians continued to intervene in regional health-care priorities, despite the reform's intended separation of management and politics (Opedal and Rommetvedt Reference Opedal and Rommetvedt2009, Reference Opedal and Rommetvedt2010).
Regardless of this well-known phenomenon of partial delegation and “half-hearted managerialism” (Hood Reference Hood2000), the Norwegian hospital reform apparently did deflect blame from national-level authorities down to the regional level of hospital management. The reform did not improve conditions and its rationale of political–administrative separation was not observed by central state-level politicians. However, the reform did change the blame-shifting incentive for regional-level decision-makers. In particular, the analysis suggested that the change from elected regional officials to board members appointed by the minister of health made an important difference. Thereby, this paper not only addresses whether public sector reform may shift responsibility, it also goes a step further and begins to explore how the different aspects of institutional reform matter.
Incumbents’ dissatisfaction with blame games has been recognised as part of the rationales behind administrative reforms including the Norwegian hospital reform (see Hagen and Kaarbøe Reference Hagen and Kaarbøe2006; Tjerbo and Hagen Reference Tjerbo and Hagen2009), but it has often been ignored in empirical studies of reform effects. The question is complex and may involve many other aspects than those included here. For instance, (how) does newspaper assignment of responsibility translate into actions taken within the political system (such as questions to the ministers, public inquiries, resignation of ministers, etc.) and/or into voter sanctions expressed in approval ratings or election results? The latter may be particularly intriguing, given that the Norwegian hospital reform removed voters’ opportunity to express dissatisfaction with regional health decision-makers at regional elections. In other words, by replacing elected regional officials with appointed board members, national-level politicians may have won the blame game over health-care issues in the media's day-to-day coverage, but perhaps at the cost of transferring voter sanctions of health-care problems from local county elections to national elections.
From a comparative perspective, it is intriguing that the Norwegian case shows so much diffusion of blame and credit and so much variation in responsibility attribution over time. When a unitary state like Norway displays wide opportunities for shifting and transferring blame away from the central-level government, this only corroborates that it is worthwhile to open up the political systems and actually study blame and credit attribution within different political systems, instead of relying on simple and broad macro-distinctions between types of political systems (see e.g. Powell and Whitten Reference Powell and Whitten1993). These results furthermore challenge the claims made by Horn (Reference Horn1995, 46) and Bishop (Reference Bishop1990, 499) that legislators in parliamentary systems cannot shift responsibility by delegation. Any reform is, of course, in some aspects unique, but the Norwegian hospital reform mirrors broader NPM-inspired reform ideas that are characteristic of many European public sector reforms from the last few decades (see Hood and Lodge Reference Hood and Lodge2006; Flinders Reference Flinders2008; Hood Reference Hood2011). To be sure, responsibility attribution may be moulded by the broader institutional context or by characteristics specific to the Norwegian health-care sector, but the central findings of this study are probably also of relevance outside the Norwegian health-care domain.
Acknowledgements
This research has received financial support from the national Danish Council for Independent Research, Social Sciences (FSE). The author gratefully acknowledges the comments of Terje P. Hagen, Gunnar Thesen, Jens Blom-Hansen, Jørgen Grønnegaard Christensen, Thomas Pallesen, and the three anonymous reviewers on earlier versions of this article. The author would also like to thank Anne Line Tenney Jordan, Aziza Bjorholm-Petersen and Ann-Sofie Tranæs for excellent research assistance. The usual caveat applies.
Appendix A: Comparing the outcome of different key words searches
The aim of this appendix is to compare sample characteristics when using two different key words searches to identify health-related newspaper articles from the electronic database Retriever. I term the first key words search “narrow” and it contains the Norwegian words (including derivatives and compound words) for either hospital or health service and expenses or budget. This is the key words search used to identify the articles on which the analysis of this paper is based. The other key words search is termed “broad” as it only contains the words for either hospital or health service.
In the first step, I counted the number of newspaper articles returned by each search procedure and compared the number of articles per month, quarter and year to assess whether fluctuations in media attention to health-care-related issues correspond across the two samples. Applying Baumgartner and Jones’ (Reference Baumgartner and Jones2004) measure of agenda correspondence the correlation (Pearson) between the two media indices is: 0.80 (p < 0.0001) when using yearly measures; 0.65 (p < 0.0001) when using quarterly measures; and 0.54 (p < 0.0001) when using monthly measures. As the media data used in the empirical analysis are aggregated to yearly observations, these high correlations clearly indicate that the two samples are rather similar in terms of fluctuations in media attention to health-care-related issues.
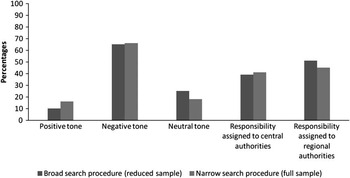
In the second step, 207 extra newspaper articles returned by the “broad” key words search were content coded. The key words search was constrained to the title section of all newspaper articles that have appeared in one of the six newspapers. Furthermore, the search was constrained to cover one month in every one of the six years on which the analyses are based (1998, 1999, 2002, 2003, 2005 and 2008). In Figure A.1, the content coding of this additional sample is compared with the content coding of the full sample used in the analyses of the paper. With regard to the distribution of tone of coverage, the two samples are rather similar. In terms of responsibility attribution, Figure A.1 shows a higher level of responsibility attribution to regional-level authorities than central-level authorities across the two samples. Furthermore, it does seem like the “broad” key words search – as one might expect – returns fewer articles where responsibility is assigned to central-level authorities and more articles where responsibility is assigned to regional-level authorities. The number of observations becomes rather low in the reduced samples, and hence the percentage measures of responsibility attribution more uncertain. However, in case there is a real difference between the two samples, the sample used in this paper may slightly underestimate attribution of responsibility to regional-level authorities compared with a sample generated by the “broader” key words search.
Comparing the coding of different samples of newspaper articles.
Appendix B: Content analysis of newspaper coverage
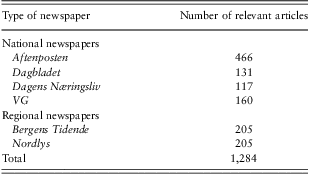
To code the content of the newspaper coverage, a team of two content analysts was assembled who analysed health-care issues coverage in four national Norwegian newspapers and two regional newspapers. The coders were trained over three rounds summing to a pilot sample of ∼150 newspaper articles about health-care issues in Norway. After the third round of coding, intercoder agreement reached an acceptable level of p > 0.90. Next, the coders were instructed to mark an article whenever they had doubts about the correct coding of the item. This resulted in a sum of 258 articles (20 per cent of the full sample) that were subsequently read and coded by the other coder. In 132 of these articles, the two coders reached agreement. The remaining 126 articles were read and coded by the researcher. In 71 of these, the original coding was approved by the researcher, and in the remaining 53 articles the original coding was changed by the researcher (i.e. 4 per cent of the full sample of newspaper articles). Finally, a sample of 250 newspaper articles was coded independently by the researcher and the research assistants to assess the intercoder reliability of the individual variables from the content analysis. As a measure of intercoder reliability, we applied Krippendorff's α. With respect to the rather simple coding of hits into relevant or irrelevant newspaper articles, Krippendorff's α was estimated to 0.99. With respect to the tone of the article (good, bad, neutral) the score was 0.83, and with respect to assignment of blame or credit in the articles coded either bad or good we obtained a score of 0.89. All scores clearly satisfy the level of acceptable reliability, which for the rather conservative Krippendorff α index normally is set to 0.70 or higher (see Lombard et al. Reference Lombard, Snyder-Duch and Bracken2002). The list of newspapers coded is shown in Table B.1.
List of newspapers coded