Implications
In the European Union, a ban on the castration of male piglets is foreseen from 2018 onwards. Non-castrated male pigs can develop a strong off-odour called boar taint, which renders the meat unfavourable for sensitive consumers. Pig producers who stop with castration must deal with this problem. This study identifies potential farm and management characteristics that can help solve this problem.
Introduction
In most countries in the European union (EU), castration of the male piglets is common practice (Fredriksen et al., Reference Fredriksen, Font i Furnols, Lundström, Migdal, Prunier, Tuyttens and Bonneau2009). However, animal welfare is increasingly important for European consumers. To improve animal welfare, in 2009, the Dutch pig sector agreed with the Declaration of Noordwijk to ban castration of male piglets from 2015 onwards. On EU level, the European Declaration on alternatives to surgical castration of male pigs of June 2010 proposes a ban on castration from 2018 onwards (European Commission, 2010). Boars, however, can develop an off-flavour, called boar taint, rendering the meat less suitable for human consumption (Lundström et al., Reference Lundström, Matthews and Haugen2009). Since 2007, Dutch pig producers started raising boars instead of castrates on a large scale (Bikker et al., Reference Bikker, Beldman and Van den Berkmortel2010). The main reasons are that they do not need to perform the unpleasant task of castration anymore and that boars have a lower feed conversion rate and higher growth rate than castrates. In 2012, about half of the male pigs raised in the Netherlands were not castrated anymore. However, this development increases the risk of meat with boar taint reaching consumers. To prevent boar taint-related complaints from customers and consumers, pig slaughter companies in the Netherlands have implemented boar taint detection systems, which are based on sensory evaluation with the human nose at the slaughter line (Mathur et al., Reference Mathur, Ten Napel, Bloemhof, Heres, Knol and Mulder2012). The test results of a major Dutch slaughter company have shown that, when using the human nose detection, the prevalence of boar carcasses with boar taint is on average 3% to 4% (Van Wagenberg et al., Reference Van Wagenberg, van der Fels, van der Peet-Schwering, Snoek and Heres2011). However, it varies across individual farms from 0% to 8% (Van Wagenberg et al., Reference Van Wagenberg, van der Fels, van der Peet-Schwering, Snoek and Heres2011). This variability in farm-level boar taint prevalence suggests that farm and management characteristics might influence farm-level boar taint prevalence.
Until now, studies aiming to identify causes for boar taint could only use relatively small numbers of boars. Owing to the shift towards the production of entire male pigs, and the development of the boar taint detection method with the human nose (Mathur et al., Reference Mathur, Ten Napel, Bloemhof, Heres, Knol and Mulder2012), large numbers of boar taint data at farm-level became available. Such large numbers enable the identification of farm and management characteristics potentially associated with farm-level boar taint prevalence in practice. The aim of this study was to identify such farm and management characteristics.
The literature provides evidence for farm and management characteristics potentially associated with boar taint. Housing conditions such as pen surface per animal (Hansen et al., Reference Hansen, Larsen, Jensen, Hansen-Møller and Bardon-Gade1994; Hansen et al., Reference Hansen, Larsen and Hansen-Møller1995) and floor type (Kjeldsen, Reference Kjeldsen1993; Allen et al., Reference Allen, Joseph and Lynch2001) were associated with higher skatole levels in pigs. Hansen et al. (Reference Hansen, Larsen, Jensen, Hansen-Møller and Bardon-Gade1994) showed that insufficient cleanness of pens could result in higher skatole levels, and thus hygiene circumstances in the pens and the cleaning strategy could influence boar taint prevalence. Feeding-related characteristics, such as the type of feed, feeding strategy and used feed ingredients (Kjeldsen, Reference Kjeldsen1993; Andersson et al., Reference Andersson, Schaub, Andersson, Lundstrijm, Thomke and Hansson1997; Zamaratskaia et al., Reference Zamaratskaia, Babol, Andersson, Andersson and Lundström2005a), the protein level of the feed (Allen et al., Reference Allen, Joseph and Lynch2001) and the fasting period before slaughter (Kjeldsen, Reference Kjeldsen1993) have been shown to influence boar taint levels in pigs. Stocking strategies, such as grouping piglets, based on sex can influence boar taint development (Kjeldsen, Reference Kjeldsen1993; Allen et al., Reference Allen, Joseph and Lynch2001). The development of boar taint is age related (Bonneau, Reference Bonneau1982). Because a boar's age at slaughter was not known, measures of growth such as the length of the growing period and the growth rate/day were used. Several studies indicate an influence of the genetic background on the development of boar taint (Robic et al., Reference Robic, Larzul and Bonneau2008; Aluwé et al., Reference Aluwé, Millet, Bekaert, Tuyttens, Vanhaecke, De Smet and De Brabander2011; Windig et al., Reference Windig, Mulder, ten Napel, Knol, Mathur and Crump2012). We therefore included the boars’ sow line and terminal boar line into the characteristics. Giersing et al. (Reference Giersing, Lundström and Andersson2000) showed that the aggressive behaviour of boars is related to androstenone levels in pigs, although Zamaratskaia et al. (Reference Zamaratskaia, Rydhmer, Chen, Madej, Andersson and Lundström2005b) did not find such a relationship. Although the literature is not conclusive, it is interesting to analyse whether factors increasing aggressive behaviour are associated with boar taint prevalence. The use of straw (Hunter et al., Reference Hunter, Jones, Guise, Penny and Hoste2001), the number of pigs in a pen (EFSA, 2007), the number of hours of light (Simonsen, Reference Simonsen1990), the feeder type (Hunter et al., Reference Hunter, Jones, Guise, Penny and Hoste2001) and the mixing of unacquainted pigs (EFSA, 2005 and 2007) have been shown to influence the aggressive behaviour of pigs. These farm and management characteristics potentially associated with boar taint were asked in a questionnaire to Dutch boar producers and associated with farm-level boar taint prevalence measured at the slaughter line.
Material and methods
Questionnaire and respondents
A questionnaire was developed with questions about the farm and management characteristics potentially associated with boar taint. The questionnaire was sent to 152 pig producers in the Netherlands. Each of these producers had delivered a minimum of 100 boars in at least two consignments to the slaughter company in the months before the survey (from October 2009 to June 2010). Of the pig producers, 101 producers responded via regular mail. The questionnaire results were combined with boar taint data using the Dutch unique production location number (UBN, Uniek BedrijfsNummer). Of the 101 producers, 11 producers provided more than one UBN. Results of these producers were excluded from the analysis, because responses of the questionnaire could not be linked to one of the multiple UBNs provided. As a consequence, results from 90 producers were analysed (response rate of 59%). Because 100 delivered boars is a low number of boars to reliably calculate farm-level boar taint prevalence, a separate analysis was performed on the results from the 71 pig producers who delivered 300 or more boars in the months before the survey.
The questionnaire was sent by mail service on 15 December 2010. It was accompanied by an introduction letter that clarified the research aim of identifying possible farm and management characteristics, which could be associated with farm-level boar taint prevalence.
Data on farm-level boar taint prevalence
A large pig slaughter company in the Netherlands provided the farm-level boar taint prevalence data from July 2010 to June 2011. Boar taint was measured with an in-line human nose scoring system. Each boar carcass was assessed at the slaughter line by one employee of the slaughter company. Each assessor was tested to be sensitive for androstenone and skatole odour and received several weeks of training in a laboratory setting and at the slaughter line before being assigned as the assessor for detection of boar taint at the slaughter line. At the slaughter line, a metal plate heated with a gas burner was pressed against the neck fat of a boar. The assessor smelled the released odour and assessed it with a score from 0 (no deviation in smell) to 4 (strong boar taint). No distinction is made between specific compounds of boar taint, such as androstenone and skatole. The scoring system is described in a study by Mathur et al. (Reference Mathur, Ten Napel, Bloemhof, Heres, Knol and Mulder2012). Carcasses rated with a score of 3 or 4 were considered to have a high probability of boar taint. The number of assessed boars of the 90 producers ranged from 104 to 6090, with an average of 1061.
Statistical analysis
Dependent and independent variables
The dependent variable in the analysis was the logistic transformation of farm-level boar taint prevalence. Independent variables in the analysis were farm and management characteristics potentially associated with farm-level boar taint prevalence. Related variables were grouped in the following subsets: housing conditions, lighting strategy, hygiene, feeding strategy, stocking and marketing strategy, genetics and growth rate. Variables were measured using categorical, ordinal, ratio and Likert scales.
Multicollinearity between independent variables
To prevent multicollinearity, a correction was done for highly correlated variables. Pearson correlations between the variable number of fouled pens, frequency of pen fouling and degree of pen fouling ranged from 0.644 to 0.870 (all p<0.01). Therefore, in the analysis, the simple mean of these three variables for pen fouling was used. Dry feed was always presented to the pigs in a single-spaced dry feeder (sequential feeding), whereas wet feed was presented to the pigs in a long trough (simultaneous feeding) on 21 of the 23 farms that supplied wet feed to the pigs. Therefore, we only included the variable feed type and excluded the variable feeder type from the analysis.
Treatment of variables
Categorical and ordinal variables with two response options were recoded to dummies. Categorical and ordinal variables with three response options were recoded using effect coding (coding −1, 0 and 1). Effect coding requires a reference group with the remaining categories designated as vectors. With effect coding, the intercept is equal to the grand mean and the slope expresses the difference between a group and the grand mean. This has the advantage that results do not depend on the arbitrary choice of the reference group (Pedhazur, Reference Pedhazur1977).
Strategy of analyses
Several research tools and methods exist to perform an exploratory analysis with a large number of independent variables. Any analysis involves balancing the purpose of the model, consistency with prior knowledge and statistical adequacy (Pesaran and Smith, Reference Pesaran and Smith1998). One can analyse from generic to specific, starting with all variables in a multivariate model and reducing this to a selection of variables, or from specific to generic, testing independent variables one by one and combining the significant ones in a multivariate model. The first strategy has the disadvantage of loss of overview, higher risk of false positive results and it is less recommended for small samples. The second has the disadvantage that univariate analyses do not include associations between the variables, unlike in multivariate methods that account for correlation between the error terms (Juselius, Reference Juselius1992 and Reference Juselius2006). Because the variables in the subsets are related and the sample is small, we used an in-between strategy with a two-stage approach. In stage 1, a separate linear multivariate regression with forward selection on farm-level boar taint prevalence was performed for each subset of related variables. The criterion of a variable for inclusion was a probability-of-F-to-enter of <0.10. In stage 2, the results from stage 1, that is, the variables included in the final linear model of each subset, were combined and entered together as independent variables into a linear multivariate regression model. In this last model, characteristics with P < 0.10 were significant. The number of delivered boars per farm was used as a weighing variable in both stages. Statistical analyses were performed in IBM SPSS Statistics version 19.
Results
Distribution of boar taint prevalence
The percentage of boars with a high probability of boar taint varied between producers from 0.63% to 6.79%, with a mean of 3.2% and a standard deviation of 1.2% (Figure 1).
Distribution of farm-level boar taint prevalence on the basis of boar taint prevalence data from July 2010 to June 2011 of 90 Dutch pig producers who responded to a questionnaire about farm and management characteristics related to boar taint.

General characteristics of the respondents
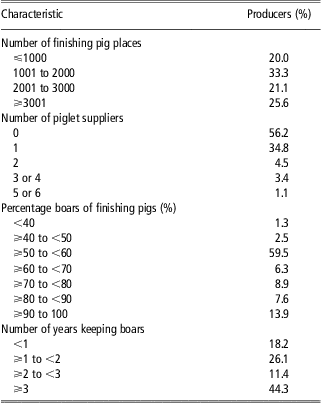
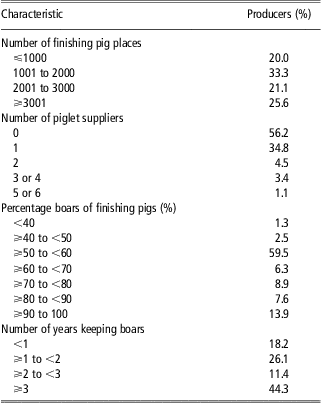
Table 1 shows general characteristics of the 90 pig producers who participated in the questionnaire. Of these producers, 20.0% had less than 1000 finishing pig places and 25.6% had more than 3000. The farm size of the respondents is larger than the average finishing pig farm size in the Netherlands, with around 67% of farms having less than 1000 finishing pig places and around 15% more than 2000 in 2011 (Wijsman, Reference Wijsman2012). More than half of the farms produced their own piglets and about a third had one piglet supplier. Almost 60% of the respondents had 50% boars and almost 14% had only boars. Less than 20% has kept boars for less than a year, whereas more than half of the pig producers had kept boars for 2 years or more.
General characteristics of 90 Dutch pig producers participating in a questionnaire on farm and management characteristics related to farm-level boar taint prevalence
Descriptive analysis of the questionnaire responses
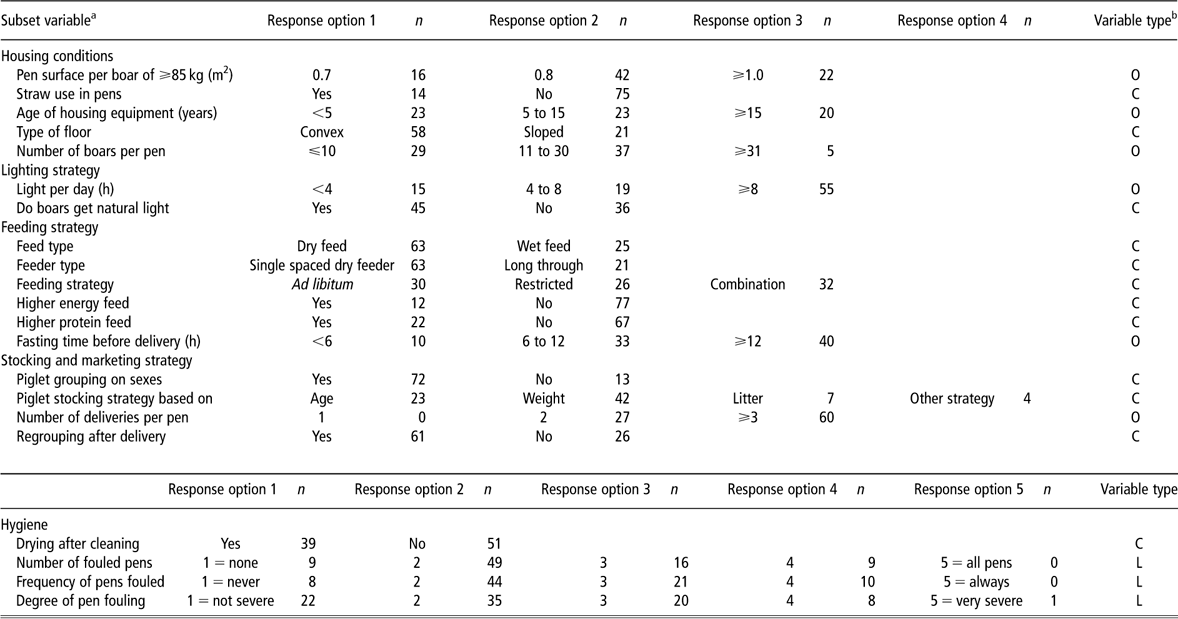
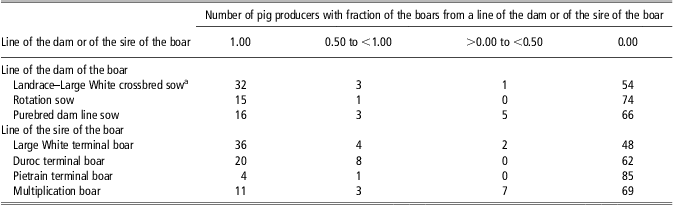
Tables 2, 3 and 4 provide the descriptive analysis of the responses on farm and management characteristics of the 90 pig producers who responded in the questionnaire. Table 2 shows the frequency distribution of the categorical, ordinal and Likert-scale variables. For most categorical and ordinal variables each response option has a frequency of 15 or more. The Likert-scale variables also show variation between the pig producers. Table 3 shows the ratio variables for the subsets stocking and marketing strategy and growth, and Table 4 shows the ratio variables for the subset genetics. All ratio variables show variation between pig producers.
Frequency (n) per response option of the categorical, ordinal and Likert-scale variables per subset asked in a questionnaire about farm and management characteristics related to farm-level boar taint prevalence from the 90 Dutch pig producers who responded
aFor each variable, the remainder of the 90 respondents left the response blank.
bVariable type: C = categorical, O = ordinal and L = Likert scale.
Number of pig producers (n) and minimum, maximum, mean and standard deviation of ratio variables asked in a questionnaire about farm and management characteristics related to farm-level boar taint prevalence from the 90 Dutch pig producers who responded

Number of pig producers with fraction of boars from each line of the dam of the boar and line of the sire of the boar asked in a questionnaire about farm and management characteristics related to farm-level boar taint prevalence from the 90 Dutch pig producers who responded
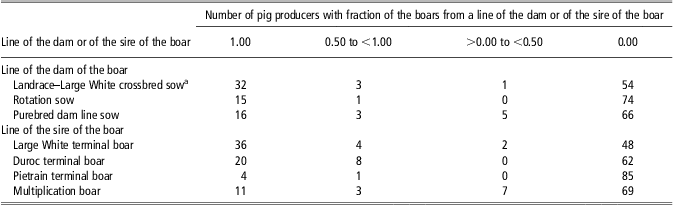
aFrom multiple breeding companies.
Farm and management characteristics related to farm-level boar taint prevalence
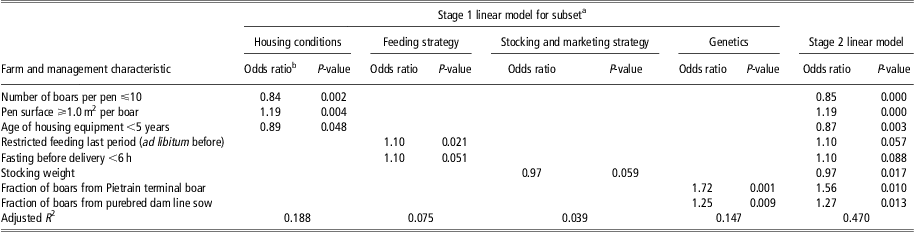
Table 5 provides the odds ratios of the farm and management characteristics that entered the regression model for farm-level boar taint prevalence in stage 1 of the analysis. Characteristics entered from the subsets housing conditions, feeding strategy, stocking and marketing strategy and genetics. The adjusted R 2 of the models varied from 0.039 to 0.188. Table 5 also provides the odds ratios of the farm and management characteristics in the multivariate model in stage 2, which combines all the significant characteristics of stage 1. Farm-level boar taint prevalence was lower (P < 0.10) for producers who had 10 boars or less per pen, a pen surface per boar of less than 1.0 m2, housing equipment younger than 5 years, not fed the boars restrictedly in the last period before delivery, a fasting period of more than 6 h before delivery, a higher stocking weight and a lower fraction of the boars from Pietrain terminal boars or from purebred dam line sows. The adjusted R 2 of the model was 0.470.
Results of the stage 1 linear model per subset and stage 2 linear model with farm and management characteristics as reported by Dutch pig producers participating in a survey related to farm-level boar taint prevalence as measured with the human nose in a Dutch slaughterhouse that delivered 100 or more boars in the period before the survey
aFor the other subsets that are not in this table, no characteristics entered the linear regression in stage 1.
bOdds ratio = eregression coefficient.
The results of the analyses for the 71 pig producers who delivered at least 300 boars in the period before the survey were slightly different (Table 6). In stage 1, no variables were selected from the subset housing conditions. The other variables were the same as in the analyses with at least 100 boars delivered. The results of the stage 2 model showed that odds ratios were similar, only stocking weight was not significantly associated anymore. The adjusted R 2 was 0.284.
Results of the stage 2 linear multivariate model in stage 2 with farm and management characteristics as reported by Dutch pig producers participating in a survey related to farm-level boar taint prevalence as measured with the human nose in a Dutch slaughterhouse that delivered 300 or more boars in the period before the survey
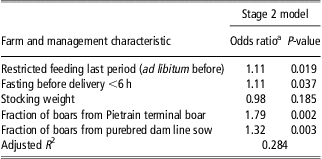
aOdds ratio = eregression coefficient.
Discussion
This is the first published study showing the distribution of on-farm-level prevalence of boar taint as assessed by in-line sensory detection. This study identified several farm and management characteristics that are associated with farm-level boar taint prevalence of 90 pig producers who responded to a questionnaire about these characteristics. With a response rate of 59%, respondents can be considered representative for the group of pig producers who delivered more than 100 boars in at least two consignments from October 2009 to June 2010. Because only 152 finishing pig producers out of around 5500 for the Netherlands received the questionnaire, the results are not directly generalizable to all finishing pig producers. Large sample sizes with more pig producers and with more delivered boars, also in countries other than the Netherlands, are needed to improve generalizability. Another limitation is that in this questionnaire the pig producers themselves reported the farm and management characteristics. Self-reporting can be associated with problems of validity and social desirability (Stone et al., Reference Stone, Turkkan, Bachrach, Jobe, Kurtzman and Cain2000). Using independent observers can overcome these problems in future research. Because of these limitations, the results of this study should be considered as indicative. They provide a starting point for further research to establish causal relationships between farm and management characteristics and farm-level boar taint.
Some farm and management characteristics, which the literature suggested to have a potential effect on boar taint, were not significantly associated with farm-level boar taint prevalence in this study. This does not mean that no causal relationship exists; only that for the 90 pig producers who responded to the questionnaire no association with farm-level boar taint prevalence could be identified. This could be because of the relatively low number of respondents, the low variation in these farm and management characteristics between the respondents, the relatively low number of boars delivered or the self-reporting bias.
In this study, a lower number of boars per pen (⩽10) were associated with lower boar taint prevalence. A possible explanation is via the effect on aggressive behaviour. EFSA (2007) reviewed some studies that suggest that a lower number of pigs per pen decreased the aggressive behaviour of pigs. Giersing et al. (Reference Giersing, Lundström and Andersson2000) indicated that more aggressive behaviour can result in higher boar taint prevalence.
In this study, a pen surface of ⩾1.0 m2/animal compared with 0.7 and 0.8 m2 was associated with higher farm-level boar taint prevalence. This is in contrast with Hansen et al. (Reference Hansen, Larsen, Jensen, Hansen-Møller and Bardon-Gade1994) and Hansen et al. (Reference Hansen, Larsen and Hansen-Møller1995), who concluded that 0.8 and 1.2 m2 pen surface per boar lowered skatole and indole levels in subcutaneous fat compared with 0.6 m2/boar. In this project, we measured boar taint with trained assessors sensitive to androstenone and skatole. Hansen et al. (Reference Hansen, Larsen, Jensen, Hansen-Møller and Bardon-Gade1994) and Hansen et al. (Reference Hansen, Larsen and Hansen-Møller1995) did not measure androstenone or other possible compounds of boar taint. It could be that pen surface per pig also influences levels of androstenone and other possible compounds, resulting in more boar taint. Further research is needed to identify the relationship between pen surface per pig and boar taint. A smaller pen surface per boar is, however, in disfavour of animal welfare. If a negative causal relationship between boar taint and pen surface per boar exists, in defining an intervention strategy to control boar taint, the gains in terms of lower boar taint levels should be weighed against the costs of lower animal welfare. Such an intervention strategy might also conflict with EU welfare legislation about minimal pen surface per pig, making this a less likely strategy to lower farm-level boar taint prevalence.
In this study, housing equipment of <5 years was associated with lower farm-level boar taint prevalence. Newer housing equipment is generally easier to clean than older housing equipment. Hansen et al. (Reference Hansen, Larsen, Jensen, Hansen-Møller and Bardon-Gade1994) showed that insufficient cleanness of pens resulted in higher skatole levels in subcutaneous fat, which could result in higher boar taint prevalence. In this study, we asked for the perception of the pig producer about the hygienic circumstances in the pens. This was not associated with farm-level boar taint prevalence. This might be because of the self-reporting of the pig producers and the differences in interpretation. Using independent observers can overcome these problems in future research.
In this study, a combination feeding strategy of ad libitum feeding with restricted feeding at the end of the fattening period was associated with higher farm-level boar taint prevalence compared with ad libitum or restricted feeding during the whole growing period. Kjeldsen (Reference Kjeldsen1993) could not find an effect of restricted feeding on boar taint compared with ad libitum feeding, but did not analyse a combination strategy. A possible explanation is that restricted feeding at the end of the growing period results in increased aggressive behaviour of boars. Restricted feeding has been shown to increase the aggressive behaviour of pigs (Vargas et al., Reference Vargas, Craig and Hines1987), which in its turn could result in higher boar taint prevalence (Giersing et al., Reference Giersing, Lundström and Andersson2000). Further research is needed to identify the relationship between feeding strategy and boar taint.
In this study, we found that less than 6 h fasting before delivery compared with fasting of more hours was associated with higher farm-level boar taint prevalence compared with longer fasting times. No difference in farm-level boar taint prevalence was identified between fasting at 6 to 12 h and fasting more than 12 h. Kjeldsen (Reference Kjeldsen1993) concluded that fasting for 12 h before delivery reduced skatole levels compared with no fasting. Kjeldsen (Reference Kjeldsen1993) did not analyse other fasting periods. These results suggest that a minimum amount of fasting time is needed before boar taint levels are reduced. Further research is needed to identify the exact relationship between fasting period before slaughter and boar taint.
In this study, a higher stocking weight was associated with lower farm-level boar taint prevalence. Most pig producers in the questionnaire use a stocking strategy on the basis of age or weight, which involves mixing of unacquainted boars. This mixing can result in more aggressive behaviour (EFSA, 2005 and 2007) and consequently in more boar taint (Giersing et al., Reference Giersing, Lundström and Andersson2000). A possible explanation is that at a higher stocking weight piglets can manage mixing with unacquainted pigs better than at a lower stocking weight, resulting in less aggressive behaviour. Another possible explanation is that piglets with a higher stocking weight might grow faster and are therefore younger when reaching a commercial slaughter weight. Further research is needed to identify the relationship between stocking weight and boar taint.
In this study, the fattening boars from pig producers who use terminal boars of the Pietrain breed had a higher level of boar taint. This does not match with the study of Aluwé et al. (Reference Aluwé, Millet, Bekaert, Tuyttens, Vanhaecke, De Smet and De Brabander2011), who stated that Pietrain pigs are less likely to produce boar taint. However, Aluwé et al. (Reference Aluwé, Millet, Bekaert, Tuyttens, Vanhaecke, De Smet and De Brabander2011) used purebred Pietrain boars, whereas in our study we measured boar taint in crossbred progeny of Pietrain terminal boars. In line with Aluwé et al. (Reference Aluwé, Millet, Bekaert, Tuyttens, Vanhaecke, De Smet and De Brabander2011), Windig et al. (Reference Windig, Mulder, ten Napel, Knol, Mathur and Crump2012) showed that purebred Pietrain boars have a low androstenone compared with other sire lines and similar skatole levels, whereas crossbreds with a Pietrain sire have higher levels of skatole than crossbreds with a sire of another sire line and similar androstenone levels. This indicates that Pietrain crossbreds are likely to have more boar taint than other crossbred finisher pigs, which is also found in this study. In this study, a dam of the boar of a purebred dam line is associated with higher boar taint prevalence. The progeny of such purebred dams is likely to be a by-product of multiplication and a crossbred of dam lines only. Windig et al. (Reference Windig, Mulder, ten Napel, Knol, Mathur and Crump2012) also showed that purebred dam lines have on average higher levels of androstenone and skatole compared with sire lines and crossbreds. Producers with a dam of the boar of a purebred dam line often indicated to also have a multiplication boar as sire of the boar (Pearson correlation of 0.685, P = 0.000). In step 1 of the analysis, for genetics without the purebred dam line, the multiplication boar as sire of the boar is associated with higher farm-level boar taint prevalence instead. Results in step 2 of the analysis are similar to those of Table 5, although the fraction of boars from multiplication boars, feeding the boars restrictedly in the last period before delivery and a fasting period of more than 6 h before delivery were not significantly associated with farm level boar taint prevalence anymore. Further research is needed to identify the causal relationships between the dam and sire lines of the boars and farm-level boar taint prevalence.
Conclusion
Farm-level boar taint prevalence was associated with the number of boars per pen, pen surface per boar, the age of the housing equipment, the feeding strategy, the fasting period before slaughter, stocking weight, boars from purebred dam line sows and crossbred finisher pigs with a Pietrain sire. These results can be used to develop farm-level intervention strategies to control boar taint. More research effort is needed to establish causal relationships.
Acknowledgements
The authors would like to acknowledge the financial contributions of the Dutch Product Board for Meat and Eggs and the Dutch Ministry of Economic Affairs for this research.