INTRODUCTION
Anthropogenic methane is an important atmospheric greenhouse gas (GHG) emitted from the agricultural sector which is responsible for about half of global methane emissions (Cole et al. Reference Cole, Duxbury, Freney, Heinemeyer, Minami, Mosier, Paustian, Rosenberg, Sampson, Sauerbeck and Zhao1997; IPCC Reference Mets, Davidson, Bosch, Dave and Meyer2007). Under the United Nations Framework Convention on Climate Change (UNFCCC), Annex I countries (developed countries and countries with economies in transition) are required to provide reliable estimates of all GHG emissions and the uncertainties associated with those estimates (IPCC Reference Eggleston, Buendia, Miwa, Ngara and Tanabe2006). To provide guidance to mitigation policy there is also increased interest in reporting the emission intensity of agricultural products. The uncertainty of these estimates provides a measure of the quality of the quantification process that is used and as a consequence, its reliability in guiding policy.
In 2008, about 8% of Canada's total GHG emissions were estimated to be produced by the agricultural sector; methane emissions from livestock, including enteric fermentation by ruminants and storage of manure, accounted for 42% of these emissions (Environment Canada 2010). Fundamentally, uncertainties are associated with the variables used in the calculation of the emission factors (EFs) and in the estimates of activity data (e.g. animal population). It is possible to estimate the uncertainty in model outputs by including a stochastic measure of uncertainty in the variables used for the calculation of emissions. Monte Carlo Simulation (MCS) is a robust and commonly used stochastic, probability-based technique for estimating uncertainty.
Although the methane emissions from livestock have been estimated by many researchers in Canada (e.g. McGinn et al. Reference McGinn, Beauchemin, Coates and Colombatto2004; Ominski et al. Reference Ominski, Boadi, Wittenberg, Fulawka and Basarab2007; Vergé et al. Reference Vergé, Dyer, Desjardins and Worth2007, Reference Vergé, Dyer, Desjardins and Worth2008, Reference Vergé, Dyer, Desjardins and Worth2009a , Reference Vergé, Dyer, Desjardins and Worth b ; van Haarlem et al. Reference van Haarlem, Desjardins, Gao, Flesch and Li2008), there has been no published study to determine the uncertainty in the national agricultural methane inventories. Rypdal & Winiwarter (Reference Rypdal and Winiwarter2001) reported that the uncertainty of enteric methane emission estimates for various European countries ranged from 40% of the mean for the UK to 100% of the mean in Austria. Uncertainty values of 70% for both methane and nitrous oxide emissions in the Netherlands were reported by Van der Laan et al. (Reference Van der Laan, Neubert and Meijer2009). Uncertainty in EFs from different cattle categories in Finland varied from 51 to 68% (Monni et al. Reference Monni, Perala and Regina2007).
Recently, research has focused on the quantification of the emission intensity of products (Vergé et al. Reference Vergé, Dyer, Desjardins and Worth2007, Reference Vergé, Dyer, Desjardins and Worth2008, Reference Vergé, Dyer, Desjardins and Worth2009a , Reference Vergé, Dyer, Desjardins and Worth b ; Dyer et al. Reference Dyer, Vergé, Desjardins and Worth2010). Stewart et al. (Reference Stewart, Little, Ominski, Wittenberg and Janzen2009) compared whole farm GHG emission per unit of protein output for various management scenarios at four locations on the Canadian prairies and showed that the largest decrease in GHG emissions for all sites, as compared with a baseline scenario, was obtained when cattle were maintained on alfalfa-grass pastures. Their study suggests that the management practice that resulted in the largest increase in emissions, as compared with the baseline scenario, varied from site to site (Stewart et al. Reference Stewart, Little, Ominski, Wittenberg and Janzen2009). However, studies such as this lack uncertainty estimates that may provide measures of certainty around the study conclusions.
The objective of the current study was to calculate the uncertainties associated with methane emissions and emission intensities from Canadian livestock for the year 2008 using MCS. A sensitivity analysis was used to investigate and understand the importance of correlations in model parameter uncertainty as it pertains to the level of detail, or the scale at which the parameters used in MCS were collected. Detailed analysis of the model parameters and their role in uncertainty provides guidance for future research efforts to improve GHG emission estimates.
MATERIALS AND METHODS
To make the results comparable with those of the parties of the UNFCCC, for the emission estimate and uncertainty assessment, methodologies from the Intergovernmental Panel on Climate Change (IPCC) presented in the Good Practice Guidance and Uncertainty Management in National Greenhouse Gas Inventories (IPCC Reference Penman, Kruger and Galbally2000b ) were followed, with the exception that certain parameters and calculation methods were taken from the 2006 guidelines (IPCC Reference Eggleston, Buendia, Miwa, Ngara and Tanabe2006). Methane emissions were converted to carbon dioxide equivalents (CO2e) using a global warming potential (GWP) of 21 (IPCC 1997). The complete methodology of methane emissions from Canadian agroecosystems was presented in Vergé et al. (Reference Vergé, Dyer, Desjardins and Worth2007, Reference Vergé, Dyer, Desjardins and Worth2008, Reference Vergé, Dyer, Desjardins and Worth2009a ). All the calculations were performed at the provincial level for both enteric fermentation and manure emissions, with the exception of aggregating four of the Atlantic Provinces (resulting in seven regions) and then summed to a national total.
Enteric fermentation emission calculation
The enteric fermentation EFs for dairy and non-dairy cattle were calculated using the IPCC Tier 2 methodology (IPCC Reference Penman, Kruger and Galbally2000b , Reference Eggleston, Buendia, Miwa, Ngara and Tanabe2006) adapted to Canadian conditions by Vergé et al. (Reference Vergé, Dyer, Desjardins and Worth2007) and the Tier 1 methodology (IPCC 1997) was used for all other animal categories. More details on the methodology can be found in the Canadian National Inventory submission to UNFCCC (Environment Canada 2010). Emissions factors are calculated as a function of gross energy intake (GEI):

where Y m is the methane conversion rate and the factor 55·65 (MJ/kg CH4) is the energy content of methane. For different cattle categories, GEI were calculated based on the IPCC methodology using animal weight (mature, ‘current’ – for non-mature animals – and weight gain); milk (production and fat percentage), the percentage of females that give birth, the feed digestibility or digestible energy (DE) as percentage of GEI and other activity data (depending on the feeding situation, e.g. pasture and feedlot). Animal weights, DE and the percentage of females that give birth were derived from Boadi et al. (Reference Boadi, Ominsky, Fulawka and Wittenberg2004); milk production and the fat content were obtained from Agriculture and Agri-Food Canada (AAFC 2011) and Y m for dairy and non-dairy cattle were default values from IPCC (Reference Eggleston, Buendia, Miwa, Ngara and Tanabe2006). For some parameters, the calculation method differs from the methodology used in the Canadian inventory. The default values supplied in the IPCC (Reference Eggleston, Buendia, Miwa, Ngara and Tanabe2006) guidelines for Y m, coefficient for calculating net energy for maintenance (Cf i ) and coefficient for calculating net energy of activity (C a) are used in the calculation of EFs, net energy of maintenance and net energy of activity, not the default values of the 1997 guidelines as are currently used in the Canadian inventory submitted to the UNFCCC. Animal population data were obtained from surveys done by Statistics Canada (2008, 2009a , b , c ).
Manure management methane emission calculations
Manure management EFs were calculated based on the IPCC Tier 2 methodology using:

where B o is the maximum methane producing capacity (m3 CH4/kg of volatile solid (VS)), MCF is the methane conversion factor, MS is the proportion of manure handled by specific manure management systems and 0·67 is the conversion factor of m3 methane to kilograms methane. The B o data are IPCC default values (IPCC Reference Eggleston, Buendia, Miwa, Ngara and Tanabe2006), and MS values are those reported by Marinier et al. (Reference Marinier, Clark and Wagner-Riddle2004b ). The MCF for liquid manure storage was calculated at a monthly time-step using the United States Environmental Protection Agency (US EPA) methodology (Mangino et al. Reference Mangino, Bartram and Brazy2001) modified for Canadian conditions (Vergé et al. Reference Vergé, Dyer, Desjardins and Worth2007). This approach also differs from the national inventory of Environment Canada, which does not use the EPA methodology, but instead uses IPCC 2006 default values for liquid systems. For all other manure storage systems, the IPCC (Reference Eggleston, Buendia, Miwa, Ngara and Tanabe2006) guideline default MCF values were used. The VS (kg/head/day) are estimated based on the digestible fraction of dry matter intake (DMI) using:

where DE is the digestible energy and ASH is the mineral fraction (also known as ash content) of manure. For all cattle GEI was calculated based on typical provincial feeding and production practices obtained from Boadi et al. (Reference Boadi, Ominsky, Fulawka and Wittenberg2004). For other animal categories, GEI was derived from DMI and DE values that were obtained from Marinier et al. (Reference Marinier, Clark and Wagner-Riddle2004a ), also collected from expert opinion at the provincial scale.
Emission intensities
Emission intensities are based on the ratio of methane emissions from each livestock category (i.e. beef cattle, swine and lamb) and the live market weight at the farm gate (kg CO2e/kg live-weight (LW)) of the same animal category intended for either slaughter or export (Vergé et al. Reference Vergé, Dyer, Desjardins and Worth2008). The methane emission estimates are based on the annual emissions estimated for slaughtered and non-slaughtered animals in each livestock category (i.e. non-dairy cattle, swine and lamb). For each animal category (ac), the total LW either slaughtered or exported was estimated based on total animal population (H ac) and average carcass weight (CW) (Statistics Canada 2009a , b , c ):

where α is the factor for conversion of CW to LW, which is c. 0·60 for cattle (Aker & Smith Reference Aker and Smith2005; Vergé et al. Reference Vergé, Dyer, Desjardins and Worth2008), 0·806 for swine (Rivest et al. Reference Rivest, Correa, Bouchard, Faucitano, Fortin, Levallois, Laforest and Gariépy2004; Vergé et al. Reference Vergé, Dyer, Desjardins and Worth2009a , Reference Vergé, Dyer, Desjardins and Worth b ) and 0·485 for lamb (Stanford et al. Reference Stanford, Clark and Jones1995).
Parameters used in the uncertainty analysis
There is little data on the probability distributions of the parameters used in the IPCC models. Most parameters are provided with a potential range, which is often estimated by expert opinions, or ranges that are drawn from a few studies, often using methodologies that are not easily comparable. Large uncertainties associated with EFs are due to a lack of appropriate measurements and subsequent generalizations, uncertainties in measurements, and an inadequate understanding of emission processes (Rypdal & Winiwarter Reference Rypdal and Winiwarter2001). Uncertainty in activity data is generally related to a lack of analysis on the statistical survey conducted to obtain activity data.
MCS is a stochastic method that treats input parameters as random variables (each with a given probability distribution function (PDF)) and generates multiple results using randomly selected input values. MCS can handle PDFs of different shapes and widths as suggested by IPCC for Tier 2 methodology (IPCC Reference Penman, Kruger and Galbally2000a ). Each input variable possesses a unique PDF whose shape, kurtosis and skewness are determined by its inherent variability. The shape of the PDF was determined empirically where data were available to do so; otherwise, information from the literature and expert opinions were used to estimate them. The simulation was repeated 10 000 times.
In the current study, uncertainty analysis was performed using Analytica® software, a modular-based software programme (Granger-Morgan & Henrion Reference Granger-Morgan, Henrion, Granger Morgan and Henrion1990; Lumina 2007). The uncertainty range reported in the current paper is a variation of the method outlined by Moss & Schneider (Reference Moss, Schneider, Pachauri, Taniguchi and Tanaka2000) and IPCC (Reference Penman, Kruger and Galbally2000a ) to quantify the relative methane emission uncertainty. This is given as

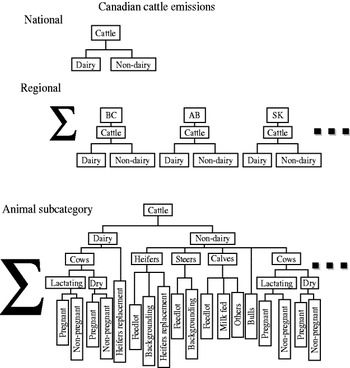
There may be some cases where correlation may exist between different input variables such as the case when the same activity data or EFs are used for multiple estimates. Using a random selection method, MCS is capable of dealing with varying degrees of correlation (both in time and between source categories), provided they have been accurately quantified. The proper application of this approach requires not only the identification, quantification and evaluation of the correlation for a range of inventory categories but also knowledge of correlation regardless of the method used for the calculation of uncertainties (IPCC Reference Penman, Kruger and Galbally2000c ). In a highly disaggregated model such as that used for calculating emission estimates in Canada (Fig. 1), this would require an understanding of correlations between provincial parameters and individual animal production parameters. Activity data and many of the parameters used in the model are collected at the provincial scale and their uncertainty is estimated at that level of disaggregation. However, some coefficients cannot presently be determined at the provincial level, because their values are based on publications, expert opinions and/or IPCC default values. In such cases, two different approaches can be considered: it can be assumed that there is a one to one correlation between these variables from region to region and animal subcategory to animal subcategory. In this case, the values of the coefficients (for each animal category) are constant for the entire country. This approach employs one random value for each coefficient for the whole country and all animal subcategories. Or, it can be assumed that there is no correlation among regions and variables and each of these coefficients varies randomly among the regions and among animal subcategories. In practice, increasing the degree of disaggregation in the model increases the probability that positive variance in one area of the country or one animal production stage will be counter-balanced by negative variance in another area of the country or in another animal production stage. The first method is likely to overestimate uncertainty, because it assumes 100% correlation between provinces, whereas the second method would underestimate the uncertainty, as complete independence between parameters is assumed. Adopting a conservative approach, the uncertainty values reported in the current study were estimated using the first method, assuming 100% correlation. The sensitivity analysis compared values obtained using the disaggregated method at the provincial and animal subcategory levels.
Diagram of summation process for disaggregated subcategories and regions in the Canadian agricultural enteric fermentation model.

Data requirements for uncertainty analysis
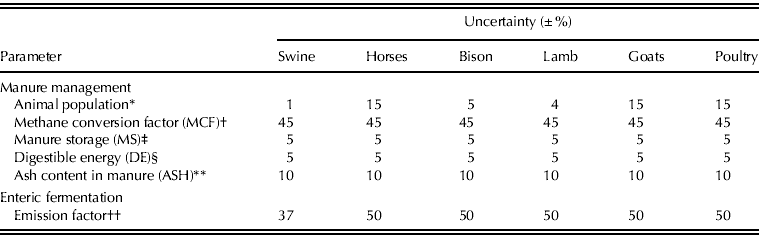
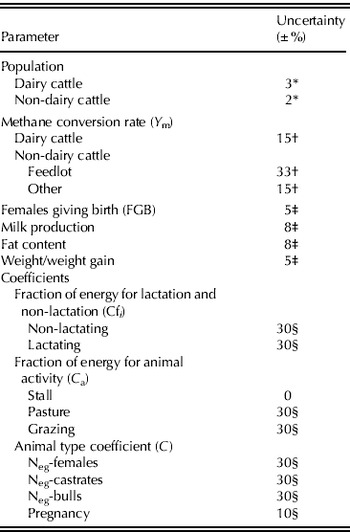
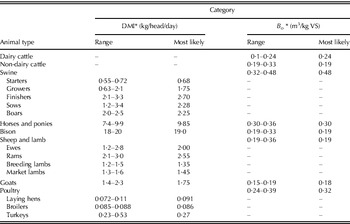
All inputs with associated uncertainty, range of uncertainty and their source are listed in Tables 1–3. Activity data in Canada are based on agricultural statistics collected from different provincial and national sources. Statistics Canada collects animal populations with a s.d. derived from a survey conducted at the provincial level for different animal subcategories. The s.d. serves as a measure of uncertainty associated with the animal population.
Uncertainties in the inputs used for estimating methane emissions from manure management systems and enteric fermentation (livestock other than cattle)

Sources: * Environment Canada (2007).
† Expert opinion.
‡ Bourque & Koroluk (Reference Bourque and Koroluk2003).
§ Marinier et al. (Reference Marinier, Clark and Wagner-Riddle2004a ).
** Swine Marinier et al. (Reference Marinier, Clark and Wagner-Riddle2004a ).
†† All others: Monni et al. (Reference Monni, Perala and Regina2007).
Uncertainties in the inputs used for estimating methane emissions associated with enteric fermentation from dairy cattle and non-dairy cattle

Sources: * R. Plourde, Statistics Canada, Livestock and Food Section, Ottawa, Ontario, Canada. 4 April 2010 (personal communication).
‡ Expert opinion.
§ Monni et al. (Reference Monni, Perala and Regina2007).
Range and most likely values* associated with dry matter intake (DMI) and maximum methane producing capacity (Bo) used for estimating methane emissions from manure management for livestock

* DMI and B o ranges were taken from Marinier et al. (Reference Marinier, Clark and Wagner-Riddle2004a ) with a triangular probability distribution function.
Although stochastic methods such as MCS can be used to estimate uncertainties in model outputs, it should be emphasized that not all uncertainties can be considered in an up-scaling exercise. Assumptions must be made in estimating methane emissions from Canadian livestock and these assumptions contribute to some uncertainties. These include:
-
• When the source of the uncertainty information was supplied as a percentage±error, normal distribution was assumed.
-
• For parameters coming from the IPCC when uncertainty was not given, and literature data were sparse, triangular distributions were assumed with the IPCC value as the most likely value.
-
• Uncertainty was assigned at the level of disaggregation that the data were collected. All default data from the IPCC were assigned at the national level.
The reported uncertainty range is standardized by providing their relative values (in percent). For example, for feedlot cattle and all other cattle not in feedlots the uncertainty value is ±0·01 for the Y m values of 0·03 and 0·065, becoming 33 and 15%, respectively (Table 2).
Sensitivity analysis
Sensitivity analyses identified parameters that have a significant effect on the uncertainty estimates. The relative sensitivity of input variables was assessed by MCS using the rank correlation coefficients calculated between all input variables and the methane emission estimates as their contribution to the overall uncertainty. In the current analysis, sensitivity was assessed in two ways: first a standard analysis was carried out on all parameters to establish the most sensitive input parameters by modifying the uncertainty of each parameter by a fixed percentage and identifying how much the total uncertainty changed.
Once the most sensitive variables (i.e. Y m, Cf i and MCF) were identified, a further evaluation of the sensitivity of these parameters to correlations among regions and animal subcategories was carried out. This was done by constructing the model at those levels and incorporating correlation among parameters into the model. The uncertainty for each parameter was varied between 0·3 and 3 times its estimated uncertainty value as taken from the parameter's source. The total uncertainty for methane emissions was then recorded. This process was carried out (i) first assuming 100% correlation at regional scale and among animal subcategories; (ii) then assuming no correlation at the regional but complete correlation among cattle subcategories; (iii) and finally assuming no correlation among regions or animal subcategories. This analysis provided an evaluation of the potential impact of the development of more refined site and management specific parameters, as opposed to the use of generic or default parameters.
RESULTS
Methane emissions and associated uncertainties
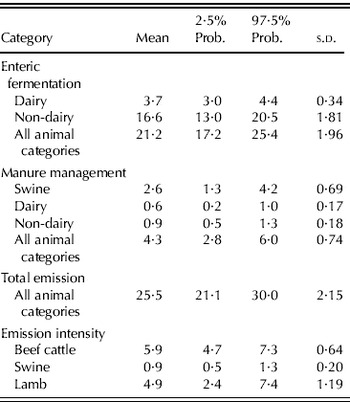
In 2008, average total methane emissions from Canadian livestock were 25·5 Teragram CO2 equivalents (Tg CO2e). The overall uncertainty range in estimates of total methane emissions from Canadian livestock was calculated to be from −17 to +18%. Methane emissions from enteric fermentation from all livestock sources varied between 17·2 and 25·4 Tg CO2e with a mean value of 21·2 Tg CO2e (Table 4). Non-dairy cattle were the largest source of emissions from enteric fermentation, emitting 16·6 Tg CO2e. In comparison, emissions from dairy cattle in Canada were 3·7 Tg CO2e, and all other animal categories contributed small amounts. On a relative basis the 95% confidence interval for nation-wide methane emission from enteric fermentation was −18 to +20%. Confidence intervals of −19 to +20% and −22 to +24% for nation-wide enteric fermentation were estimated for dairy and non-dairy cattle, respectively (Table 4).
Mean methane emissions for dairy, non-dairy and all animal categories in 2008 and their 95% confidence intervals for enteric fermentation, manure management and total emissions. The mean emission intensities for beef cattle, swine and lamb are also given for the same year

Values in the table are in kg CO2e/kg LW for emission intensity and Tg CO2e for all others.
The uncertainty range for nation-wide methane emissions from manure management varied from −34 to +39% (95% confidence interval) of the mean estimate of 4·3 Tg CO2e in 2008. Liquid manure storage systems were the main sources of methane. In Canada, almost all swine manure is stored as a liquid (96%; Marinier et al. Reference Marinier, Clark and Wagner-Riddle2004a ) and represents the largest source of methane emissions from manure management systems (Table 4).
Emission intensities
Methane emissions intensities in kg CO2e calculated on the basis of kg of LW at the farm gate were estimated to be 5·9, 0·9 and 4·9 for beef cattle, swine and lamb, respectively (Table 4). The uncertainty range around the means was lowest for beef cattle (45% of the mean), probably due to the use of the Tier 2 IPCC calculation methodology, but was very high for swine (99% of the mean), and sheep and lamb (101% of the mean), which used IPCC Tier 1 methodology (Table 4).
Sensitivity analysis
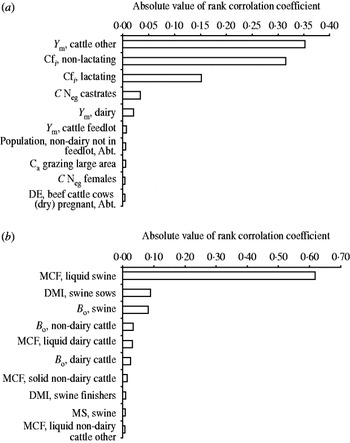
Sensitivity analysis demonstrated that for national enteric fermentation, Y m for non-dairy cattle and Cf i , were the main contributors to the uncertainty (Fig. 2 a). Similarly, sensitivity analysis on national methane emissions from manure management showed that the MCF for liquid swine manure had the greatest contribution to the uncertainty (Fig. 2 b). These are IPCC default parameters that are assumed to apply to all livestock in Canada at the national scale. In the case of Y m and MCF, the parameters are direct multipliers to the EF estimate (equations 4·14 and 4·17, respectively, in IPCC Reference Penman, Kruger and Galbally2000a ). In the case of Cf i , the parameter is a non-linear parameter associated with the calculation of net energy for maintenance (NEm) (Equation 4·1 in IPCC Reference Penman, Kruger and Galbally2000a ).
(a) The most important factors affecting the overall uncertainty in enteric methane emission in Canada in 2008, measured by value of Rank correlation coefficient between the parameter and the total enteric fermentation emission. (b) The most important factors affecting the overall uncertainty in methane emission from manure in Canada in 2008, measured by value of Rank correlation coefficient between the parameter and the total methane emission from manure.

DISCUSSION
Methane emissions and associated uncertainties
For both enteric fermentation and manure management, the EFs were the main source of uncertainty. The uncertainty ranges in EFs were very high due to the number of uncertain parameters with large uncertainty included in the calculation. The uncertainty in the EFs for enteric fermentation for dairy and non-dairy cattle was −19 to +20% of the mean and −21 to +24% of the mean, respectively, and the uncertainty in the EFs for manure management was −52 to +65% of the mean and −35 to +49% of the mean for dairy and non-dairy, respectively. The uncertainty of enteric fermentation Tier 2 EFs is lower than the IPCC Tier 1 EFs (Table 1). However, manure management uncertainty for dairy cattle tends to be higher than the uncertainties reported by the IPCC. Furthermore, the main motivation towards the use of Tier 2 methodology is to incorporate the country-specific parameters that could increase the accuracy of emission estimates.
Environment Canada (2005), in its annual GHG inventory, estimated relative uncertainties for Canadian agroecosystems to be c. 18% of the mean for livestock using the IPCC Tier I methodology. Although the value reported in the current work was much higher than the estimates of uncertainty in nation-wide methane emissions reported by Environment Canada, it was lower than the value reported by Kaharabata et al. (Reference Kaharabata, Schuepp and Desjardins2000). An uncertainty range of ±30% of the mean for methane emission from the barn and feedlot experiments were estimated by Kaharabata et al. (Reference Kaharabata, Schuepp and Desjardins2000) for dairy cattle in Canada. Monni et al. (Reference Monni, Perala and Regina2007) estimated the national-scale uncertainty for Finnish agriculture associated with EF for enteric fermentation of different cattle subcategories to range from −22 to +29% of the mean to −29 to +39% of the mean. In contrast, the uncertainty for enteric methane emissions summarized and reported by Rypdal & Winiwarter (Reference Rypdal and Winiwarter2001) for some European countries ranged from ±20% of the mean in UK to ±50% of the mean in Austria.
Parameter uncertainty, sources and choices
Obtaining the best estimates of uncertainty requires robust PDFs, based on large quantities of data. For most parameters used in the IPCC Tier 2 methodology, such data sets are lacking. For IPCC Tier 2 default parameters such as Cf i and MCF, key elements in methane emission calculation methodology, no estimates of uncertainty are given. A short analysis of the history of the evolution of these parameters since 1997 leads to significant questions about the potential range of these parameters. For example, for cool climate liquid/slurry manure management, the revised 1996 IPCC guidelines proposed an MCF of 0·10 (IPCC 1997). However, in the IPCC (Reference Penman, Kruger and Galbally2000b ) Good Practices Guidance, this value was increased to 0·39. When the IPCC 2006 Guidelines (IPCC Reference Eggleston, Buendia, Miwa, Ngara and Tanabe2006) were published, for the same climate, the MCF values ranged from 0·10 (with natural crust cover at ⩽10°C) to 0·25 (without natural crust cover at 14°C). Measured MCF values for liquid systems range from >1·00 (suggesting that in this case the B o , the maximum methane producing capacity, was underestimated) (Kaharabata et al. Reference Kaharabata, Schuepp and Desjardins1998; Lague et al. Reference Lague, Gaudet, Agnew and Fonstad2005; Park et al. Reference Park, Wagner-Riddle and Gordon2010) to <0·01 (Massé et al. Reference Massé, Masse, Claveau, Benchaar and Thomas2008). The most complete work to date for liquid systems, in Canada, was carried out by Wagner-Riddle et al. (Reference Wagner-Riddle, Park and Thurtell2006) and included monitoring for four seasons. On average MCF values came out to c. 0·10, but within the five liquid tanks being monitored, there was still a range in MCF of 0·04–0·36. Other studies (Pattey et al. Reference Pattey, Trzcinski and Desjardins2005; VanderZaag et al. Reference VanderZaag, Gordon, Jamieson, Burton and Stratton2009, Reference VanderZaag, Gordon, Jamieson, Burton and Stratton2010) have observed MCF values ranging from 0·10 to 0·55 depending on time of year of measurement. Adopting an uncertainty value of ±50% of the mean for the product of MCF and MS, Bretscher & Leifeld (Reference Bretscher and Leifeld2008) derived an uncertainty value of ±25·5% of the mean for MS in Switzerland. Applying error propagation laws, this results in an uncertainty value of about ±43% of the mean for MCF. Similarly, MCF for solid manure was increased from 0·01 reported in the Good Practices Guidance (IPCC Reference Penman, Kruger and Galbally2000b ) to 0·02 in the IPCC (Reference Eggleston, Buendia, Miwa, Ngara and Tanabe2006) Guidelines, which indicates a relative increase of +100%. Pattey et al. (Reference Pattey, Trzcinski and Desjardins2005) measured emissions from solid manure sources and observed lower MCFs from compost (0·001–0·01) and higher MCFs (0·03–0·06) from stockpiles. Gonzalez-Alvalos & Ruiz-Suarez (Reference Gonzalez-Alvalos and Ruiz-Suarez2007) reported that the MCF values for grazing animals can be 17·3 times smaller than the values suggested in IPCC (1997). Despite all efforts made so far, the uncertainties associated with these values remain unclear. In the current study, a large uncertainty range is used (±45% of the mean) based on expert opinions; however, the choice of this value simply indicates that our confidence in the MCF value is low. Therefore the actual value of the total uncertainty estimate for manure management must be taken into the context that it is highly dependant on a value that is highly uncertain.
For enteric fermentation EF calculations, the suggested Y m was changed from 0·06±0·005 of GEI (IPCC Reference Penman, Kruger and Galbally2000b ) to 0·065±0·01 of GEI (IPCC Reference Eggleston, Buendia, Miwa, Ngara and Tanabe2006) for all classes of cattle not in feedlots. For feedlot cattle, the Y m value was reduced from 0·04±0·005 (IPCC Reference Penman, Kruger and Galbally2000b ) to 0·03±0·01 (IPCC Reference Eggleston, Buendia, Miwa, Ngara and Tanabe2006) of GEI. For both cases, the uncertainty range was increased from ±0·005 (IPCC Reference Penman, Kruger and Galbally2000b ) to ±0·01 (IPCC Reference Eggleston, Buendia, Miwa, Ngara and Tanabe2006). This is in agreement with published values of Y m which indicate higher variability especially for cattle not in feedlots. For grazing cattle, Lassey (Reference Lassey2007) summarized Y m values measured using the sulphur hexafluoride (SF6) tracer technique, which ranged from 0·037 to 0·095 (average of 0·063 with the majority of the values between 0·06 and 0·07). Despite the large range of Y m values, Lassey (Reference Lassey2007) broadly supported the range suggested by the Good Practice Guidance (IPCC Reference Penman, Kruger and Galbally2000b ). The Y m values taken from compilations of Canadian studies ranged from 0·046 to 0·095 with an average value of 0·066±0·012 for all cattle categories, with the exception of those in the feedlot that had Y m values of 0·032±0·008 (Kebreab et al. Reference Kebreab, Clark, Wagner-Riddle and France2006; Ominski et al. Reference Ominski, Boadi, Wittenberg, Fulawka and Basarab2007; Ellis et al. Reference Ellis, Kebreab, Odongo, McBride, Okine and France2007, Reference Ellis, Kebreab, Odongo, Beauchemin, McGinn, Nkrumah, Moore, Christopherson, Murdoch, McBride, Okine and France2009; van Haarlem et al. Reference van Haarlem, Desjardins, Gao, Flesch and Li2008). In the case of Y m, there are more studies available to evaluate the value of the parameter, and it is not as uncertain as MCF, yet it is clear that uncertainty estimates of parameters, particularly those supplied by expert opinions are at best rough estimates.
Sensitivity analysis
The Canadian livestock GHG model is a disaggregated model, both spatially (separate calculations are made for each individual region) and in terms of the different number of livestock categories and classes. In the cattle model, dairy is divided into nine subcategories and production stages and non-dairy into 29 subcategories and production stages. As stated earlier, emissions were calculated at the animal subcategories and regional scales. These individual subcategories and production stages in individual regions cannot be assumed to be independent of one another. Therefore, the uncertainty of the IPCC default parameters at the present time must be applied at the national level for all subcategories, as the degree of correlation among regions and among subcategories is not known.
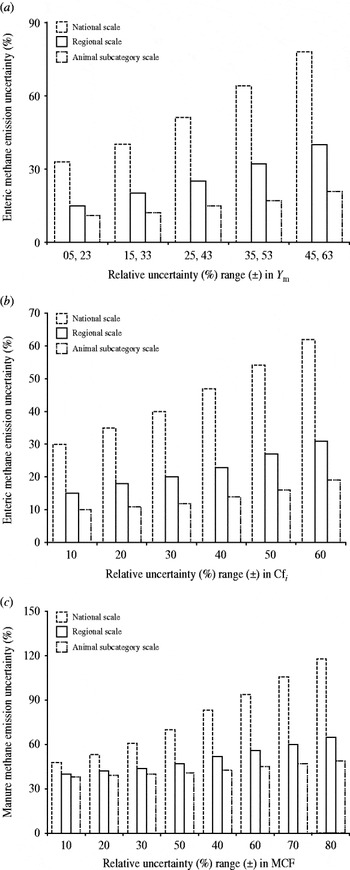
To test the sensitivity of the uncertainty in the model to correlations among parameters for different regions and animal subcategories, the input uncertainties of these parameters were varied and applied at differing levels of correlation (Fig. 3 a–c). When the uncertainty in default parameters was applied at the national level (i.e. one uncertain value applies to all disaggregated regions and production stages under it), increasing the uncertainty of Y m resulted in a corresponding almost linear increase in enteric fermentation uncertainty with a slope of 1·14 (for each increase of ±1% in uncertainty of the parameter there was a corresponding increase of 1·14% on the total uncertainty) (Fig. 3 a). The results are similar for Cf i except that the model was less sensitive (slope of 0·64), probably due to the non-linearity of equation 4·1 in the IPCC guidelines to calculate NEm (IPCC Reference Penman, Kruger and Galbally2000b ).
(a) Effect of model structure and varying the relative uncertainty of the input variable Y m on the overall uncertainty associated with methane emissions from enteric fermentation (each set of the numbers on the x-axis represents the Y m uncertainties applied for cattle categories not in feedlot and feedlot cattle, respectively). (b) Effect of model structure and varying the relative uncertainty of input variable Cf i on the overall uncertainty associated with methane emissions from enteric fermentation. (c) Effect of model structure and varying the relative uncertainty of input variable MCF on the overall uncertainty associated with methane emissions from manure sources.

When the IPCC default parameters are applied at the disaggregated provincial scale, assuming no correlation of Y m and Cf i between provinces, by increasing uncertainty for Y m and Cf i , the overall uncertainty of the emission estimates were reduced. This resulted in a reduced slope of the correlation line that relates the increase in parameters to total enteric fermentation uncertainty. The slope of correlation line for Y m was reduced to 0·60 and for Cf i to 0·31 for the provincially disaggregated model (Fig. 3 a, b). Further disaggregation of the parameters, assuming complete independence among animal subcategories at the provincial level resulted in a slope of 0·25 and 0·18 (Fig. 3 a, b) for Y m and Cf i , respectively.
Similarly, in the context of manure management, the MCF factor had a large impact on manure management uncertainty. When the uncertainty in MCF was applied at the national level, increasing the uncertainty of MCF caused a linear increase in total uncertainty of manure management methane emission with a slope of 1·0 for the correlation line that relates the increase in MCF parameter to total manure management methane emission uncertainty. Correspondingly, in the case of the model disaggregated to the provincial scale, increasing the MCF uncertainty resulted in a corresponding linear increase in manure emission uncertainty with a slope of 0·64 and 0·16 for the provincially disaggregated and animal subcategory disaggregated model (Fig. 3 c), respectively.
As parameter uncertainty is applied at an increasingly finer scale, the model becomes less sensitive to parameter uncertainty. Comparing the national and animal subcategory level models, the slope of the parameter uncertainty v. total enteric fermentation uncertainty for Y m decreased from 1·14 to 0·25, for Cf i from 0·64 to 0·18 and for MCF from 1·0 to 0·16, relative to total manure management uncertainty (Fig. 3 a–c).
Reducing uncertainties in the emission estimates
The current analysis demonstrates that a large proportion of the uncertainty in the Canadian livestock model is associated with the use of globally applied IPCC default parameters. In Canada, as in many regions of the world, research is under way to derive better estimates of the main parameters that influence methane emissions in agroecosystems. Studies examining the value of Y m over the past 10 years indicate that it is highly dependent on diet and production environment. Animals on different quality pastures and under different feeding regimes had different Y m (Benchaar et al. Reference Benchaar, Pomar and Chiquette2001, Reference Benchaar, Petit, Berthiaume, Whyte and Chouinard2006; Boadi & Wittenberg Reference Boadi and Wittenberg2002; Boadi et al. Reference Boadi, Wittenberg and McCaughey2002, Reference Boadi, Ominsky, Fulawka and Wittenberg2004; McGinn et al. Reference McGinn, Beauchemin, Coates and Colombatto2004, Reference McGinn, Chung, Beauchemin, Iwaasa and Grainger2009; Beauchemin & McGinn Reference Beauchemin and McGinn2005, Reference Beauchemin and McGinn2006; Beauchemin et al. Reference Beauchemin, McGinn and Petit2007; van Haarlem et al. Reference van Haarlem, Desjardins, Gao, Flesch and Li2008). Ellis et al. (Reference Ellis, Kebreab, Odongo, McBride, Okine and France2007, Reference Ellis, Bannink, France, Kebreab and Dijkstra2010), in developing and testing empirical and mechanistic methane emission models, have gathered data for Canada and the Northern United States that demonstrate that emissions are closely linked to animal's diet. Kebreab et al. (Reference Kebreab, Johnson, Archibeque, Pape and Wirth2008) recommended that national GHG inventories use diet-specific Y m values that are predicted by mechanistic models to estimate methane emissions from cattle. Developing Y m based on local production and feeding practices would result in the disaggregation of this parameter to the regional and subcategory scale and could then be considered to be independent of uncertainty assigned at that level of disaggregation.
The EPA has developed temperature-dependent parameters for the correction of MCF factors (Mangino et al. Reference Mangino, Bartram and Brazy2001). However, little research has been done to adapt these parameters to the cold conditions in Canada. Marinier et al. (Reference Marinier, Clark and Wagner-Riddle2004a ) have proposed modifications for liquid systems, but the parameter modifications are based on research in Southern Ontario, one of the warmest regions of Canada. Actual measured MCF values in Canada are scarce, inconsistent in methodology and literature generally lacks the information that is required to evaluate and compare studies, such as: measured manure B o , measured VS, and simultaneously measured and reported animal number, size and production stage, environmental conditions and animal diet. Very few studies have been carried out in Canada quantifying methane emissions from solid sources and essentially none have been done under a range of environmental conditions.
In the case of Cf i , there is even less research; however, there is mounting evidence of the temperature dependency of this factor. Although the IPCC (Reference Eggleston, Buendia, Miwa, Ngara and Tanabe2006) guidelines propose a temperature-based modification of the Cf i , increasing NEm with decreasing temperature, evidence from measurements in Canadian winters suggests that methane emissions may decrease during winter due to changes in rates of passage in the digestive tract (McAllister et al. Reference McAllister, Okine, Mathison and Cheng1996; Galbraith et al. Reference Galbraith, Mathison, Hudson, McAllister and Cheng1998).
While research is not yet conclusive, it appears to be possible to effectively quantify, either through measurements or models, the dependence of Y m, Cf i and MCF, on either livestock diet and/or climate for individual provinces and animal subcategories and production stages. In the sensitivity analysis carried out, disaggregating parameters to finer scales would reduce overall uncertainty by 20–25%, even with a doubling of parameter uncertainty for each individual subcategory and region.
CONCLUSIONS
Monte Carlo simulation was employed to estimate the uncertainties associated with methane emissions produced by livestock in Canada and to identify the most important variables influencing the uncertainties in the emission estimates. National methane emissions from enteric fermentation and manure management in 2008 were 21·2 and 4·3 Tg CO2e, respectively. The uncertainties, defined as the 95% confidence interval, relative to the mean, for these values were 38 and 73% of the mean. Population estimates had low uncertainty and the majority of the uncertainties were associated with EFs, which were 39 and 45% of the mean for dairy and non-dairy enteric fermentation, respectively, and 118 and 83% of the mean for dairy and non-dairy manure management, respectively. The estimated methane emission intensities (kg CO2e/kg live animal weight) were 5·9, 0·9 and 4·9 from Canadian beef, swine and lamb, respectively, with uncertainties of 44, 99 and 101% of the mean.
Sensitivity analysis demonstrated that the majority of emission uncertainty was associated with the use of IPCC default parameters for Y m, Cf i and MCF. The use of IPCC default parameters that are assumed to be correlated among regions, animal subcategories and production stages, magnified the uncertainties. Further sensitivity analysis demonstrated that when these parameters were disaggregated to the provincial scale, overall uncertainties were reduced to 20 and 48% of the mean for enteric fermentation and manure management, respectively. By further disaggregation of these parameters to the animal subcategory scale, uncertainties were reduced to 13 and 41% of the mean for enteric fermentation and manure management, respectively. Once disaggregated, doubling the uncertainty of the input parameters (at the provincial and animal subcategory) only increased the overall uncertainties around the means by about 10%, resulting in 22 and 52% of the mean overall uncertainty for enteric fermentation and manure management, respectively, compared with 38 and 73% of the mean.
The current analysis demonstrated that care is required when carrying out uncertainty analyses to assure that parameter uncertainty is assigned in the model according to the spatial and structural scale at which the information was collected. The uncertainty associated with individual parameters cannot be disaggregated without strong evidence of independence. From the perspective of the Canadian GHG inventory, this analysis suggests that emissions uncertainty could be significantly reduced if research focuses, either through modelling or measurement, on the development of country specific Y m, Cf i and MCF parameters that are refined regionally and for different animal subcategories and production stages.