Introduction
Intelligibility can be defined as “the accuracy with which a listener correctly understands another person's spoken message as it was intended” (Svirsky, Chin, & Jester, Reference Svirsky, Chin and Jester2007, p. 293), and is therefore crucial to successful human communication. In recent years, there has been a growing interest in using intelligibility scores as assessment tools for speech therapists (i.a. McLeod, Harrison, & McCormack, Reference McLeod, Harrison and McCormack2012), to help them evaluate delays in phonological development or speech pathologies and track the progress of children undergoing speech therapy (i.e., the evolution of their speech production). Since the 1980s, intelligibility has been seen as one of the markers of success for cochlear implantation.
Cochlear implantation is proposed to severely-to-profoundly hearing-impaired children and adults, allowing them to access audio information, and leading to a better perception of sounds of their environment in general, and of speech sounds in particular. This improved perception helps them to develop their speech production, and therefore their ability to communicate orally with others (Niparko et al., Reference Niparko, Tobey, Thal, Eisenberg, Wang, Quittner and Fink2010). However, the signal provided through the cochlear implant is degraded in comparison with the audio information available with normal hearing. Perception with an implant remains partial and for pre- and perilingually deaf children with cochlear implants (CIs), it can lead to delayed phonological development and language acquisition at several linguistic levels, when compared to peers with typical hearing of the same age. Indeed, children with CIs produce speech sounds with less accuracy (i.a. Chin & Pisoni, Reference Chin and Pisoni2000; Gaul-Bouchard, Le Normand, & Cohen, Reference Gaul-Bouchard, Le Normand and Cohen2007; Faes & Gillis, Reference Faes and Gillis2016), they have more difficulties with morphological and syntactic characteristics of speech or with narrative skills (i.a. Le Normand, Reference Le Normand2004; Boons et al., Reference Boons, De Raeve, Langereis, Peeraer, Wouters and Van Wieringen2013; Geers & Nicholas, Reference Geers and Nicholas2013), and they have a smaller lexicon and are less active in oral communication than children with typical hearing (Briec, Reference Briec2012). Several studies on speech and language acquisition in children with CIs have emphasized the role of early cochlear implantation before two years of age (i.a. Fryauf-Bertschy, Tyler, Kelsay, Gantz, & Woodworth, Reference Fryauf-Bertschy, Tyler, Kelsay, Gantz and Woodworth1997; Govaerts et al., Reference Govaerts, De Beukelaer, Daemers, De Ceulaer, Yperman, Somers and Offeciers2002; Geers, Reference Geers2004; Artières, Vieu, Mondain, Uziel, & Venail, Reference Artières, Vieu, Mondain, Uziel and Venail2009; Szagun & Schramm, Reference Szagun and Schramm2016; Majorano et al., Reference Majorano, Guidotti, Guerzoni, Murri, Morelli, Cuda and Lavelli2018) as a predictor to phonological development and language acquisition with a similar trajectory to that of children with typical hearing.
The few studies on speech production presented here (among others) focus on the abilities of children with CIs as speakers, and their language and speech developments are assessed through objective characterizations of the linguistic (phonetic, morphosyntactic, etc.) accuracy of their productions, often compared to normative data. However, linguistic accuracy is not necessarily equal to intelligibility: evaluating how one's production is understood by listeners necessarily implies subjective assessment of the speaker's production by listeners.
The factors affecting intelligibility in children with CIs have been explored in a number of studies with various outcomes. Intelligibility has been found to be correlated with chronological age in children aged 3;9 to 6;2 in the study by Flipsen and Colvard (Reference Flipsen and Colvard2006), and those aged 2;5 to 18 in the study by Habib, Waltzman, Tajudeen, and Svirsky (Reference Habib, Waltzman, Tajudeen and Svirsky2010), but not in those aged 4;8 to 11;1 in the study by Khwaileh and Flipsen (Reference Khwaileh and Flipsen2010). It has been found to be correlated with age at implantation in Calmels et al. (Reference Calmels, Saliba, Wanna, Cochard, Fillaux, Deguine and Fraysse2004), Svirsky et al. (Reference Svirsky, Chin and Jester2007), Habib et al. (Reference Habib, Waltzman, Tajudeen and Svirsky2010), and Montag, AuBuchon, Pisoni, and Kronenberger (Reference Montag, AuBuchon, Pisoni and Kronenberger2014), but not in the studies of Blamey et al. (Reference Blamey, Barry, Bow, Sarant, Paatsch and Wales2001), Flipsen and Colvard (Reference Flipsen and Colvard2006), and Khwaileh and Flipsen (Reference Khwaileh and Flipsen2010). It is correlated with hearing age in the studies by Miyamoto et al. (Reference Miyamoto, Svirsky, Kirk, Robbins, Todd and Riley1997), Blamey et al. (Reference Blamey, Barry, Bow, Sarant, Paatsch and Wales2001), Flipsen and Colvard (Reference Flipsen and Colvard2006), and Khwaileh and Flipsen (Reference Khwaileh and Flipsen2010). These diverging results might be explained by different speech materials considered (most studies use repeated words and utterances or even read sentences but seldom use spontaneous speech to assess the children's intelligibility), by different measurements used to judge the children's intelligibility (either transcriptions of speech samples or perceptual judgements of the reception of the children's production are used indifferently to assess intelligibility), or by the listeners’ familiarity with pathological speech in children (speech therapists, phoneticians, students, naive listeners).
In particular, the tasks used in these intelligibility studies might be the cause of variation in results, as they test different interpretations of intelligibility, i.e., phonetic accuracy of a child's productions vs. accuracy of a listener's understanding. Some studies on children with CIs consider intelligibility as a level of production accuracy measured by orthographic or phonetic transcriptions of segments, words, or utterances by adult listeners (Blamey et al., Reference Blamey, Barry, Bow, Sarant, Paatsch and Wales2001; Flipsen & Colvard, Reference Flipsen and Colvard2006; Montag et al., Reference Montag, AuBuchon, Pisoni and Kronenberger2014), others as the perceived level of accuracy in word-repetition tasks (Poissant, Peters, & Robb, Reference Poissant, Peters and Robb2006; Chuang, Yang, Chi, Weismer, & Wang, Reference Chuang, Yang, Chi, Weismer and Wang2012), or as a level of understanding of the children's speech production by other speakers (e.g., Calmels et al., Reference Calmels, Saliba, Wanna, Cochard, Fillaux, Deguine and Fraysse2004; Van Lierde, Vinck, Baudonck, De Vel, & Dhooge, Reference Van Lierde, Vinck, Baudonck, De Vel and Dhooge2005). In all these studies, intelligibility is found to be lower in children with CIs, when compared to normative data or to children with typical hearing.
Further studies use standardized tests comprising both annotations and grades to assess intelligibility. Miyamoto et al. (Reference Miyamoto, Svirsky, Kirk, Robbins, Todd and Riley1997), Habib et al. (Reference Habib, Waltzman, Tajudeen and Svirsky2010), Khwaileh and Flipsen (Reference Khwaileh and Flipsen2010), and Hassanzadeh (Reference Hassanzadeh2012) use the Beginners's Intelligibility Rating (BIT; Osberger, Robbins, Todd, & Riley, Reference Osberger, Robbins, Todd and Riley1994) and the CSIM (Children's Speech Intelligibility Measure; Wilcox & Morris, Reference Wilcox and Morris1999): listeners (speech therapists, phoneticians, students …) are asked to rate the intelligibility of the child's speech as their perceived accuracy of sentences or segments in a repetition task, and to transcribe excerpts of the child's speech, from which a percentage of segmental accuracy is computed. Calmels et al. (Reference Calmels, Saliba, Wanna, Cochard, Fillaux, Deguine and Fraysse2004) use the Speech Intelligibility Rating (SIR; Allen, Nikolopoulos, & O'Donoghue, Reference Allen, Nikolopoulos and O'Donoghue1998): the children's own speech therapists assign a grade reflecting how well other listeners (e.g., parents, speech therapists) might understand the child's connected speech, but this study does not provide direct judgements by those listeners.
Most studies do not assess how much of a child's spontaneous speech is understandable. This is what was targeted in the present paper through listeners’ subjective judgements of children's speech production: we explore (1) the ability of children with CIs to be as intelligible as age-matched children with typical hearing, (2) the variation in intelligibility between the ages of six and eleven years in children with CIs and children with typical hearing, (3) the role of age at implantation as a predictor to a successful cochlear implantation, and (4) the influence of expertise in judging the intelligibility of children's speech. We use spontaneous speech as test material since it reflects the children's production abilities in a naturalistic setting. This choice also helps to avoid an interference of other cognitive processes at play in repetition or reading tasks (i.e., children use their own words and syntax instead of reading or replicating unfamiliar text).
The methodology we chose is motivated by the lack of studies in French-speaking children with CIs (only Calmels et al., Reference Calmels, Saliba, Wanna, Cochard, Fillaux, Deguine and Fraysse2004, provide assessments of the intelligibility of French-speaking children with CIs, with no control group), and the need to assess intelligibility as the reception by listeners of the children's message produced in an ecological setting.
Method
The protocol consists of two stages. First, we collect spontaneous speech from children with CI and children with typical hearing, from which sample sentences are selected for the evaluation. Then, we submit these speech samples to adult listeners, who are asked to rate their intelligibility on a 7-point scale. The perceptual assessment part of this experiment is a laboratory task, which makes it of course less ecological than face-to-face communication, but which allows us to obtain an evaluation of the same stimuli by all adult participants in comparable conditions.
Participants: children
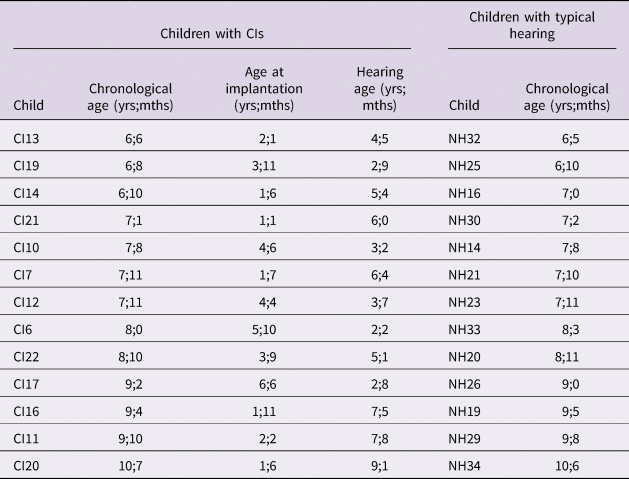
Participants in this study are 13 children with CIs (six girls and seven boys) and 13 children with typical hearing (seven girls and six boys), matched in chronological age (t(24) = 0.04, p = .97). The children with typical hearing were aged 6;5 to 10;6 (mean: 8;2; sd: 1;3) and the children with CIs were aged 6;6 to 10;7 (mean: 8;2; sd: 1;3) at the time of the recordings. For the children with CIs, age at implantation ranged from 1;1 to 6;6 (mean: 3;2; sd: 1;9) and hearing age ranged from 2;2 to 9;1 (mean: 5;3; sd: 2;3). All children were monolingual speakers of standard French, raised in the Lyon–Grenoble area. All children with typical hearing were screened for language and hearing impairments. Detailed ages of the children are given in Table 1.
Age information (in years;months) for the children of each group

Participants: listeners
Two groups of adult listeners participated in the study: 9 expert listeners (nine women, speech therapists / specialized schoolteachers) and 17 naive listeners (eight women, nine men, with no training in phonetics). Both groups were matched in age (t(24) = 0.89, p = .38): the expert listeners were aged 25;11 to 38;7 (mean: 30;3; sd: 4;0) and the naive listeners were aged 21;3 to 43 (mean: 28;6; sd: 5;11) at the time of the experiment. They were all native speakers of French and were living in various regions of France at the time of the experiment. All declared that they had not been diagnosed with hearing impairments. The study was approved by the local ethical committee (CERNI 2014-11-18-54).
Speech samples
We recorded all children in a narrative task: after seeing sequences of a cartoon, the children were asked to describe to the experimenter what they had just seen, and were encouraged to give as much detail as they could. The recordings took place in quiet rooms. We used a digital Marantz PMD-670 recorder (mono, sampling frequency 44 100 Hz, 16 bits), and an external microphone placed on a tripod, approximately 40 cm from the children's mouths.
Five independent utterances were extracted from each child's corpus (mid part of the corpus): all minimally included a subject, a verb, and a complement (word, phrase, or short clause) and were preceded and followed by a pause. All excerpts were then normalized in intensity (60 dB) on Praat (Boersma & Weenink, Reference Boersma and Weenink2015), to ensure a constant loudness for all stimuli. We used a total of 130 stimuli (26 speakers*5 sentences).
Evaluation procedure
The experiment was presented to each listener in quiet rooms, using a laptop and headphones. Each listener evaluated the utterances of all the children (each of the 130 stimuli were presented to each listener). We used a script for perception experiments in Praat. Participants were asked to rate the intelligibility of each utterance on a 1- to 7-point scale (Likert, Reference Likert1932), with 1 for ‘not intelligible/understandable at all’ and 7 for ‘fully intelligible/understandable’. When needed, participants could listen to each utterance two additional times. Utterances were presented in random order. There was no time constraint. A training phase always preceded the actual experiment, with data from different children (Scarbel, Reference Scarbel2012).
It should be noted here that we are not measuring the actual quantity of information that the listener understands from the child's speech, but more the way the listener feels about how much the child's speech is understandable. This measure was chosen to reflect how the speech of a child with CI is perceived in the community, regardless of objective accuracy.
Statistical analyses
Intelligibility scores on a 7-point scale can be viewed as ordered multi-categorical data. There are several multinomial regression models that can be used to model ordinal data (Agresti, Reference Agresti2002), such as the cumulative logit model. The dependency between the scores of a single child and a single listener is taken into account through random effects. The (logit transformed) cumulative probability, for child i and listener j, to have a score at most equal to c ( $c = 1\comma \;\;\ldots \comma \;7\rpar $ is modeled through a linear regression with random effects:
 $${\rm logit\;}\lsqb {P\lpar Y_{ijk} \le c\vert X_{ij}\comma \;\xi_i\comma \;\xi_j\rpar } \rsqb = \alpha _c-X_{ij}\beta -\xi _i-\xi _j\,\lpar c = 1\comma \;\ldots \comma \;\;C\rpar $$
where  $Y_{ijk}$ is the
 $k$th score of child i given by listener j (
 $i = 1\comma \;\ldots \comma \;\;I\comma \;\;\;j = 1\comma \;\ldots \comma \;\;J$ and
 $k = 1\comma \;\ldots \comma \;\;K$),
 $\alpha _c$ is the cutpoint-specific intercept associated to category c,
 $X_{ij}$ is the design matrix,
 $\beta $ is a vector of fixed effects,
 $\xi _i$ is the normal random effect of child i, and
 $\xi _j$ the normal random effect of listener j.
Estimation was obtained with the clmm function of the ordinal package (Christensen, Reference Christensen2019) in R (R Development Core Team, 2019). The following factors were considered in the initial model: group (children with CIs or with typical hearing), chronological age, and expertise of the listener (expert vs. naive). On the basis of the studies by Fryauf-Bertschy et al. (Reference Fryauf-Bertschy, Tyler, Kelsay, Gantz and Woodworth1997), Govaerts et al. (Reference Govaerts, De Beukelaer, Daemers, De Ceulaer, Yperman, Somers and Offeciers2002), Geers (Reference Geers2004), and Artières et al. (Reference Artières, Vieu, Mondain, Uziel and Venail2009) mentioned above, we decided to use age at implementation as a categorical variable, and to differentiate between children implanted before (N = 5) vs. after 24 months of age (N = 8). The effect of hearing age could not be explored in this study due to the high correlation to age at implantation: indeed, the children with early CIs in this study are also the children with the highest hearing ages. A selection of the significant covariates based on AIC comparisons (Akaike, Reference Akaike1974) and ANOVA tests between embedded models leads to the following final model:
 $${\rm logit\;}\lsqb {P\lpar Y_{ijk} \le c\vert X_{ij}\comma \;\xi_i\comma \;\xi_j\rpar } \rsqb = \alpha _c-\beta _11_{CI\_after24\comma \;\;i}-\beta _21_{NH\comma i}-\;\beta _3x_i-\xi _i-\xi _j$$
where  $\beta _1\;$and
 $\beta _2$ are the fixed effects of the children with CIs after the age of 24 months (
 $\beta _1\;\rpar $ and of the children with typical hearing (
 $\beta _2\rpar \;$with respect to the children with CIs before the age of 24 months group,
 $1_{CI\_after24\comma i}$ and
 $1_{NH\comma \;\;i}$ are the dummy variables indicating whether child i is a child implanted after the age of 24 months or not, and a child with typical hearing or not,
 $\beta _3\;$is the chronological age effect for the children implanted after the age of 24 months and
 $x_i$ is equal to the chronological age whether child i is a child implanted after the age of 24 months and 0 otherwise.
The probability for any typical child to obtain a score at most c can be computed. For example, for a child in the group of children with typical hearing, the probability of a score at most c is:
 $$P\lpar Y_i \le c\vert NH\rpar = {\rm logi}{\rm t}^{{-}1}\lpar \alpha _c-\beta _2\rpar.$$
Results
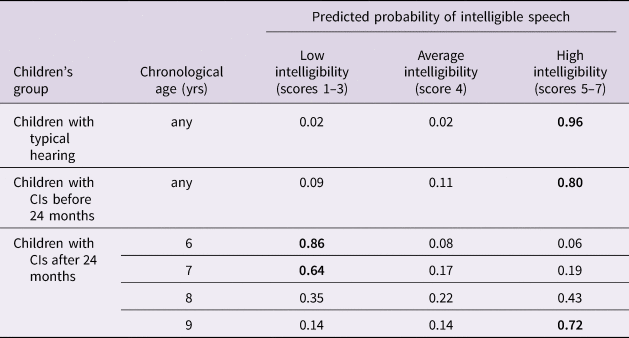
Table 2 presents the distribution of intelligibility scores given to each group. In this study, three levels of intelligibility were set: high intelligibility (scores 5 to 7), average intelligibility (score 4), and low intelligibility (scores 1 to 3). As shown in Table 2, children with typical hearing have a high level of intelligibility, as they mostly receive scores 5 (9.17% of all scores given to them), 6 (17.87%), and 7 (65.09%). Similarly, children with early CIs have a high level of intelligibility, as they receive scores 5 (12.48% of all scores given to them), 6 (18.00%), and 7 (38.77%). However, children with late CIs receive a more balanced distribution of scores, as they all range from 11.06% (score 1) to 20.48% (score 7), preventing us from clearly characterizing their level of intelligibility.
Distribution of intelligibility scores (percentage of all responses), given to each group of children by all listeners

The statistical analysis of the data indicates that children with typical hearing have a significantly higher intelligibility than children with early CIs (Estimate = 1.77, SE = 0.59, z = 2.99, p < .01), and that children with early CIs have a significantly higher intelligibility than children with late CIs (Estimate = –11.26, SE = 3.02, z = –3.73, p < .001).
Both children with typical hearing and children with early CIs have a stable intelligibility (from ages 6;5 to 10;7): even though it is lower than that of children with typical hearing as shown by the statistical analysis, intelligibility in children with early CIs does not change in the age span of our study. However, for children with late CIs, intelligibility is low in younger children, whereas it reaches the level of children with early CIs in older children. This is confirmed by the statistical analyses, as detailed in the ‘Method’ section: there is a significant effect of chronological age in children with late CIs only (Estimate = 0.100, SE = 0.030, z = 3.288, p < .01).
Table 3 presents the predicted probability for a group of children to have a low, average, or high intelligibility. As shown in this table, both the children with typical hearing and the children with early CIs have a very high probability of being highly intelligible at any age (probability of high intelligibility: 0.96 for the children with typical hearing and 0.80 for the children with early CIs). For the children with late CIs, however, age affects the predictions: it is not possible to predict if the intelligibility for this group will be low, average, or high at the age of eight years (probability of low intelligibility: 0.35, of average intelligibility: 0.22, of high intelligibility: 0.43). On the contrary, it is possible to predict that the younger children of this group will most likely have a low level of intelligibility (probability of low intelligibility: 0.86 at six years and 0.64 at seven years), and older children a high level of intelligibility (probability of high intelligibility: 0.72 at nine years), approaching that of the group of children with early CIs.
Predicted probabilities of intelligible speech in children (Probability higher than 0.50 in bold)

The last goal of our study was to understand if listeners’ expertise influences the perception of intelligibility. Figure 1 shows that both groups (Experts and Naive listeners) give overall similar scores. This is confirmed statistically, since listeners’ expertise was not selected as a pertinent covariate (i.e., with a potentially significant effect) to model the data, as previously explained in the ‘Method’ section.
Scores (in percent) for each group of listeners (Expert vs. naIve listeners).

The familiarity of expert listeners with various types of pathological speech neither leads to a harsher judgement of intelligibility nor does it help them to have a better understanding of variation in the less intelligible children's speech production than naive listeners.
Discussion
This study investigated the long-term outcomes of pediatric cochlear implantation on the intelligibility of speech. It focused on the factors at play when producing (i.e., hearing abilities, age factors) or perceiving (i.e., listeners’ expertise) intelligible speech.
Our results show that, even though children with a cochlear implant have gained in intelligibility several years after the implantation, their intelligibility is not as high as that of children with typical hearing. Indeed, from six to eleven years of age, extracts of their connected speech are perceived as intelligible, but even the level of the most intelligible children with CIs remains below that of children with typical hearing.
Age at implantation plays a part in achieving intelligibility: children who have received an implant before the age of two years are significantly more intelligible than children with a later age at implantation. This benefit of early implantation on intelligibility is consistent with the results of previous studies with younger and older children (Svirsky et al., Reference Svirsky, Chin and Jester2007; Habib et al., Reference Habib, Waltzman, Tajudeen and Svirsky2010; Calmels et al., Reference Calmels, Saliba, Wanna, Cochard, Fillaux, Deguine and Fraysse2004; Montag et al., Reference Montag, AuBuchon, Pisoni and Kronenberger2014). Our results for the children with late CIs are also comparable to Blamey et al. (Reference Blamey, Barry, Bow, Sarant, Paatsch and Wales2001), who found no effect of age at implantation in children implanted between two and five years of age, with Flipsen and Colvard (Reference Flipsen and Colvard2006) on younger children with CIs, who found no effect of age at implantation in children aged four to seven with late CI, or Khwaileh and Flipsen (Reference Khwaileh and Flipsen2010), who found no effect of age at implantation in four- to eleven-year-old children with late CI implantation.
Our results show that chronological age has a different effect on children with CIs, depending on their age at implantation: we find a positive effect of chronological age in children with late implantation (after 24 months), but no effect in children with early implantation. This last result is probably due to a ceiling effect, with high intelligibility scores for children with early CIs at all ages. Our results are in line with Flipsen and Colvard (Reference Flipsen and Colvard2006), who showed effects of chronological age in three- to six-year-old children implanted at age 3;9 as a mean, and with Habib et al. (Reference Habib, Waltzman, Tajudeen and Svirsky2010), who found differential effects of chronological age for children with early vs. late implantation. Khwaileh and Flipsen (Reference Khwaileh and Flipsen2010), by contrast, did not find effects of chronological age in their study on children aged four to eleven with late implantation.
Chronological age is not affecting the intelligibility of the children with typical hearing and the children with early implantation, but it is affecting that of children with late implantation. It could be argued that young children with typical hearing and children with early implantation have developed language and speech abilities early on, which helps them be intelligible at an early age (before six years), but that children with late implantation have a similar but longer acquisition trajectory, due to a later access to audio information and oral communication. This is in line with previous work about trajectories in language and speech acquisition following cochlear implantation, using intelligibility and other measures of speech or language abilities (e.g., Pisoni, Cleary, Geers, & Tobey, Reference Pisoni, Cleary, Geers and Tobey1999; Moreno-Torres, Madrid-Cánovas, & Blanco-Montanez, Reference Moreno-Torres, Madrid-Cánovas and Blanco-Montanez2016). Further explorations in younger children (before the age of five) could help us understand when the speech of children with typical hearing and children with early implantation becomes intelligible (i.e., when their probability to receive grades 5 to 7 is higher than 0.50). Similarly, studying intelligibility in older children with CIs would give more details on the evolution of intelligibility in children: Have children with early CI reached their highest level of intelligibility or did they reach a plateau in a still-evolving process of language acquisition? We were not able to study the effects of hearing age on intelligibility due to the intra-group homogenous profiles of the two groups of children with CIs. Comparing intelligibility in two groups of children with early and late implantation with variable lengths of device use could help us to understand to what extent hearing age has an effect on intelligibility in both groups of children.
Finally, our study shows that the listeners’ expertise does not impact their perception of the children's intelligibility, since judgements by expert and naive listeners were not significantly different.
To sum up, our study provides indications about the long-term outcomes of cochlear implantation for speech intelligibility, and about which factors can predict a good level of intelligibility in children with CIs: (1) good intelligibility is expected more than two years after the implantation, yet remains lower than that of children with typical hearing; (2) early implantation (i.e., before two years of age) is a predictor of a good level of intelligibility; (3) late implantation (i.e., after two years of age) will most likely lead to a delayed pattern in speech intelligibility when compared to early implantation; and (4) after the age of eight years, children with late CI begin to catch up with their peers with early CI.
Further work will need to address the limitations of the current study: larger groups of children should be included, children with CIs should be compared to a group of children with typical hearing matched on linguistic age, and a longitudinal study of intelligibility would be helpful to understand the evolution of intelligibility in children with CIs.
Acknowledgements
This work was supported by a doctoral grant awarded to the first author (Région Rhône-Alpes ARC2 grant). We thank all adult participants, and all children participants and their parents, who allowed us to record them. We also thank the associate editor, Dr Elma Blom, and the anonymous reviewers for their comments on an earlier version of this paper.