1 Introduction
Our aim in this paper and its accompanying paper, Hariyanto et al. (Reference Hariyanto, Dickson and Pitt2014b), referred to as Paper II, is to develop a method to estimate the probability of transition at individual ages between disability states as defined in the Survey of Disability, Ageing and Carers (SDAC) produced by the Australian Bureau of Statistics (ABS). In particular, our study is part of a wider project on reverse mortgages, and consequently we are interested in transition probabilities at older ages. A method for estimating transition probabilities was presented by Rickayzen and Walsh (Reference Rickayzen and Walsh2002), and this method was applied by Leung (Reference Leung2004) in the Australian context. In each of these papers, the data for estimation is a single set of disability prevalence rates. The main contribution of this study is that we show how data from successive surveys can be used to estimate transition probabilities. We use Rickayzen and Walsh's approach as a starting point, then refine these estimates by applying data on prevalence rates from a subsequent survey.
The approach adopted in this paper utilises the disability data from both the 1998 SDAC and the 2003 SDAC, and employs an Iterative Proportional Fitting (IPF) procedure. Fundamental to our estimation is the apparent stability of disability prevalence rates over two decades. Given this stability, we can linearly interpolate the disability prevalence rates reported in the 1998 and 2003 surveys to estimate the prevalence rates in years 1999 to 2002. Applying these prevalence rates to the estimated resident population (ERP) of Australia in the relevant years, we obtain our estimate of the disabled population in years 1998 to 2003. We then apply the IPF procedure to the estimated disabled population in pairs of successive years (i.e. 1998 and 1999, etc) to estimate one-year longitudinal disability data. The idea of the procedure is to model the disability state of an individual in two subsequent years using a log-linear model. The row category represents the disability state at the base year while the column category represents the state at the following year. The interaction between row and column categories is estimated from initial disability transition probabilities calculated using the approach of Leung (Reference Leung2004). The procedure involves projecting the disabled population in the middle of a given year to the middle of the next year using the initial disability transition probabilities, and then adjusting the projection such that it satisfies the age structure of the disabled population at the middle of the next year. The results of the procedure are our estimates of one-year longitudinal disability data. From these longitudinal data, the refined estimates of one-year disability transition probabilities are determined. Following that, we graduate the estimated (refined) transition probabilities to obtain the final estimates of transition probabilities. Figure 1.1 presents the overall steps of the estimation of disability transition probabilities. In this paper, we present the analysis of steps 1 and 2, while in Paper II, we present the analysis of steps 3 to 5.
Estimation steps of disability transition probabilities.

We can summarise the steps in Figure 1.1 as follows.
1. Estimation of initial disability transition probabilities by implementing the multiple state model to disability prevalence rates data reported in the 2003 SDAC.
2. Estimation of the numbers of individuals in different disability categories at annual intervals from 1998 to 2003.
3. Estimation of one-year longitudinal disability data under the IPF procedure.
4. Improvement (refinement) of estimates of disability transition probabilities.
5. Graduation of the refined estimates of disability transition probabilities.
2 Importance of Estimating Disability Rates
Australia and many other developed nations have been witnessing an increase in life expectancy and, at the same time, declining birth rates. Both of these factors will lead to an increase, over time, in the proportion of the population who are classified as elderly. Based on the Intergenerational Report 2010 (Treasury, 2010), produced by the Commonwealth Government of Australia, the proportion of the population aged 85 and above is expected to increase from 1.8% in 2010 to 5.1% in 2050. This ageing presents a challenge for the provision of aged care services and for formulating suitable funding mechanisms to support the increased need for such care. Several commentators suggest that the current funding system is unlikely to be sustainable and the current aged care services will not be able to deliver the quantity and quality of aged care needed in the future (Access Economics (2010), Australian Institute of Health and Welfare (AIHW) (2007)).
To deal with this funding problem, various alternative funding mechanisms have been suggested. These include increases to the rates of taxation, use of long term care (LTC) insurance, sale of reverse mortgages (RM), implementation of voluntary incentivised healthy ageing saving accounts and a voucher system (Access Economics, 2010). Determination of the appropriate funding model is difficult, in part due to the uncertainty of future aged care costs. In addition, there are difficulties in the pricing of LTC insurance and RM. This high level of uncertainty will lead to higher margins in LTC insurance premiums or, in the case of RM, higher levels of interest charged on outstanding balances. In turn this limits the effectiveness of these instruments in meeting their policy objectives. On the supply side, uncertainty in the magnitude and the type of aged care (high care needed for those who have higher levels of disability or low care needed for those with more mild levels of disability) that will be needed in the future creates difficulty when planning for the increased levels of aged care that will inevitably be required.
Accurate estimation of the probability of lives being disabled and the extent to which they are disabled are essential inputs to funding models for the provision of aged care and are therefore of great significance. On the funding side, reliable estimates of disability prevalence rates result in more accurate estimates of future aged care costs, which in turn will help in determining the appropriate funding mechanism. In addition, this will reduce the uncertainty associated with the pricing of LTC or RM and hence lower premiums or interest that will need to be charged on these products. On the supply side, a better estimate of the magnitude of demand for aged care and the type of care needed will allow more accurate planning for the provision of this care.
3 Data
There are a number of datasets which can be used to analyse transition probabilities between disability categories. These include a statistical overview of residential aged care (AIHW (2009)), a national disability survey (SDAC), and various local longitudinal surveys which measure both disability and aged care home use. In addition, one might want to consider large scale overseas longitudinal data (for example the National Long Term Care Survey in the U.S.).
For this paper we have chosen to use the SDAC data. This Australia-wide cross sectional disability survey is preferred over regional longitudinal data. This is because national experience might differ from regional experience and so the SDAC data are likely to give a more accurate representation of national trends in disability rates. Overseas longitudinal data, although representative of national experience, are likely to be of limited use as overseas data might not be comparable to Australian data. There are many reasons for differences between disability rates in different countries including differing aged care policy, disability experience, survey methods or different definitions of disability.
SDAC is a national disability survey conducted by the ABS at five-yearly intervals. The survey collects information from people with a disability, from older people and from their carers. Information on ability to perform core activities related to communication, mobility and self care is collected. A difficulty in performing one of these core activities is called a core activity limitation (CAL). Four levels of CAL are measured in the survey. In increasing order of disability, these CAL levels are mild, moderate, severe and profound. See ABS (2004a) for a full description of each of these disability levels. Analysis in this paper uses these four levels of disability as states in a multiple state model between which lives can transition.
Given that we have chosen to use cross sectional disability data, in the next section we review research related to the estimation of disability rates using cross sectional data.
3.1 Literature Review on Disability Modelling and Justification for the Chosen Model
Estimation of transition probabilities across disability states in a multiple state model ideally requires the total number of transitions between (disability) states, timing of the transitions, as well as total exposure for each state. If such data were available (and their amount was sufficiently large), we would be able to estimate transition intensities directly from the data and in turn the transition probabilities could be estimated. However, in practice, at best only longitudinal data are available. Longitudinal data, which record the disability status of an individual at two points in time, only allow a direct estimation of transition probabilities for a discrete time interval where the interval is dictated by the timing of each of the two consecutive surveys. As for Australia, the suitable data at a national scale are even less ideal as only cross sectional data are available. Cross sectional data, which are less informative than longitudinal data, measure the disability status of an individual only at one point in time.
Papers which present a method for estimating the probability of disablement using cross sectional data include Nuttall et al (Reference Nuttall, Blackwood, Bussell, Cliff, Cornall, Cowley, Gatenby and Webber1994), Brelivet et al (Reference Brelivet, Barker, Hancock, Parker, Spiers and Jagger2001), Davis et al (Reference Davis, Heathcote, O'Neill and Puza2002), Rickayzen and Walsh (Reference Rickayzen and Walsh2002), Alegre et al (Reference Alegre, Pociello, Pons, Sarrasi and Varea2004), Leung (Reference Leung2004, Reference Leung2006), and Albarran et al (Reference Albarran, Ayuso, Guillén and Monteverde2005). In the following we briefly review the modelling approaches from these papers and provide justification for the methodology adopted in this paper.
Nuttall et al (Reference Nuttall, Blackwood, Bussell, Cliff, Cornall, Cowley, Gatenby and Webber1994) estimated disability incidence rates by employing a multiple state model with three states: healthy, disabled and dead. They showed that by assuming the absence of recovery from the disabled state, the disability incidence rates in the model can be estimated from the disability prevalence rates and the mortality rates of the disabled. Albarran et al (Reference Albarran, Ayuso, Guillén and Monteverde2005) further showed that under the same multiple state model and assumptions as Nuttall et al (Reference Nuttall, Blackwood, Bussell, Cliff, Cornall, Cowley, Gatenby and Webber1994), the transition probability to the disabled state can be estimated from the disability prevalence rates and the population mortality rates.
Alegre et al (Reference Alegre, Pociello, Pons, Sarrasi and Varea2004) analysed a multiple state model with four disability states (including healthy), assuming the absence of recovery from the disabled states. They further assumed that the death probabilities of each state can be obtained by applying a loading (or discount) to the population death probabilities, and the transition probabilities from each disabled state can also be obtained by applying a loading to transition probabilities from the healthy state. They showed that under these assumptions, the transition probabilities in the model can be estimated from the prevalence rates of each disability state and the assumed values of the loadings.
Brelivet et al (Reference Brelivet, Barker, Hancock, Parker, Spiers and Jagger2001) estimated the transition probability to the disabled state by following a cohort in two consecutive cross sectional surveys. This method requires estimates of mortality rates of lives who are independent, dependent and living in the community, and those who are living in residential care (who are assumed to be dependent). This method also assumes the absence of both recovery from dependence and exits from residential care.
Davis et al (Reference Davis, Heathcote, O'Neill and Puza2002) estimated a so called marginal disability transition probability defined as the probability of becoming disabled at a later age conditional on being alive at a base age. The probability is estimated from the ABS disability survey data in 1981, 1988, 1993 and 1998. The estimation employed a multinomial modelling distribution. From the estimated probability, current and cohort health expectancies are calculated.
Rickayzen and Walsh (Reference Rickayzen and Walsh2002) built functional forms for transition probabilities to a lower disability state in a multiple state model. Under a stationary population hypothesis, parameters of the functional forms are chosen to closely replicate the observed disability prevalence rates. Leung (Reference Leung2004) applied Rickayzen and Walsh's modelling framework to project the cost of LTC in Australia, with a slight modification to the functional forms of the transition probabilities to adapt the model to Australian data. Leung (Reference Leung2006) presented a methodology to graduate transition intensities and calculate transition probabilities for the multiple state model to price and reserve for a LTC insurance contract.
In this paper we adopt a similar modelling framework to Rickayzen and Walsh (Reference Rickayzen and Walsh2002) and Leung (Reference Leung2004). This modelling framework is preferred as it offers greater flexibility and realism. This is because the model can be easily altered to include any number of disability states and relevant information can be easily incorporated into the various aspects of the modelling. There are several differences in our implementation of the model as compared with Leung (Reference Leung2004) as we have a different orientation. Firstly, we present a minor improvement in the fitting process to enhance the realism of the modelling framework. This involves allowing the population, which was assumed to be stationary in Leung (Reference Leung2004), to vary in line with ABS population statistics. Secondly, we cover only persons aged 25 years and over as opposed to Leung (Reference Leung2004) who considered persons at all ages. While our focus is on the transitions between states of disability for lives aged 60 and above, we find that trends in disability rates over the ages from 25 to 60 are a useful input to the calculation of these older age transition probabilities. It was not necessary, given our ultimate objective of understanding disability rates for people post retirement age, to consider rates across the entire span of ages.
4 Main Tools (Models)
In this section we introduce the main models that we subsequently use. Sections 4.1 and 4.2 introduce the Log-Linear Model and the Iterative Proportional Fitting algorithm, respectively, which we apply in Section 5 of Paper II. In Section 4.3, we introduce the multiple state model, give formulae for transition probabilities, and estimate parameters of these formulae. This is Step 1 in Figure 1.1.
4.1 Log-Linear Model
In this section we follow the methods described by Bishop et al (Reference Bishop, Fienberg and Holland2007). Suppose we have a single sample of size N which forms a rectangular array with I rows and J columns, corresponding to the I categories of variable 1 and J categories of variable 2. We use the following notation:
Xij : random variable for the count in cell (i, j), with observed value xij.
pij : probability of an observation falling into cell (i, j), with maximum likelihood estimate (MLE)  $$$ \hat{p}_{{ij}}^{{MLE}} $$$
.
mij = Npij = E(Xij) : expected value of Xij, with MLE  $$$ \hat{m}_{{ij}}^{{MLE}} $$$
.
Now since  $$$ \mathop{\sum}\nolimits_{i,j} {\hat{p}_{{ij}}^{{MLE}} } \, = \,1 $$$
we have
 $$$ \mathop{\sum}\nolimits_{i,j} {\hat{m}_{{ij}}^{{MLE}} } \, = \,N $$$
. As a convention, the sum over a subscript is denoted by replacing the subscript by “+”, so for example
 $$$ {{x}_{i + }}\, = \,\mathop{\sum}\nolimits_{j\, = \,1}^J {{{x}_{ij}}} $$$
for i = 1, 2, …, I.
The saturated log-linear model is defined as
 $${\rm{log}}{{m}_{ij}}\, = \,{{l}_{ij}}\, = \,u\, + \,\mathop{\sum}\limits_{x\, = \,1}^I {{i}_{\{ x\} }}{{u}_{1(x)}}\, + \,\mathop{\sum}\limits_{y\, = \,1}^J {{j}_{\{ y\} }}{{u}_{2(y)}}\, + \,\mathop{\sum}\limits_{x\, = \,1}^I \mathop{\sum}\limits_{y\, = \,1}^J {{i}_{\{ x\} }}{{j}_{\{ y\} }}{{u}_{12(xy)}}$$
for i = 1, 2, …, I and j = 1, 2, …, J, where u, u 1(i ), u 2(j ) and u 12(ij ) are parameters,
 $$\matrix{ {{{i}_{\{ x\} }}\, = \,\left\{ {\matrix{ 1 \hfill & : \hfill & {x\, = \,i,} \hfill \cr 0 \hfill & : \hfill & {{\rm{otherwise}}} \hfill \\\end} \right} & \quad {\rm and} & \quad {{{j}_{\{ y\} }}\, = \,\left\{ {\matrix{ 1 \hfill & : \hfill & {y\, = \,j,} \hfill \cr 0 \hfill & : \hfill & {{\rm{otherwise}}.} \hfill \\\end} \right} \\\end$$
The following constraints are applied to the parameters:
 $$\mathop{\sum}\limits_i {{u}_{{\rm{1(}}i{\rm{)}}}}\, = \,\mathop{\sum}\limits_j {{u}_{{\rm{2(}}j{\rm{)}}}}\, = \,\mathop{\sum}\limits_i {{u}_{{\rm{12(}}ij{\rm{)}}}}\, = \,\mathop{\sum}\limits_j {{u}_{{\rm{12(}}ij{\rm{)}}}}\, = \,{\rm{0}}.$$
The parameters are defined as
 $$$u\, = \,\frac{{l_{ + +} }}{{IJ}} $$$
: overall mean.
 $$${{u}_{{\rm{1}}(i)}}\, = \,\frac{{{{l}_{i + }}}}{J}\,{\rm{ - }}\,\frac{{l _{ + +} }}{{IJ}} $$$
: main effect of variable 1.
 $$${{u}_{{\rm{2}}(j)}}\, = \,\frac{{{{l}_{ + j}}}}{I}\,{\rm{ - }}\,\frac{{l _{ + +} }}{{IJ}} $$$
: main effect of variable 2.
 $$${{u}_{{\rm{12}}(ij)}}\, = \,{{l}_{ij}}\,{\rm{ - }}\,\frac{{{{l}_{i + }}}}{J}\,{\rm{ - }}\,\frac{{{{l}_{ + j}}}}{I}\, + \,\frac{{l _{ + +} }}{{IJ}} $$$
: two factor interaction effect between the two variables.
Due to constraint (4.1), the number of independent parameters (I × J) is equal to the number of cells.
Each u-term can be expressed as a function of cross product ratios under different arrangements of the contingency table (see Bishop et al (Reference Bishop, Fienberg and Holland2007)); in particular, the terms u 12(ij ) are direct functions of cross product ratios under a standard arrangement of the table. Hence, the terms u 12(ij ) capture the interaction pattern between variables 1 (row categories) and 2 (column categories). Note that independence between variables 1 and 2 implies that the terms u 12(ij ) are zero (since pij = p i+p+j under an independence model).
Under the saturated log-linear model the main effect of variable 1 is captured by the terms u 1(i ) while the main effect of variable 2 is captured by the terms u 2(j ). Further, the interaction between variables 1 and 2 (as measured by the cross product ratios under a standard arrangement of the contingency table) is captured by the terms u 12(ij ).
In our application, we fit the saturated log-linear model with the purpose of estimating all values in an I × J contingency table when only the marginal totals of the data are available. This is done by fitting a saturated log-linear model combining information from two different datasets: the incomplete dataset, containing only marginal totals and a second complete dataset containing observations for all I × J cells in the contingency table. The method assumes that the cross product ratios observed in the complete dataset are the same as the cross product ratios of the dataset that we try to estimate. By making this assumption, we estimate the values in the dataset for which only marginal totals are known by imposing the observed two-way interactions from our complete dataset to this incomplete dataset. In the following we describe the procedure along with the required algorithm (iterative proportional fitting) to fit the model.
4.2 Iterative Proportional Fitting Algorithm
We use the following notation.
• {xij} are the elements in dataset 1. Only row and column totals are observed here.
• {wij} are the elements in dataset 2. All elements are observed.
• Xij is the random variable associated with xij as the observed value (as defined in Section 4.1); and similarly pij, mij and
 $$$ \hat{m}_{{ij}}^{{MLE}} $$$
are related to xij as defined in Section 4.1.
•
$$$ \hat{m}_{{ij}}^{{}} $$$
is an estimate of mij.


Note that by fitting a saturated log-linear model to {xij}, we have  $$$ \hat{m}_{{ij}}^{{MLE}} \, = \,{{x}_{ij}} $$$
.
Now suppose that we only have the values of xi + and x +j, and we want to estimate xij for i = 1, 2, …, I and j = 1, 2, …, J. In addition, suppose that we have wij for all i and j; and the cross product ratios of {wij} are assumed to be the same as the cross product ratios of {xij}.
Firstly, we present the results of Birch (Reference Birch1963) which state that for a given log-linear model the following apply
•
$$$ \left\{ {\hat{m}_{{ij}}^{{MLE}} } \right\} $$$
are unique and replicate the values of the sufficient statistics, and•
$$$ \left\{ {{{{\hat{m}}}_{ij}}} \right\} $$$
which replicate the values of the sufficient statistics are unique.


To fit a saturated log-linear model to {xij}, the sufficient statistics are xi +, x +j and the cross product ratios of {xij}. Specifically
• u is estimated from x ++,
• u 1(i ) are estimated from xi +,
• u 2(j ) are estimated from x +j, and
• u 12(ij ) are estimated from the cross product ratios of {xij}.
Note that since the cross product ratios of {wij} are assumed to be the same as the cross product ratios of {xij}, we have the sufficient statistics to fit the saturated log-linear model to {xij}.
We now describe the IPF algorithm which is used to estimate values in the incomplete dataset. Let  $$$ \left\{ {\hat{\hskip -2pt f \hskip 1pt}_{{ij}}^{{{\rm{(}}t{\rm{)}}}} } \right\} $$$
denote our estimate of {mij} at step t under the IPF procedure, so that
 $$$ \left\{ {\hat{\hskip -2pt f \hskip 1pt}_{{ij}}^{{{\rm{(0)}}}} } \right\} $$$
is the set of initial values. We set
 $$$ {\hat{\hskip -2pt f \hskip 1pt}_{{ij}}^{{{\rm{(0)}}}} \, = \,{{w}_{ij}} $$$
for i = 1, …, I and j = 1, …, J. Then we adjust
 $$$ \left\{ {\hat{\hskip -2pt f \hskip 1pt}_{{ij}}^{{{\rm{(0)}}}} } \right\} $$$
to fit successively to xi + and x +j. Fitting to xi + gives
 $$ {\hat{\hskip -2pt f \hskip 1pt}_{{ij}}^{{{\rm{(1)}}}} \, = \,{\hat{\hskip -2pt f \hskip 1pt}_{{ij}}^{{{\rm{(0)}}}} \frac{{{{x}_{i + }}}}{{\hat{\hskip -2pt f \hskip 1pt}_{{i + }}^{{{\rm{(0)}}}} }} $$
and subsequent fitting to x +j gives
 $${\hat{\hskip -2pt f \hskip 1pt}_{{ij}}^{{{\rm{(2)}}}} \, = \,{\hat{\hskip -2pt f \hskip 1pt}_{{ij}}^{{{\rm{(1)}}}} \frac{{{{x}_{ + j}}}}{{\hat{\hskip -2pt f \hskip 1pt}_{{ + j}}^{{{\rm{(1)}}}} }}.$$
We repeat this two step cycle until convergence to the desired accuracy is obtained. At convergence we have
 $$ {{\hat{\hskip -2pt f \hskip 1pt}}_{i + }}\, \approx \,{{x}_{i + }}\; \; {\rm{and}}\; \; {{\hat{\hskip -2pt f \hskip 1pt}}_{ + j}}\, \approx \,{{x}_{ + j}} $$
and the cross product ratios of  $$$ \left\{ {\hat{\hskip -2pt f \hskip 1pt}_{{ij}}^{{}} } \right\} $$$
are the same (to any degree of accuracy specified for convergence of the IPF algorithm) as the cross product ratios of {wij} (the final estimates retain the cross product ratios of the initial estimates). For a proof, see Bishop et al (Reference Bishop, Fienberg and Holland2007).
Since the cross product ratios of {wij} are the same as the cross product ratios of {xij}, we know from above that  $$$ {{\hat{\hskip -2pt f \hskip 1pt}}_{ij}}\, \approx \,\hat{m}_{{ij}}^{{MLE}} \, = \,{{x}_{ij}} $$$
.
In practice, there are likely to be differences between the cross product ratios of {wij} and {xij}. In addition, the xi + and x +j might not be exactly known. This results in a certain degree of estimation error.
4.3 Multiple State Model
4.3.1 Outline
Given our objective of deriving longitudinal data for a population of disabled lives, we need to determine transition probabilities between the various disability states. We do this within a multiple state modelling framework similar to Leung (Reference Leung2004). The multiple state modelling framework is implemented using more recent data than Leung; for details see Hariyanto (Reference Hariyanto2013).
The multiple state model used in the analysis is shown in Figure 4.1. From Figure 4.1, we see that there are three types of transition probabilities, all of which are taken to be annual probabilities: death probabilities, deterioration probabilities (probabilities of moving to any worse disability state) and improvement probabilities (probabilities of recovering to a less disabled state or the healthy state). Deterioration to any worse disability state is possible over the course of a year, while improvement is only allowed by one category. The transition probabilities are assumed to depend only on age, gender, year and disability category; no account is taken of how or when someone arrived in that category (i.e. we ignore duration and past disability experience). Note that we also assume that only one transition is possible over a one-year period.
Multiple state model.
Mathematical functions are used to formulate deterioration probabilities and the additional mortality due to disablement, while the likelihood of improvement is included as an assumption. Mortality rates for healthy lives are determined after disabled life mortality rates have been estimated so that overall population mortality rates are retained. In the next section we provide a brief description of the method used to fit parameters of our functions for transition probabilities between states of our multiple state model. The functions used and results of the fitting process are provided in subsequent sections.
4.3.2 Fitting Methodology
The objective of the fitting process is to estimate the parameters of the formulae for the probabilities of deterioration. The probabilities of death and of improvement in disability are determined separately and included as an input in the fitting process.
The deterioration probabilities are estimated such that the model replicates the prevalence rates reported in the 2003 SDAC. This is done under a stationary population model. Specifically, we assume that every year, the same number of lives aged 25 years (with constant disability prevalence rates) enter the population. This population of 25 year old lives is projected until age 109 under the initial assumed transition probabilities. The parameters of the deterioration probability formulae are then estimated such that the prevalence rates of the stationary population replicate (as closely as possible) the reported prevalence rates in the 2003 SDAC.
Note that from the implementation of the multiple state model we have estimates of disabled population at a single age for each disability category, and disability transition probabilities.
4.3.3 Mathematical Formulae
In the following we briefly describe the formulae used for transition probabilities. For a fuller description see Rickayzen and Walsh (Reference Rickayzen and Walsh2002) or Leung (Reference Leung2004).
Mortality Formulae
We model mortality rates as being higher for people in a more severe disability category and, to reflect this, we split the mortality rate which applies to an individual in state n (n = 0, 1, …, 4) into two parts. The first part applies equally to people in any disability state, while the second is higher for more severely disabled people. Specifically:
 $$Mortality{\rm{(}}x\, + \,{\rm{0}}{\rm{.5}},\,n{\rm{)}}\, = \,Overall\_Mort{\rm{(}}x\, + \,{\rm{0}}{\rm{.5)}}\, + \,Additional\_Mort{\rm{(}}x\, + \,{\rm{0}}{\rm{.5,}}\,n{\rm{)}}$$
where
Mortality(x + 0.5, n) is the one-year death probability which applies to an individual aged x + 0.5 and in state n,
Overall_Mort(x + 0.5) is the component of the one-year death probability which applies to any individual aged x + 0.5 regardless of the severity of his/her disability (this component is also called healthy mortality),
Additional_Mort(x + 0.5, n) is additional annual mortality due to disability for an individual aged x + 0.5 and in state n.
Similar to Leung (Reference Leung2004), the formula for the additional annual mortality due to disability is expressed as (for n = 0, 1, …, 4):
 $$Additional\_Mort{\rm{(}}x\, + \,{\rm{0}}{\rm{.5,}}\,n{\rm{)}}\, = \,\frac{M}{{{\rm{1}}\,{\rm{ + }}\,{\rm{1}}{\rm{.}}{{{\rm{1}}}^{{\rm{50}}\,{\rm{ - }}\,{\rm{(x}}\,{\rm{ + }}\,{\rm{0}}{\rm{.5)}}}} }}\,\times \,\frac{{{\rm{max(}}n\,{\rm{ - }}\,{\rm{2,0)}}}}{{\rm{2}}}$$
where M is the maximum additional annual mortality due to disability.
Due to limited information on disabled life mortality in Australia, the values of M are estimated starting from the experience of private LTC plans in the U.S.; see Corliss et al (Reference Corliss, Gagne, Koklefsky, Lucas, Oberman-Smith, Purushotham, Cavanaugh, Crawford and Luff2007). Based on differences in the prevalence of leading causes of death in the Australian population with profound CAL and the customers of private LTC plans, we chose values of M of 0.11 for males and 0.08 for females. The level of overall mortality is then determined as an input to the process determined so that the mortality rates applying to the healthy and all disabled categories in aggregate match the mortality rates presented in the Australian life tables for the period 2002–2004 (ABS, 2008).
Deterioration Probabilities
There are two types of deterioration that we need to consider. First, lives can deteriorate from the healthy state into one of the disabled states. Second, lives in one of the disabled states can move to a higher level of disability. We first propose formulae for deterioration probabilities relating to a healthy person making a transition into a particular CAL state over one year given that he/she survives. This probability is split into two parts: the probability of a healthy person becoming disabled (attaining any CAL state) over the year and the probability of a healthy person attaining a particular CAL state given that he/she became disabled over the year. The probability of a disabled person making a transition into a more severe CAL state is then obtained by applying a multiplier (deterioration factor) to the probability of a healthy person making a transition into that particular more severe CAL state. The formulae are the same for males and females and are the same as those in Leung (Reference Leung2004).
The formula for the probability that a healthy person aged x makes a transition into any CAL state over one year is:
 $$New\_CAL{\rm{(}}x{\rm{)}}\, = \,\alpha \left\{ {\left( {A\, + \,\frac{{D\,{\rm{ - }}\,A}}{{{\rm{1}}\, + \,{{B}^{C\,{\rm{ - }}\,x}} }}} \right)\,\times \,\left( {{\rm{1}}\,{\rm{ - }}\,\frac{{\rm{1}}}{{\rm{3}}} {\rm exp }\left\{ {{\rm{ - }}{{{\left( {\frac{{x\,{\rm{ - }}\,E}}{4}} \right)}}^{\rm{2}}} } \right\}} \right)} \right\}$$
where the six parameters are A, B, C, D, E and α.
Table 4.1 presents the estimated values of the parameters in (4.4). The parameter values presented in Tables 4.1 and 4.2 are obtained by fitting the model to the 2003 SDAC data.
Parameter values for New_CAL(x).

Parameter values for Severity(x, n).

The formula for the probability that a healthy person aged x makes a transition into disability state  $$$ n\,{\rm{(1}}\,\leq \,n\,\leq \,{\rm{4)}} $$$
given that he/she becomes disabled over the year is:
 $$Severity{\rm{(}}x,n{\rm{)}}\, = \,\frac{{W{\rm{(}}n{\rm{)}}\,\times \,f{{{{\rm{(}}x{\rm{)}}}}^{n\,{\rm{ - }}\,{\rm{1}}}} }}{{\mathop{\sum}\nolimits_{n\, = \,{\rm{1}}}^{\rm{4}} {W{\rm{(}}n{\rm{)}}\,\times \,f{{{{\rm{(}}x{\rm{)}}}}^{n\,{\rm{ - }}\,{\rm{1}}}} } }},$$
where
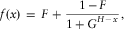 $$ f{\rm{(}}x{\rm{)}}\, = \,F\, + \,\frac{{{\rm{1}}\,{\rm{ - }}\,F}}{{{\rm{1}}\,{\rm{ + }}\,{{G}^{H\,{\rm{ - }}\,x}} }}, $$
and F, G, H, W(1), W(2), W(3) and W(4) are parameters.
The estimated values of parameters for Severity(x, n) for males and females are presented in Table 4.2.
Finally, the probability of a healthy individual aged x making a transition into disability category  $$$ n\,{\rm{(1}}\,\leq \,n\,\leq \,{\rm{4)}} $$$
over one year is:
 $$Deteriorate{\rm{(}}x,{\rm{0}},n{\rm{)}}\, = \,New\_CAL{\rm{(}}x{\rm{)}}\,{\rm{\times }}\,Severity{\rm{(}}x,n{\rm{)}}{\rm{.}}$$
The probability of an individual in disability category m (1 ≤ m ≤ 3) deteriorating to disability category n (m < n ≤ 4) is:
 $$ Deteriorate{\rm{(}}x,m,n{\rm{)}}\, = \,Deteriorate{\rm{(}}x,{\rm{0}},n{\rm{)}}\,{\rm{\times }}\,{{I}^m} . $$
The estimated values of I are 1.524242 for males and 1.685492 for females.
Improvements
As in Leung (Reference Leung2004), we assume that people in any CAL state can only improve by one category over a one-year interval if and only if they survive the year and do not deteriorate to a more severe disability state. We also assume that the recovery rates (conditional on survival and non-deterioration of disability) are age and gender invariant.
Recoveries from mild and moderate CAL are estimated from the experience reported in The Australian Longitudinal Study of Ageing; see Giles et al (Reference Giles, Metcalf, Glonek, Luszcz and Andrews2004). Our starting point for recovery probabilities from profound CAL was the experience of the private LTC plan in the U.S. (Corliss et al (Reference Corliss, Gagne, Koklefsky, Lucas, Oberman-Smith, Purushotham, Cavanaugh, Crawford and Luff2007)), which suggests a rate around 13%. We have chosen a lower rate of 10%, reflecting the fact that we are interested in the entire Australian population rather than an insured population. The recovery rate from severe CAL has been set between the rates for moderate and profound CAL. The annual recovery rates determined from this process are presented in Table 4.3.
Annual recovery assumption in the multiple state model.

Recall that the fitting process involves projection of a stationary population which is then matched to the disability prevalence rates in the 2003 SDAC. It is therefore useful to define the following probabilities.
 $$$ Deteriorate\_From{\rm{(}}x\, + \,{\rm{0}}{\rm{.5,}}\,m{\rm{)}} $$$
represents the probability that a person aged x + 0.5 and in state m makes a transition to any more severe disability state within one year given that he/she survives during the year. Therefore
 $$ Deteriorate\_From{\rm{(}}x\, + \,{\rm{0}}{\rm{.5,}}\,m{\rm{)}}\,{\rm{ = }}\,\mathop{\sum}\limits_{n\, = \,m\, + \,{\rm{1}}}^{\rm{4}} Deteriorate{\rm{(}}x\, + \,{\rm{0}}{\rm{.5,}}m,n{\rm{)}}{\rm{.}} $$
Improve_From(x + 0.5, n) is the probability that a person aged x + 0.5 and in disability state n (n = 1, 2, …, 4)) who survives and does not deteriorate over one year, improves by one state during the year. For reasons described in Hariyanto (Reference Hariyanto2013), we set:
 $$Improve\_From{\rm{(}}x\, + \,{\rm{0}}{\rm{.5}},n{\rm{)}}\, = \,\left\{ {\matrix{ \hfill{{\rm{0}}{\rm{.1}}} &#x0026; \hfill : &#x0026; \hfill {n\,{\rm{ = }}\,{\rm{4,}}} \cr \hfill {{\rm{0}}{\rm{.125}}} &#x0026; \hfill : &#x0026; \hfill {n\,{\rm{ = }}\,{\rm{3,}}} \cr \hfill {{\rm{0}}{\rm{.15}}} &#x0026; \hfill : &#x0026; \hfill {n\,{\rm{ = }}\,{\rm{1,2}}{\rm{.}}} \\\end \right$$
Figure 4.2 presents some estimated transition probabilities from the implementation of the multiple state model with the 2003 SDAC data.
One-year transition probabilities from able (no CAL) state.
5 Estimation of the Disabled Population at Each Mid-Year
In this section we consider Step 2 from Figure 1.1, i.e. we consider the number of individuals in different disability categories at different ages.
We used data published by the ABS. Specifically, we have
• an estimate of ERP at the middle of each calendar year, by gender, for each year of age up to 99, with grouped data for age 100 and above (ABS (2009)), and
• disability prevalence rates from the 1998 SDAC and the 2003 SDAC, by gender, and in age groups 60–64, 65–69, …, with a grouping 85+ in the 1998 SDAC and 90+ in the 2003 SDAC.
A key assumption is that these prevalence rates are applicable in the middle of the appropriate years. We view this as reasonable since the 1998 SDAC was conducted from March to May 1998 and the 2003 SDAC was conducted from June to November 2003.
We apply these rates to the ERP to estimate the disabled population mid–1998 and mid–2003. The prevalence rates for years 1999 to 2002 (at the middle of each year) are interpolated from the prevalence rates presented in these two surveys. Unfortunately, the SDAC disability prevalence rates are only provided for groups of ages, and we need to estimate the disabled population at single ages. To do this we suggest two approaches, both based on interpolation.
(a) Estimate the prevalence rates at single ages at years 1998 and 2003, and then interpolate these single age prevalence rates from 1999 to 2002.
(b) Interpolate the age group prevalence rates from 1999 to 2002. The disabled population at a single age will be estimated from the age group total.
We opt for approach (b) as the prevalence rate at a single age is likely to have a much higher fluctuation annually than the age group prevalence rate. Before considering interpolation methods, we address a problem related to the reported prevalence in the surveys which is significant for the analysis in this paper.
5.1 Disability Prevalence Rates at High Ages
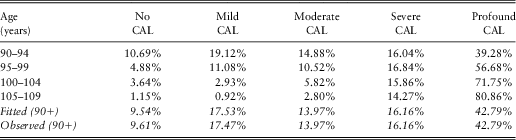
In the SDAC, disability prevalence rates of the very old are reported for a very wide age interval (85+ for the 1998 survey and 90+ for the 2003 survey). This could mask the dynamics of the disability process at high ages where the progression of disablement is the most significant. In our application, this could result in inaccurate estimates of longitudinal disability data for the very old. To remedy this problem, we estimate disability prevalence rates of the very old at narrower age bands (namely 85–89, 90–94, …, 105–109). These estimates are obtained by implementing the multiple state model described in Section 4.3 separately for 1998 and 2003.
In implementing this model to the 1998 survey data, we adopt similar recovery rates and additional mortality (due to disability) assumptions as described in Section 4.3. We use the ERP (ABS (2009)) at the middle of 1998 to estimate the population at single ages at the survey date and the Australian life tables for the period 1997–1999 (ABS, 2008) to determine the total number of deaths across disability categories in the fitting process.
For the purpose of estimation of longitudinal disability data, the estimated prevalence rates (at age groups 85–89, 90–94, …, 105–109) for some disability categories do not sufficiently replicate the reported overall prevalence rates of the very old. For disability categories for which this is the case, we alternatively estimate the prevalence rates under a parametric formula to satisfy the following criteria:
(a) closely replicate the reported overall disability prevalence rates of the very old,
(b) the progression across ages is similar to the progression of the prevalence rates estimated from the multiple state model,
(c) each value is between 0 and 1,
(d) the sum of the estimated prevalence rates across all disability categories (including healthy) in a given age group is one.
To determine a suitable parametric formula, we experimented with polynomials of order 2 to 6. Each disability category was considered separately (i.e. a different polynomial might be used to estimate different categories). We considered fitting the polynomial functions to all age groups and only to age groups 60–64 and above. Reported prevalence rates for age groups 80–84 and below are assumed to relate to the ages at the middle of the age groups. For (reported) prevalence rates of the very old, we experimented with the ages to which they related. Specifically, we considered ages around (and including) the weighted average age of the very old. The polynomials were fitted using ordinary least squares (OLS). From a given polynomial function, prevalence rates at age groups 85–89, 90–94, …, 105–109 were calculated by assuming that the prevalence rates of these age groups related to the weighted average age of the corresponding age group.
We only estimated the prevalence rate for each CAL state; the prevalence rate for the healthy state was set to be one minus the sum of the prevalence rates of all CAL states. This ensured that criterion (d) was satisfied.
For some polynomials, criterion (c) can be enforced by adding an assumed prevalence rate at age 110 in the fitting. The value of this assumed prevalence rate is either 0 or 1 depending on whether the initial estimated prevalence rate is above 1 or below 0. This procedure does not always work. For example, with the 2003 data for males, the prevalence rate for the mild disability category at age group 105–109 is negative. To adjust this negative prevalence rate, we calculated the ratio of the prevalence rates for each of the healthy and mild categories to the total prevalence rates of both the healthy and mild categories at age group 100–104. We applied this ratio to the total prevalence rates of these categories (healthy and mild) at age group 105–109 to derive the adjusted prevalence rates for the healthy and mild categories at this age group. The chosen polynomial formula was the one which best satisfied criteria (a) and (b). Note that due to the adopted adjustment procedure, criteria (c) and (d) were satisfied by every polynomial formula.
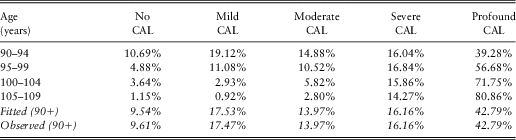
The estimated prevalence rates can be further adjusted using the IPF procedure. This is done by taking disability category as the column variable and age group as the row variable. Note that in a given age group (say 90–94), we can reliably estimate the total disabled population across disability categories (including healthy). This can be estimated from the ERP at the closest central date of the survey. In addition, in a given disability category, the total population of the very old is given by the survey. We multiply the estimated prevalence rates with the total population to derive the starting values for the IPF procedure. From the IPF procedure, we calculate our final estimate of disability prevalence rates. These are shown in Table 5.1 along with observed and fitted rates at ages 90 and above.
Estimated prevalence rates from the SDAC 2003, males (IPF adjusted).
5.2 Trend of Disability Prevalence Rates
Our methodology is based on the assumption that disability prevalence rates are stable over time. Although underlying disability prevalence rates are affected by many factors such as incidence rates of disability, recovery rates, age at onset and survival rates of people with disability (AIHW, 2003), recent reviews of the trends of disability prevalence rates (e.g. Davis et al (Reference Davis, Beer, Gligora and Thorn2001) and AIHW (2003 and 2008)) suggest that for ages 65 and above, overall disability prevalence rates have been roughly constant from 1988 to 2003 (see Table 8.1 of AIHW (2003) or Table 1 of AIHW (2008)). While there was a substantial increase in overall disability prevalence rates (for ages 65 and above) between the 1981 survey and the four later surveys, this was largely because of the increasing emphasis in the later surveys on ageing, rather than reflecting an actual increase of the underlying prevalence rates (AIHW, 2003).
Prevalence rates for each CAL category in the 1998 and 2003 surveys are presented in Figures 5.1 and 5.2 for males and females separately. While there are some fluctuations, in general, the prevalence rates across ages for each CAL category are similar between the two surveys.
Prevalence rates for each CAL category, males.
Prevalence rates for each CAL category, females.
5.3 Estimation of Age Group Prevalence Rates at Each Mid-Year
A possible method to estimate disability prevalence rates at the middle of each year from 1999 to 2002 is by modelling the disability status using a multinomial logit specification (see Waidmann and Liu (Reference Waidmann and Liu2000)). By including time (in years) as one of the covariates, disability prevalence rates at these mid-years can be estimated from the model. However, since we only have two observations (i.e. prevalence rates in 1998 and 2003) to estimate the time trend term, this method is not feasible. Due to the limited amount of available data and given the apparent stability of disability prevalence rates from 1988 to 2003, we use linear interpolation to estimate the prevalence rates in years 1999 to 2002.
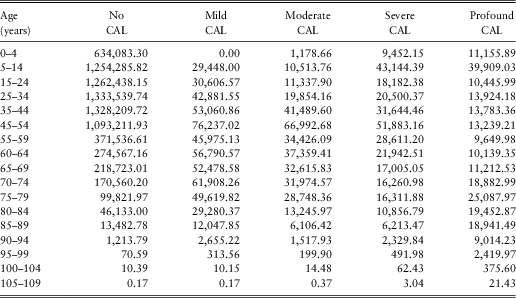
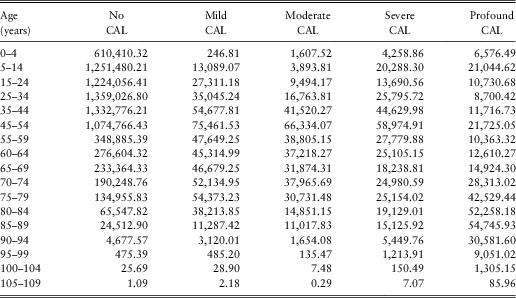
Multiplying the estimated prevalence rates by the ERP, we obtain our estimate of the disabled population at the middle of each year from 1998 to 2003. This estimate is obtained for all age groups and disability categories. The ERP at single ages for ages 100 and above is estimated by using functions from the Australian life table in the corresponding year published by The Human Mortality Database (www.mortality.org). Given our purpose of estimating transition probabilities, rounding of the estimates (to the nearer integer) is not necessary. Tables 5.2 and 5.3 present the disabled population estimates at year 2000.
Estimate of disabled population at the middle of year 2000, males.
Estimate of disabled population at the middle of year 2000, females.
5.4 Estimation of Disabled Population at Single Ages
There are a variety of methods to estimate the population at single ages from an age group total. These include estimation by employing a rectangular assumption, the prorating method, and graphic and parametric interpolation (see Siegel and Swanson (Reference Siegel and Swanson2004) for details). We applied parametric interpolation. The rectangular assumption is likely to result in inaccurate estimates at very high ages where probabilities of disablement are significant, while the prorating method is difficult to implement since there is no suitable information source to accurately estimate the age structure of the disabled population across the whole age range considered (60 and above). Note that it is unlikely that the age structure of the disabled population is similar to the age structure of the general population (the total population across disability categories) at this age range. Lastly, graphical analysis is also difficult to implement in our situation.
To implement parametric interpolation, there are two possible methods: midpoint and cumulation-differencing. Under the midpoint method, the average of the population in a given age group (i.e. the population in a given age group divided by the length of the age group) is assumed to relate to the age at the middle of the age group. By interpolating these values, the population at a single age is estimated. The shortcoming of this method (theoretically) is that the average of the population (in a given age group) seldom relates to the age at the middle of the age group. It is possible to instead consider the weighted average age; however, in our application, this is difficult to estimate since we do not know the age structure of the disabled population. Considering this, we adopt the cumulation-differencing method which is described below.
Let f(x) be a parametric function of x, let l(x) denote the observed number of the population aged x last birthday, and let L(x) denote the observed number of the population in age interval [0,x), so that
 $$l{\rm{(}}x{\rm{)}}\, = \,L{\rm{(}}x\, + \,{\rm{1)}}\,{\rm{ - }}\,L{\rm{(}}x{\rm{)}}.$$
For each disability category, the values of L(x) for x = 5, 15, …, 55, 60, …, 110 can be obtained from the estimated age group total (see Tables 5.2 and 5.3). Note that these values relate to the precise age at which they apply. We fit a parametric function f(x) to these values to estimate L(x) for, x = 60, 61, …, 110. From these estimates, we use (5.1) to estimate l(x) for, x = 60 61,…, 109. In implementing this method, we assume that the pattern of accumulation of the population over a five or ten year age interval is a good indicator of the pattern of accumulation at a single age interval.
In applying the cumulation-differencing method, we considered a variety of parametric functions, namely natural cubic spline, Karup-King, Sprague, Beers “Ordinary” and Beers “Modified”. Descriptions of each of the functions can be found in Siegel and Swanson (Reference Siegel and Swanson2004). These functions are commonly employed with the cumulation-differencing method in the estimation of a single year age distribution from five yearly or other regularly grouped demographic data (e.g. Bijak and Kupiszewska (Reference Bijak and Kupiszewska2008) and Smith et al (Reference Smith, Hyndman and Wood2004)).
The cumulation-differencing method has been applied to estimate the disabled population at a single year of age (l(x)) from the age group totals estimated in Section 5.3 by employing each of the above interpolation formulae (for convenience, these formulae are referred to as osculatory formulae). For each formula, the estimates were obtained for each disability category and each middle year from 1998 to 2003. These formulae, except Beers’ “Modified”, result in similar estimates. The reason for Beers’ “Modified” formula resulting in slightly different estimates is because this formula combines interpolation with some smoothing (which results in smoother interpolated values but does not replicate the given values). Figure 5.3 presents the estimates of l(x) for males in the profound category at the middle of year 2000.
Estimates of l(x) for profound CAL at the middle of year 2000, males.
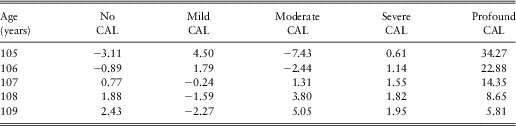
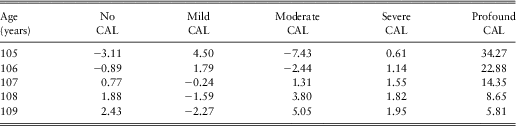
For some disability categories, the estimates of l(x) are negative for certain ages above 90. This problem occurs for all interpolation formulae considered. The reason for this is that as the number of disabled population (in a given disability category) decreases rapidly at high ages (see Tables 5.2 and 5.3), the slope of the curve of L(x) changes rapidly at these ages and this causes the interpolation curve to be non-monotonic (so that the differences of L(x) are negative). This problem is more prevalent for less severe disability categories than for more severe categories (severe and profound CAL) since, at high ages, the population in the less severe categories decreases more rapidly with age. Table 5.4 presents the estimates of l(x) for females at the middle of year 2000 under cubic splines. The estimates are presented for each disability category.
Estimate of l(x) at the middle of year 2000, females.
A similar problem has been encountered by Wilmoth (Reference Wilmoth2002) in the estimation of the number of deaths at a single age using cubic splines. Wilmoth (Reference Wilmoth2002) dealt with his problem by imposing a constraint on the slope of the spline function. More recently, Smith et al (Reference Smith, Hyndman and Wood2004) proposed the use of a ‘Hyman filter’ to ensure monotonicity of an interpolating cubic spline. This method has been applied by Smith et al (Reference Smith, Hyndman and Wood2004) to estimate the number of deaths at a single age with a satisfactory result.
To deal with negative estimates of l(x), we instead considered three alternative interpolation methods, which we call Methods (a) to (c). Method (a) was cumulation-differencing by employing an appropriate polynomial with a restriction such that the estimates of l(x) are non-negative. Estimation of the parameters of the polynomials with this restriction was done in R using the function “constrOptim.nl”; see Varadhan (Reference Varadhan2011). Method (b) was the same as Method (a) with further refinement by the prorating method. Under Method (b), the estimates under Method (a) are only used to estimate the age structure of the disabled population in a given age group. For example, suppose that under Method (a), we have 20% of the disabled population (in a given disability category) in age group 60–64 at age 60. Then, the estimate of the disabled population aged 60 (in the corresponding category) under Method (b) is 20% of the observed disabled population in the age group 60–64. Under Method (c), the estimates under Method (b) are further refined using the IPF procedure such that they satisfy the known age group totals for each disability category and the known ERP for each age. This was done by taking the disability category as the column variable and age as the row variable. Note that in a given disability category, the size of the disabled population for each age group is known. In addition, at a given age, the sum of the disabled population across disability categories (including healthy) is also known (which is the general population (ERP) at that age).
To compare the performance of the methods considered, we experimented with the ERP data. We summed the reported single-age distributions of ERP into five year age groups and estimated the ERP at a single age from these age groups under Methods (a), (b) and (c). We compared the estimates under each method with the reported single-age distributions of the ERP. We experimented with data from both genders and from each year from 1998 to 2003. In this experiment, Method (c) was implemented by taking year as the column category and age as the row category. We consider polynomials of orders 2 to 6, and OLS and WLS fitting methods. Conclusions from this experiment are:
• Method (c) results in the best estimate, while Method (b) performs better than Method (a). Therefore, implementation of prorating and the IPF procedure improves the accuracy of the estimates.
• Polynomials which result in accurate estimates after being refined with prorating and IPF procedures (Method (c)), typically, before being refined with these procedures, also result in an appropriate age structure. On the other hand, if the polynomial initially results in an inappropriate age structure (for example, increasing with age), the resulting estimates under Method (c) will also not be accurate.
Figure 5.4 illustrates the accuracy of Method (c) in estimating the single-age distributions of the ERP. The relative error is defined as the absolute value of the difference between the observed and the estimated values divided by the observed value. Note that the estimation of single-age distributions of disabled population (for each disability category) is a more difficult problem than the similar estimation of ERP especially for estimation at very high ages (disabled population, especially those in less severe categories, decreases more rapidly with age). Therefore, a similar level of accuracy of Method (c) in the estimation of the disabled population cannot be expected.
Absolute value of the relative error of the estimation.
Arguably, in the estimation of the single-age distributions of ERP, an accurate result under Method (c) requires a suitable estimate of the age and time (in years) interaction, while in the estimation of the disabled population, it instead requires a suitable estimate of the age and disability interaction. However, a suitable estimate of the age and disability interaction can be obtained from appropriate estimates of the disabled population at a single age for each disability category. Therefore, if Method (b) results in such estimates, the further refinement under the IPF procedure is also likely to increase the accuracy of these estimates.
Choosing a polynomial which is likely to result in accurate estimates is difficult. However, we are able to determine polynomials which are likely to result in poor estimates. These are polynomials which result in an inappropriate age structure (for example, an increasing age structure). After discarding such polynomials, the chosen polynomial is the one which best replicates the observed accumulated values.
In applying Method (c), we opt to keep the estimates under osculatory formulae up to age 89. This method is employed only to estimate the disabled population at ages 90 and above. This is because in another experiment with ERP data, we found that osculatory formulae consistently result in better estimates than ordinary polynomials (in the experiment, the estimates from the polynomials have been refined with the prorating method). The cutoff age 89 is chosen for convenience. There is little impact to the accuracy of the estimation associated with the chosen cutoff age as osculatory formulae do not perform very well at very high ages.
Estimates for ages 60 to 89 under osculatory formulae are also refined using the IPF procedure such that it satisfies both the known age group total for each disability category and the known ERP for each age (similar to Method (c)).
A further refinement in the estimation is possible by maintaining the continuity of the given osculatory curve with the chosen polynomial curve. The parameters of the chosen polynomial can be restricted such that its derivatives (up to a certain desired degree) at age 90 are equal to the derivatives of the osculatory curve at this age. We have experimented with this method with ERP data and decided not to employ this refinement. Under an appropriate polynomial, there is no additional gain in the accuracy of the estimation to compensate for the additional complexity of the fitting process under this refinement.
Estimates of the single-age distributions of the disabled population could also be obtained by implementing the multiple state model described in Section 4.3. We implemented this model to the disabled population at the middle of each year from 1998 to 2003 estimated in Section 5.3. The recovery rates and the additional mortality (due to disability) assumptions are as described in Section 4.3. ERP and Australian life tables at the relevant year (ABS, 2008) are used in the estimation. The estimates were also refined under the IPF procedure similar to Method (c). Due to the methodology of the estimation, the problem of the negative estimated values is not encountered for the estimation under the multiple state model.
To summarise, we have two sets of estimates of the single-age distribution of the disabled population:
1. Estimates under the cumulation-differencing method. For ages 60 to 89, the estimates are obtained under each of the osculatory formulae, while for ages 90 and above, the estimates are obtained under Method (c).
2. Estimates at all ages considered under the multiple state model.
Figures 5.5 and 5.6 present the estimates at the middle of year 2000 for males and females respectively. Note that the estimates for ages 90 and above using the osculatory formulae are obtained under Method (c).
Estimates of the single-age distributions (l(x)) of the disabled population at the middle of year 2000, males.
Estimates of the single-age distributions (l(x)) of the disabled population at the middle of year 2000, females.
Note that the final estimates of the disabled population (after IPF adjustment) under each of the osculatory formulae are very similar. In addition note that the final estimates of the disabled population under the multiple state model show an abrupt pattern which indicates its unsuitability. In the following we proceed from the estimated disabled population obtained using cubic splines (with the estimates for ages 90 and above obtained under Method (c)). Note that other osculatory formulae are also appropriate (Figures 5.5 and 5.6) and in fact they all result in very similar estimates of the crude transition probabilities.
6 Conclusion
In this paper, we have described the main tools (models) of our estimation: the log-linear model and the multiple state model. The mutiple state model has been implemented to the disability prevalence rates data from the SDAC 2003 to obtain the initial estimate of disability transition probabilities. In addition, the numbers of individuals in different disability categories at annual intervals from 1998 to 2003 have been estimated using prevalence rates data from the 1998 SDAC and the 2003 SDAC. The estimation of one-year longitudinal disability data, refinement of the estimated transition probabilities and their graduation are discussed in Paper II.