Milk fat is regarded as one of the most complex naturally occurring fats. The triacylglycerols of milk fat are synthesised from more than 400 different fatty acids (FAs) (Schröder & Vetter, Reference Schröder and Vetter2013). Fatty acids with 18 atoms of carbon (C18) are the quantitatively most important in milk fat, accounting for about two thirds of the total (Moate et al. Reference Moate, Chalupa, Boston and Lean2007; Shingfield et al. Reference Shingfield, Bonnet and Scollan2013). They play an important role from a nutritional point of view and, depending on their isomer configuration, vary in their biological properties. The proportions of individual C18 FAs in milk fat vary depending on the forage type and content in the diet and the lipid supplementation (Chilliard & Ferlay, Reference Chilliard and Ferlay2004; Chilliard et al. Reference Chilliard, Glasser, Ferlay, Bernard, Rouel and Doreau2007). Oleic acid (cis-9 C18:1) is the main monoenoic acid, accounting for about 21% of the total FAs. Trans C18 monoenoic FAs are usually found in quantities lower than 5% in milk fat, of which vaccenic acid (trans-11 C18:1) is the most abundant accounting for about 50–60% of the group in most diets. Linoleic acid (cis-9 cis-12 C18:2) and α-linolenic acid (cis-9 cis-12 cis-15 C18:3) are the quantitatively main C18 polyenoic FAs in proportions lower than 3 and 1%, respectively. The main trans C18 dienoic fatty acid is rumenic acid (cis-9 trans-11 C18:2), with a proportion of about 0·5% of the total FAs, and more than 75% of the total conjugated linoleic acid (Moate et al. Reference Moate, Chalupa, Boston and Lean2007; Shingfield et al. Reference Shingfield, Bonnet and Scollan2013). Except for oleic, linoleic and α-linolenic acids, which are supplied by the diet, other cis and trans C18 FAs found in milk fat are exclusively from endogenous origin: They arise from rumen microbial metabolism of the three above-mentioned FAs, and from mammary gland metabolism of the resulting isomers.
Most of those cis and trans FAs are important in rumen and mammary metabolism as well as in human nutrition (Shingfield et al. Reference Shingfield, Chilliard, Toivonen, Kairenius and Givens2008a, Reference Shingfield, Bonnet and Scollan2013; Or-Rashid et al. Reference Or-Rashid, Wright and McBride2009). Therefore, their origin as well as pathways of formation and conversion in ruminants arouse great interest.
Previous research with dairy ruminants has shown that the contents of C18 unsaturated FAs in milk fat respond in a different manner that is dependent upon the degree of unsaturation of plant lipids (i.e. their content in oleic, linoleic or α-linolenic acids) which are included in their diets. It has been observed that the contents of some milk FAs do not respond to some of the plant lipids supplemented, while other milk FAs show common positive responses to all of them. In the latter cases, the response can be more pronounced with certain types of plant lipids (Collomb et al. Reference Collomb, Schmid, Sieber, Wechsler and Ryhänen2004a; Bernard et al. Reference Bernard, Shingfield, Rouel, Ferlay and Chilliard2009; Bodas et al. Reference Bodas, Manso, Mantecón, Juárez, De la Fuente and Gómez-Cortés2010). The observed responses are usually explained in relation to the most abundant fatty acid in the plant lipids fed to the animals. However, other FAs supplied by the plant lipids may also contribute to the observed milk fat FAs profile. For example, two or more FAs present in a plant lipid being tested can additively increase the percentage of a particular fatty acid in milk fat if they share a common end-product in rumen microbial and/or mammary gland metabolism, making the results in those cases difficult to interpret.
Principal component analysis (PCA) and principal factor analysis (PFA) are variable reduction statistical techniques. PCA has been used to assess the effects of different nitrogen supplementation strategies in dairy cow diets (Cabrita et al. Reference Cabrita, Fonseca, Dewhurst and Gomes2003), the origin of some FAs in milk (Fievez et al. Reference Fievez, Vlaeminck, Dhanoa and Dewhurst2003), the relationship between some milk FAs and milk fat depression in dairy cows (Kadegowda et al. Reference Kadegowda, Piperova and Erdman2008), and to clarify the relationship between the changes in goat milk FAs profile and the type of plant oil and forage included in the diet (Bernard et al. Reference Bernard, Shingfield, Rouel, Ferlay and Chilliard2009). However, PFA should be used in order to make statements about the factors responsible for a set of observed responses (Suhr, Reference Suhr2005). The reason is that PFA assumes that the measured responses are based on the underlying factors (principal factors, PF), while in PCA the principal components are based on the measured responses themselves.
The aim of this study was to investigate, by using PFA, the relationship between the most abundant FAs in unsaturated plant oils fed to dairy goats and the contents of cis and trans C18 isomers of endogenous origin found in their milk fat.
Materials and methods
Experiments
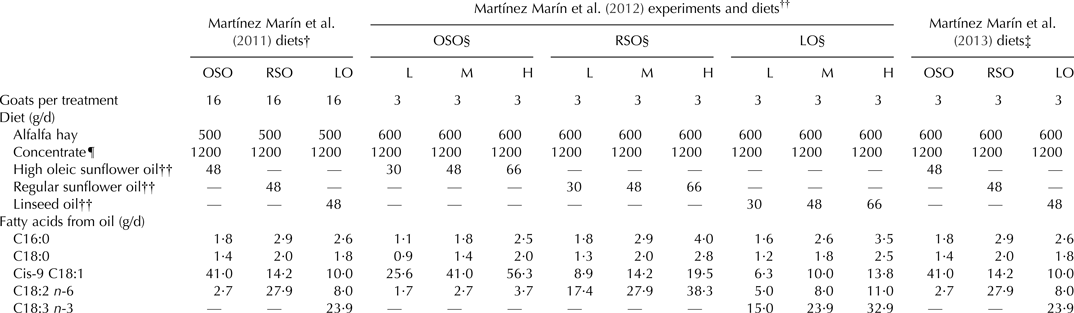
The present work used milk fat composition data from a series of experiments investigating the effects of plant oil supplementation to dairy goats on milk fat FA contents. In all the experiments, a common basal diet was used, which consisted of pelleted concentrate and alfalfa hay (Table 1). In two of those experiments (Martínez Marín et al. Reference Martínez Marín, Gómez-Cortés, Gómez Castro, Juárez, Pérez Alba, Pérez Hernández and De la Fuente2011, Reference Martínez Marín, Gómez-Cortés, Gómez Castro, Juárez, Pérez Alba, Pérez Hernández and De la Fuente2013), treatments were a control diet (basal diet without supplemented oil) and the same diet supplemented with 48 g/d of high oleic sunflower oil, regular sunflower oil, or linseed oil (Table 1). In Martínez Marín et al. (Reference Martínez Marín, Gómez-Cortés, Gómez Castro, Juárez, Pérez Alba, Pérez Hernández and De la Fuente2011), 16 goats were used in a 4 × 4 Latin square, while in Martínez Marín et al. (Reference Martínez Marín, Gómez-Cortés, Gómez Castro, Juárez, Pérez Alba, Pérez Hernández and De la Fuente2013), 12 goats were randomly assigned to each treatment (3 goats per treatment). In another set of experiments (Martínez Marín et al. Reference Martínez Marín, Gómez-Cortés, Gómez Castro, Juárez, Pérez Alba, Pérez Hernández and De la Fuente2012), treatments were a control diet (basal diet without supplemented oil) and the same diet supplemented with 30, 48 or 66 g/d of either high oleic sunflower oil, or regular sunflower oil, or linseed oil (Table 1). In each of the three experiments of this set, 12 goats were randomly assigned to each treatment (3 goats per treatment).
Composition of the experimental diets supplemented with high oleic sunflower oil (OSO), regular sunflower oil (RSO) or linseed oil (LO)

† Basal diet supplied 4·8, 0·7, 5·5, 14·2 and 3·0 g/d of C16:0, C18:0, cis-9 C18:1, C18:2 n-6 and C18:3 n-3, respectively, calculated according to INRA (2002)
‡ Basal diet supplied 5·1, 0·8, 6·9, 14·4 and 3·4 g/d of C16:0, C18:0, cis-9 C18:1, C18:2 n-6 and C18:3 n-3, respectively, calculated according to INRA (2002)
§ L, low; M, medium; H, high oil supplementation, respectively
¶ Composition (g/kg, as fed): maize, 375; barley, 374·9; soybean meal, 200; vitamin and mineral premix (Maxi NutralOvejas, Nutral, Madrid, Spain), 30; binder (Exal, Tolsa, Madrid, Spain), 20; antioxidant (Luctanox, Lucta, Barcelona, Spain), 0·1.
†† Included in the respective concentrate.
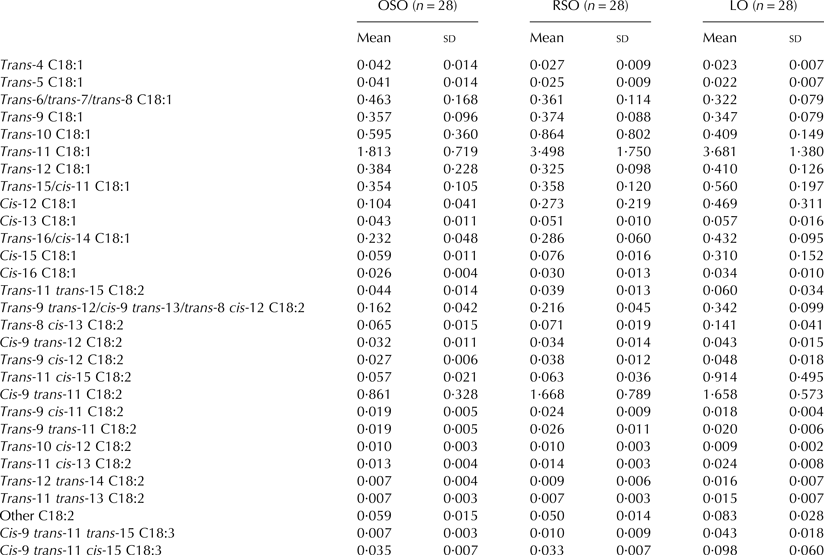
Up to 82 FAs were identified and quantified in milk fat samples using gas-liquid chromatography. Twenty nine of those FAs were C18 isomers originated exclusively from rumen and mammary gland metabolism (Table 2). Since the aim of the current study was to investigate the relationship between FAs in supplemented dietary plant lipids and the C18 isomers in milk fat, data from controls were not used. Therefore, the composition of 84 milk fat samples (28 samples per oil tested) were used to perform the PFA.
Mean contents of fatty acids with 18 atoms of carbon (g/100 g of total fatty acid methyl esters), included in the principal factor analysis, in the milk fat of goats fed high oleic sunflower oil (OSO), regular sunflower oil (RSO) or linseed oil (LO)
Milk fat analysis
Milk fat was extracted following the method described by Luna et al. (Reference Luna, Bach, Juárez and De la Fuente2008). Milk FA composition was determined by gas-liquid chromatography. Fatty acid methyl esters (FAME) were prepared according to ISO-IDF (2002). Analysis of FAME was performed on a gas-liquid chromatograph (Agilent 6890 N Network System) onto a CP-Sil 88 fused silica capillary column (100 × 0·25 mm, Varian, Middelburg, Netherlands) under similar conditions to those reported by Luna et al. (Reference Luna, Bach, Juárez and De la Fuente2008). Individual FAME quantification was performed using a milk fat with known composition (CRM 164; European Community Bureau of Reference, Brussels, Belgium). Individual FAs were identified by comparison with standards distributed by Nu-Chek (Elysian, MN, USA), while trans-11 cis-15 C18:2, trans-11 trans-15 C18:2, cis-9 trans-11 cis-15 C18:3 and cis-9 trans-11 trans-15 C18:3 had previously been identified by GC-MS/MS (Gómez-Cortés et al. Reference Gómez-Cortés, Tyburczy, Brenna, Juárez and De la Fuente2009a).
Statistical analysis
The FACTOR procedure of SAS 9·1 (SAS Institute Inc., Cary, NC) was used. Prior communality estimate for each variable was set to its squared multiple correlation with all other variables. The principal factors were extracted with the PRINIT option. Factors were orthogonally rotated with the VARIMAX option for easier interpretation of the results. Correlations between the PF and the FAs intake from plant oils were investigated with the CORR procedure.
Results and discussion
In the oils used in the experiments, the sum of oleic, linoleic and α-linolenic acids accounted for more than 85% of the total FAs. As shown in Table 1, oleic and linoleic acids were the predominant FAs in the diets supplemented with high oleic sunflower and regular sunflower oils, respectively, while diets supplemented with linseed oil showed a more balanced supply of oleic, linoleic and α-linolenic, the latter FAs being the most important. There were few differences in the FAs supplied by the basal diets (Table 1), since the only alteration was the amount of alfalfa hay in Martínez Marín et al. (Reference Martínez Marín, Gómez-Cortés, Gómez Castro, Juárez, Pérez Alba, Pérez Hernández and De la Fuente2011) and Martínez Marín et al. (Reference Martínez Marín, Gómez-Cortés, Gómez Castro, Juárez, Pérez Alba, Pérez Hernández and De la Fuente2012, Reference Martínez Marín, Gómez-Cortés, Gómez Castro, Juárez, Pérez Alba, Pérez Hernández and De la Fuente2013) (500 vs. 600 g/d, respectively).
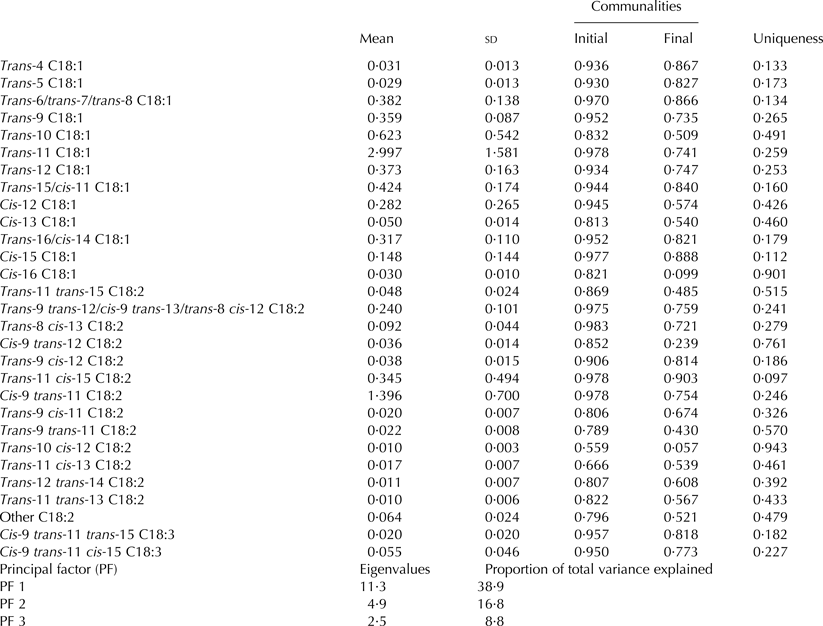
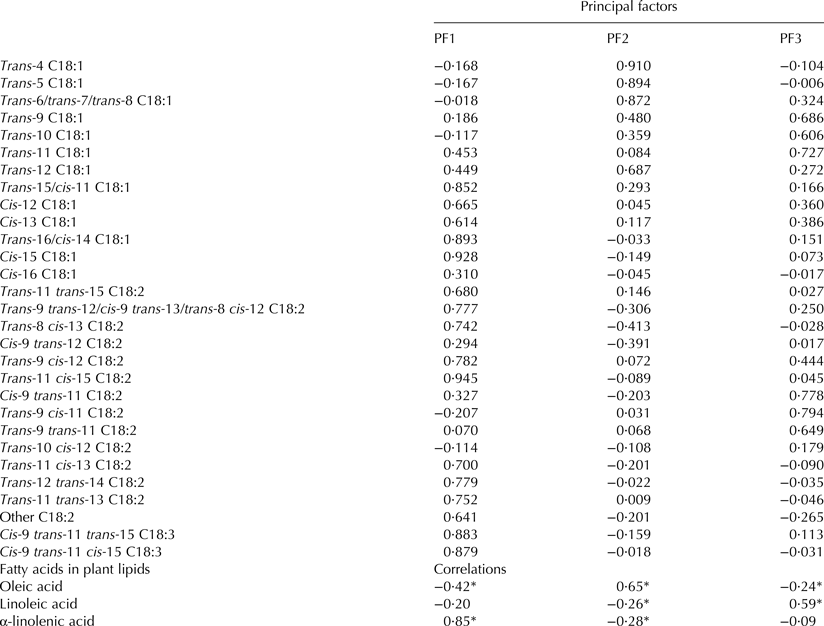
Kaiser's measure of sampling adequacy was 0·78 (1 being the best), which indicated that variables were appropriate for PFA. Three PF accounting for 64·5% of total variance were retained (Table 3), according to the interpretation criterion as described by Suhr (Reference Suhr2005). After varimax rotation, the proportions of total variance explained by PF1, PF2 and PF3 were 37·3, 13·7 and 13·5%, respectively. Positive significant (P < 0·05) Pearson's correlations were found between the intake of α-linolenic, oleic and linoleic acids (in grams per day) and the factor scores of individual observations in PF1, PF2 and PF3, respectively (Table 4).
Mean values (g/100 g total fatty acid methyl esters; n = 84), communalities and uniqueness of the fatty acids included in the principal factor analysis, and eigenvalues and proportion of total variance explained by the three first principal factors
Loadings of the fatty acids for each principal factor after varimax rotation, and Pearson's correlation coefficients between the fatty acid supplied by the plant oils (g/d) and the factor scores of individual observations in each principal factor
* Indicates P < 0·05
PFA decomposes the total variance of the measured variables in two components: the variance in the variables that is shared by other variables included in the model and can be explained by the PF (communality) and the variance that is unique to a particular variable and cannot be explained by the PF (uniqueness). Cis-16 C18:1, cis-9 trans-12 C18:2 and trans-10 cis-12 C18:2 were the only variables that showed low final communality values and high uniqueness values (Table 3), which means that they were not well represented in the common factor space, i.e. they shared little variance with other FAs. Those FAs showed positive loadings with PF1 (cis-16 C18:1 and cis-9 trans-12 C18:2) and PF3 (trans-10 cis-12 C18:2) (Table 4). These results are in agreement with those of Bernard et al. (Reference Bernard, Shingfield, Rouel, Ferlay and Chilliard2009) showing that the contents of cis-16 C18:1 and cis-9 trans-12 C18:2 were higher in the milk fat of goats fed 130 g/d of linseed oil compared with those fed the same amount of sunflower oil. They also observed that the content of trans-10 cis-12 C18:2 in milk fat only increased when the goats were fed 130 g/d of sunflower oil.
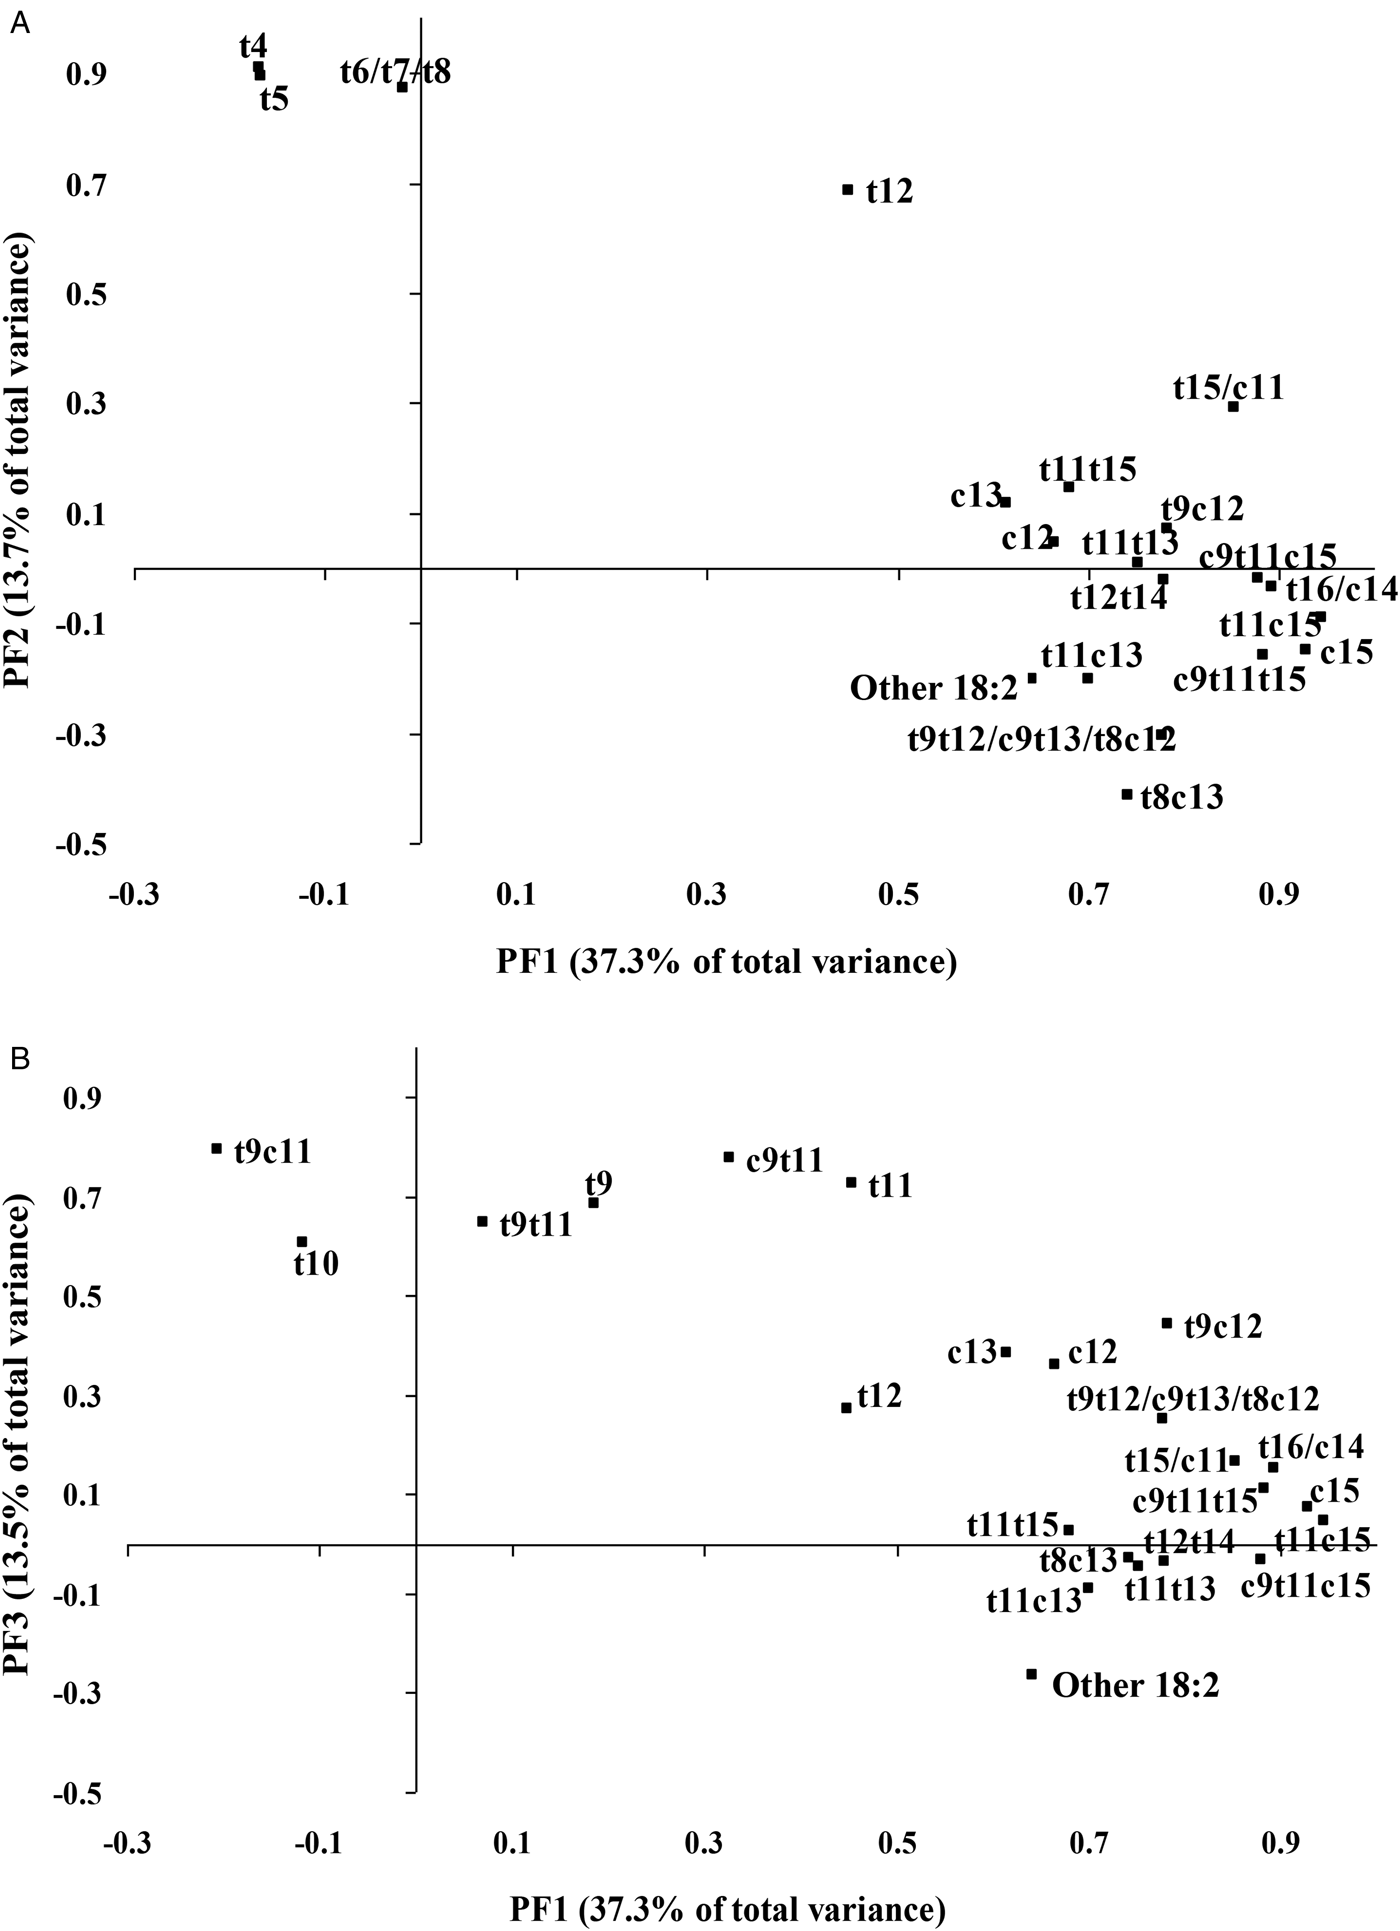
The rotated factor pattern (Table 4 and Fig. 1) showed that several monounsaturated FAs (i.e. trans-15/cis-11 C18:1, cis-12 C18:1, cis-13 C18:1, trans-16/cis-14 C18:1 and cis-15 C18:1), conjugated and non-conjugated C18:2 FAs (most of them with a double bond between 11 and 15 positions), other C18:2 FAs, and two isomers of α-linolenic acid (16 FAs in total) had high (>0·6) and positive loadings for PF1, which indicates that those FAs are related to rumen metabolism of α-linolenic acid or mammary desaturation of the resulting isomers. Wilde & Dawson (Reference Wilde and Dawson1966) postulated that the main rumen biohydrogenation (BH) pathway of α-linolenic acid involves an initial isomerisation to a conjugated triene with double bonds at carbons 9, 11 and 15 or 9, 13 and 15, followed by a reduction of the double bonds to produce non-conjugated trans cis/cis trans C18:2 and, to a smaller extent, cis cis C18:2; these dienes are hydrogenated mainly to trans C18:1, but also to cis C18:1, which in turn are hydrogenated to C18:0. Several FAs involved in those BH pathways have been identified in recent years (Destaillats et al. Reference Destaillats, Trottier, Galvez and Angers2005; Gómez-Cortés et al. Reference Gómez-Cortés, Bach, Luna, Juárez and De la Fuente2009b). Jouany et al. (Reference Jouany, Lassalas, Doreau and Glasser2007) pointed out that unsaturated FAs with a double bond at carbon 13 can be considered specific to α-linolenic acid metabolism in the rumen. The results of the present study suggest that the same could be applied to, at least, FAs with a double bond at 14, 15 or 16 positions. Some of those FAs could arise from mammary gland metabolism. Destaillats et al. (Reference Destaillats, Trottier, Galvez and Angers2005) suggested that cis-9 trans-13 C18:2 found in milk fat could be partially formed from endogenous ∆9 desaturation of trans-13 C18:1. That was also suggested by Martínez Marín et al. (Reference Martínez Marín, Gómez-Cortés, Gómez Castro, Juárez, Pérez Alba, Pérez Hernández and De la Fuente2011) with regard to ∆9 desaturation of trans-11 trans-15 C18:2 to render cis-9 trans-11 trans-15 C18:3. Trans-9 cis-12 C18:2 was the only fatty acid that had the highest loading for PF1 but also a moderate positive loading for PF3. The latter was not expected because this fatty acid has neither been found to increase in rumen contents of dairy cows fed soybean oil (Loor et al. Reference Loor, Bandara and Herbein2002) nor in milk fat of goats fed regular sunflower oil (Bernard et al. Reference Bernard, Shingfield, Rouel, Ferlay and Chilliard2009), although its content in milk fat has been observed to increase in response to linseed oil supplementation in dairy goats and ewes (Bernard et al. Reference Bernard, Shingfield, Rouel, Ferlay and Chilliard2009; Bodas et al. Reference Bodas, Manso, Mantecón, Juárez, De la Fuente and Gómez-Cortés2010).
Plot of rotated factor pattern for principal factors 1 and 2 (a), and principal factors 1 and 3 (b). Only fatty acids with loadings greater than ±0·6 are shown (c, cis; t, trans).
The only FAs with high (>0·6) and positive loadings for PF2 were trans-4 C18:1, trans-5 C18:1, trans-6/trans-7/trans-8 C18:1, and trans-12 C18:1 (Table 4 and Fig. 1). In vitro data show that those FAs can be produced from isomerisation of oleic acid (Mosley et al. Reference Mosley, Powell, Riley and Jenkins2002), but also from BH of linoleic and α-linolenic acids (Jouany et al. Reference Jouany, Lassalas, Doreau and Glasser2007). In vivo research has shown that the contents of trans-4 C18:1, trans-5 C18:1 and trans-6/trans-7/trans-8 C18:1 in milk fat increase in response to an increasing supply of high oleic sunflower oil in the diet, and, to a lesser extent, to increasing supplies of regular sunflower or linseed oils (Gómez-Cortés et al. Reference Gómez-Cortés, Bach, Luna, Juárez and De la Fuente2009b, Reference Gómez-Cortés, De la Fuente, Toral, Frutos, Juárez and Hervás2011; Martínez Marín et al. Reference Martínez Marín, Gómez-Cortés, Gómez Castro, Juárez, Pérez Alba, Pérez Hernández and De la Fuente2012). Bodas et al. (Reference Bodas, Manso, Mantecón, Juárez, De la Fuente and Gómez-Cortés2010) working with dairy ewes found that the contents of trans-6/trans-7/trans-8 C18:1 and trans-12 C18:1 in milk fat were higher when adding olive oil, a substantial source of oleic acid (about 75% of total FAs) to the diet instead of equal amounts of soybean or linseed oils, although these oils also resulted in significant increases of those FAs in milk fat compared with the control diet. In contrast, results from Collomb et al. (Reference Collomb, Schmid, Sieber, Wechsler and Ryhänen2004a) and Rego et al. (Reference Rego, Alves, Antunes, Rosa, Alfaia, Prates, Cabrita, Fonseca and Bessa2009), comparing equal amounts of rapeseed, sunflower seed and linseed fat, do not support oleic acid being the main precursor of those FAs. This disagreement could be explained, at least in part, because the lower content of oleic acid in rapeseed fat (56%) as well as its higher content in linoleic (18%) and α-linolenic (9%) acids compared with those in olive oil (76, 6% and less than 1%, respectively) might make the responses less clear. On the other hand, Loor et al. (Reference Loor, Bandara and Herbein2002) found that the contents of trans-4 C18:1, trans-5 C18:1 as well as the isomers trans-6 18:1, trans-7 18:1 and trans-8 18:1, which all eluted in the same chromatographic peak (they are labelled as trans-6/trans-7/trans-8 18:1 in the tables and the figure), but not trans-12 C18:1, in rumen fluid of dairy cows increased more when supplementing with canola oil than with the same amount of soybean oil. In contrast, Shingfield et al. (Reference Shingfield, Ahvenjarvi, Toivonen, Vanhatalo, Huhtanen and Griinari2008b) observed a linear increase in the flow of all the above mentioned FAs to the abomasum in response to increasing amounts of regular sunflower oil in the diet of dairy cows. Based on the results of the present research and most of the aforementioned studies, and taking into account that plant lipids rich in linoleic or α-linolenic acids also supply variable amounts of oleic acid, it could be hypothesised that the observed increases of trans-4 C18:1, trans-5 C18:1 and trans-6/trans-7/trans-8 C18:1 contents in milk fat are due to the oleic acid supplied by the plant lipids, but there is no evidence supporting this for trans-12 C18:1.
Trans-9 C18:1, trans-10 C18:1, and trans-11 C18:1, as well as cis-9 trans-11 C18:2, trans-9 cis-11 C18:2, and trans-9 trans-11 C18:2 had high (>0·6) and positive loadings for PF3 (Table 4 and Fig. 1). Trans-9 C18:1, trans-10 C18:1, and trans-11 C18:1 have been observed as a result of in vitro isomerisation of oleic acid and BH of linoleic acid and, except for trans-10 C18:1, of α-linolenic acid (Mosley et al. Reference Mosley, Powell, Riley and Jenkins2002; Jouany et al. Reference Jouany, Lassalas, Doreau and Glasser2007). The higher loading of trans-9 C18:1 for PF3 than for PF2 was not expected because studies conducted with dairy cows and ewes have shown higher or equal contents of that fatty acid in milk fat when feeding supplements rich in oleic acid than when feeding equal amounts of fat supplements rich in linoleic acid (Collomb et al. Reference Collomb, Schmid, Sieber, Wechsler and Ryhänen2004a; Rego et al. Reference Rego, Alves, Antunes, Rosa, Alfaia, Prates, Cabrita, Fonseca and Bessa2009; Bodas et al. Reference Bodas, Manso, Mantecón, Juárez, De la Fuente and Gómez-Cortés2010). The loadings of trans-10 C18:1 and trans-11 C18:1 for PF2 and PF1, respectively, were positive and moderately high which indicates that the supplies of high oleic sunflower oil and linseed oil are also related to increased contents of those FAs in milk fat. McKain et al. (Reference McKain, Shingfield and Wallace2010) suggested that trans-10 C18:1 is an intermediate product in the BH of linoleic acid, via trans-10 cis-12 C18:2; however, the content of linoleic acid in the high oleic sunflower oil used in the experiments included in the present study was very small. Therefore, only the isomerisation of supplied oleic acid could explain the loading of trans-10 C18:1 for PF2. Similarly, part of the relationship between trans-10 C18:1 and PF3 could be explained by the isomerisation of the moderate amount of oleic acid supplied by regular sunflower oil; however, this would not preclude that any trans-10 cis-12 C18:2 produced from linoleic acid might also be converted to trans-10 C18:1 by rumen microbes. The positive relationship of trans-11 C18:1 with PF1 has a double origin. This fatty acid is an intermediate product in the BH pathway of α-linolenic acid supplied by linseed oil, via trans-11 cis-15 C18:2 (Destaillats et al. Reference Destaillats, Trottier, Galvez and Angers2005), but it could also originate from BH of linoleic acid, which is present in significant amounts in linseed oil (14%), via cis-9 trans-11 C18:2 and trans-9 trans-11 C18:2 (McKain et al. Reference McKain, Shingfield and Wallace2010).
Regarding conjugated linoleic acid isomers, cis-9 trans-11 C18:2 and trans-9 trans-11 C18:2 are mainly produced in the BH of linoleic acid (Jouany et al. Reference Jouany, Lassalas, Doreau and Glasser2007), and their content in milk fat is related to the dietary intake of that fatty acid (Collomb et al. Reference Collomb, Sieber and Bütikofer2004b). However, from in vivo results, Bernard et al. (Reference Bernard, Mouriot, Rouel, Glasser, Capitan, Pujos-Guillot, Chardigny and Chilliard2010) estimated that 63–73% of milk cis-9 trans-11 C18:2 is synthesised endogenously from trans-11 C18:1 in goats. This fact as well as the direct BH of the linoleic acid present in linseed oil (about 15%) could justify the positive and moderate loading of cis-9 trans-11 C18:2 for PF1. With regard to trans-9 cis-11 C18:2, Bernard et al. (Reference Bernard, Shingfield, Rouel, Ferlay and Chilliard2009) did not find any increase of its content in the milk fat of goats fed diets with less than 55% concentrate and supplemented with 130 g/d of sunflower oil. However, the supply of 70 g/d of sunflower oil in a diet with a proportion of concentrate (70%), similar to that utilised in the present study, could switch linoleic acid BH pathways, resulting in a significant increase in trans-9 cis-11 C18:2 milk fat percentage (Gómez-Cortés et al. Reference Gómez-Cortés, De la Fuente, Toral, Frutos, Juárez and Hervás2011).
In conclusion, PFA was an useful tool to identify the relationships between certain C18 milk unsaturated FAs and the main FAs in three plant oils supplemented to dairy goat diets. Our results suggest that the observed changes in milk fat FAs contents in response to supplementation with plant lipids rich in unsaturated FAs are mainly due to the most abundant fatty acid in each particular plant lipid fed. However, those changes may also be attributed to more than one fatty acid when their relative abundance in the plant lipids is more balanced. Therefore, using mixtures of plant oils with differently unsaturated main FAs could be a way of tailoring milk fat composition to a pre-designed pattern.