



%20--%3e%3c!DOCTYPE%20svg%20PUBLIC%20'-//W3C//DTD%20SVG%201.0//EN'%20'http://www.w3.org/TR/2001/REC-SVG-20010904/DTD/svg10.dtd'%3e%3csvg%20version='1.0'%20id='Layer_1'%20xmlns='http://www.w3.org/2000/svg'%20xmlns:xlink='http://www.w3.org/1999/xlink'%20x='0px'%20y='0px'%20width='64px'%20height='64px'%20viewBox='5.5%20-3.5%2064%2064'%20enable-background='new%205.5%20-3.5%2064%2064'%20xml:space='preserve'%3e%3cg%3e%3ccircle%20fill='%23FFFFFF'%20fill-opacity='0'%20cx='37.785'%20cy='28.501'%20r='28.836'/%3e%3cpath%20fill='%23595959'%20d='M37.441-3.5c8.951,0,16.572,3.125,22.857,9.372c3.008,3.009,5.295,6.448,6.857,10.314%20c1.561,3.867,2.344,7.971,2.344,12.314c0,4.381-0.773,8.486-2.314,12.313c-1.543,3.828-3.82,7.21-6.828,10.143%20c-3.123,3.085-6.666,5.448-10.629,7.086c-3.961,1.638-8.057,2.457-12.285,2.457s-8.276-0.808-12.143-2.429%20c-3.866-1.618-7.333-3.961-10.4-7.027c-3.067-3.066-5.4-6.524-7-10.372S5.5,32.767,5.5,28.5c0-4.229,0.809-8.295,2.428-12.2%20c1.619-3.905,3.972-7.4,7.057-10.486C21.08-0.394,28.565-3.5,37.441-3.5z%20M37.557,2.272c-7.314,0-13.467,2.553-18.458,7.657%20c-2.515,2.553-4.448,5.419-5.8,8.6c-1.354,3.181-2.029,6.505-2.029,9.972c0,3.429,0.675,6.734,2.029,9.913%20c1.353,3.183,3.285,6.021,5.8,8.516c2.514,2.496,5.351,4.399,8.515,5.715c3.161,1.314,6.476,1.971,9.943,1.971%20c3.428,0,6.75-0.665,9.973-1.999c3.219-1.335,6.121-3.257,8.713-5.771c4.99-4.876,7.484-10.99,7.484-18.344%20c0-3.543-0.648-6.895-1.943-10.057c-1.293-3.162-3.18-5.98-5.654-8.458C50.984,4.844,44.795,2.272,37.557,2.272z%20M37.156,23.187%20l-4.287,2.229c-0.458-0.951-1.019-1.619-1.685-2c-0.667-0.38-1.286-0.571-1.858-0.571c-2.856,0-4.286,1.885-4.286,5.657%20c0,1.714,0.362,3.084,1.085,4.113c0.724,1.029,1.791,1.544,3.201,1.544c1.867,0,3.181-0.915,3.944-2.743l3.942,2%20c-0.838,1.563-2,2.791-3.486,3.686c-1.484,0.896-3.123,1.343-4.914,1.343c-2.857,0-5.163-0.875-6.915-2.629%20c-1.752-1.752-2.628-4.19-2.628-7.313c0-3.048,0.886-5.466,2.657-7.257c1.771-1.79,4.009-2.686,6.715-2.686%20C32.604,18.558,35.441,20.101,37.156,23.187z%20M55.613,23.187l-4.229,2.229c-0.457-0.951-1.02-1.619-1.686-2%20c-0.668-0.38-1.307-0.571-1.914-0.571c-2.857,0-4.287,1.885-4.287,5.657c0,1.714,0.363,3.084,1.086,4.113%20c0.723,1.029,1.789,1.544,3.201,1.544c1.865,0,3.18-0.915,3.941-2.743l4,2c-0.875,1.563-2.057,2.791-3.541,3.686%20c-1.486,0.896-3.105,1.343-4.857,1.343c-2.896,0-5.209-0.875-6.941-2.629c-1.736-1.752-2.602-4.19-2.602-7.313%20c0-3.048,0.885-5.466,2.658-7.257c1.77-1.79,4.008-2.686,6.713-2.686C51.117,18.558,53.938,20.101,55.613,23.187z'/%3e%3c/g%3e%3c/svg%3e)
%20--%3e%3c!DOCTYPE%20svg%20PUBLIC%20'-//W3C//DTD%20SVG%201.0//EN'%20'http://www.w3.org/TR/2001/REC-SVG-20010904/DTD/svg10.dtd'%3e%3csvg%20version='1.0'%20id='Layer_1'%20xmlns='http://www.w3.org/2000/svg'%20xmlns:xlink='http://www.w3.org/1999/xlink'%20x='0px'%20y='0px'%20width='64px'%20height='64px'%20viewBox='5.5%20-3.5%2064%2064'%20enable-background='new%205.5%20-3.5%2064%2064'%20xml:space='preserve'%3e%3cg%3e%3ccircle%20fill='%23FFFFFF'%20fill-opacity='0'%20cx='37.637'%20cy='28.806'%20r='28.276'/%3e%3cg%3e%3cpath%20fill='%23595959'%20d='M37.443-3.5c8.988,0,16.57,3.085,22.742,9.257C66.393,11.967,69.5,19.548,69.5,28.5c0,8.991-3.049,16.476-9.145,22.456%20C53.879,57.319,46.242,60.5,37.443,60.5c-8.649,0-16.153-3.144-22.514-9.43C8.644,44.784,5.5,37.262,5.5,28.5%20c0-8.761,3.144-16.342,9.429-22.742C21.101-0.415,28.604-3.5,37.443-3.5z%20M37.557,2.272c-7.276,0-13.428,2.553-18.457,7.657%20c-5.22,5.334-7.829,11.525-7.829,18.572c0,7.086,2.59,13.22,7.77,18.398c5.181,5.182,11.352,7.771,18.514,7.771%20c7.123,0,13.334-2.607,18.629-7.828c5.029-4.838,7.543-10.952,7.543-18.343c0-7.276-2.553-13.465-7.656-18.571%20C50.967,4.824,44.795,2.272,37.557,2.272z%20M46.129,20.557v13.085h-3.656v15.542h-9.944V33.643h-3.656V20.557%20c0-0.572,0.2-1.057,0.599-1.457c0.401-0.399,0.887-0.6,1.457-0.6h13.144c0.533,0,1.01,0.2,1.428,0.6%20C45.918,19.5,46.129,19.986,46.129,20.557z%20M33.042,12.329c0-3.008,1.485-4.514,4.458-4.514s4.457,1.504,4.457,4.514%20c0,2.971-1.486,4.457-4.457,4.457S33.042,15.3,33.042,12.329z'/%3e%3c/g%3e%3c/g%3e%3c/svg%3e)
1. Introduction
Active flow control is of wide interest due to its extensive industrial applications where the fluid motion is manipulated with energy-consuming controllers towards a desired target, such as the reduction of drag, the enhancement of heat transfer, and delay of the transition from a laminar flow to turbulence (Brunton & Noack Reference Brunton and Noack2015). Depending on whether we have a model for describing the dynamics of the fluid motion, the control strategies can be categorised into model-based and model-free methods. The former assumes the controller's complete awareness of a model that can describe the flow behaviour accurately (e.g. Navier–Stokes equations). The linear system theory acts as the foundation for the model-based controllers, such as linear quadratic regulator and model predictive control. The model-based approach has been applied widely in the active flow control of academic flows (Kim & Bewley Reference Kim and Bewley2007; Sipp et al. Reference Sipp, Marquet, Meliga and Barbagallo2010; Sipp & Schmid Reference Sipp and Schmid2016).
In real-world flow conditions, however, an accurate flow model is often unavailable. Even in the case where a model can be assumed, once the flow condition changes drastically, beyond the predictability of the model, the control performance will also deteriorate. Model-free techniques based on a system identification method can tackle this issue and have enjoyed success to some extent in controlling flows. Nevertheless, limitations also exist for this method, such as a large number of free parameters (Sturzebecher & Nitsche Reference Sturzebecher and Nitsche2003; Hervé et al. Reference Hervé, Sipp, Schmid and Samuelides2012). Thus more advanced model-free control methods based on machine learning (ML) have been put forward and studied to cope with the complex flow conditions (Lee et al. Reference Lee, Kim, Babcock and Goodman1997; Gautier et al. Reference Gautier, Aider, Duriez, Noack, Segond and Abel2015; Duriez, Brunton & Noack Reference Duriez, Brunton and Noack2017; Rabault et al. Reference Rabault, Kuchta, Jensen, Réglade and Cerardi2019; Park & Choi Reference Park and Choi2020). In this work, we examine the performance of a model-free deep reinforcement learning (DRL) algorithm in controlling convectively-unstable flows, subjected to random upstream noise. Our investigation will begin with the one-dimensional (1-D) Kuramoto–Sivashinsky (KS) equation, which can be regarded as a reduced model of laminar boundary layer flows past a flat plate, and then extend to the controlling of the two-dimensional (2-D) boundary layer flows. One of our focuses is to optimise the placement of sensors in the flow to maximise the efficiency of the DRL control. In the following, we will first review the recent works on DRL-based flow control and the optimisation of sensor placement in other control methods.
1.1. DRL-based flow control
With the advancement of ML technologies, especially deep neural networks and the ever-increasing amount of data, DRL burgeons and has proven its power in solving complex decision-making problems in various applications, including robotics (Kober, Bagnell & Peters Reference Kober, Bagnell and Peters2013), game playing (Mnih et al. Reference Mnih, Kavukcuoglu, Silver, Graves, Antonoglou, Wierstra and Riedmiller2013) and flow control (Rabault et al. Reference Rabault, Kuchta, Jensen, Réglade and Cerardi2019). In particular, DRL refers to an automated algorithm that aims to maximise a reward function by evaluating the state of an environment with which the DRL agent can interact via sensors. It is particularly suitable for flow control due to their similar settings, and is being researched actively in the field of active flow control (Rabault & Kuhnle Reference Rabault and Kuhnle2019; Brunton, Noack & Koumoutsakos Reference Brunton, Noack and Koumoutsakos2020; Brunton Reference Brunton2021).
Based on a Markov process model and the classical reinforcement learning algorithm, Guéniat, Mathelin & Hussaini (Reference Guéniat, Mathelin and Hussaini2016) first proposed an experiment-oriented control approach and demonstrated its effectiveness in reducing the drag in a cylindrical wake flow. Pivot et al. (Reference Pivot, Mathelin, Cordier, Guéniat and Noack2017) presented a proof-of-concept application of DRL control strategy to 2-D cylinder wake flow, and achieved a 17 % reduction of drag by rotating the cylinder. Koizumi, Tsutsumi & Shima (Reference Koizumi, Tsutsumi and Shima2010) adopted the DRL-based feedback control to reduce the fluctuation of the lift force acting on the cylinder due to the Kármán vortex shedding via two synthetic jets. They compared the DRL-based control with traditional model-based control, and found that DRL achieved a better performance. A subsequent well-cited work that has attracted much attention to DRL in the fluid community is due to Rabault et al. (Reference Rabault, Kuchta, Jensen, Réglade and Cerardi2019). They applied the DRL-based control to stabilise the Kármán vortex alley via two synthetic jets on a cylinder that was confined between two flat walls, and analysed the control strategy by comparing the macroscopic flow features before and after the control. These pioneering works laid the foundation of the DRL-based active flow control and have sparked great interest of the fluid community in DRL.
Other technical improvements and parameter investigations have been achieved. Rabault & Kuhnle (Reference Rabault and Kuhnle2019) proposed a multi-environment strategy to further accelerate the training process of the DRL agent. Xu et al. (Reference Xu, Zhang, Deng and Rabault2020) applied the DRL-based control to stabilise the vortex shedding of a primary cylinder via the counter-rotating small cylinder pair downstream of the primary one. Tang et al. (Reference Tang, Rabault, Kuhnle, Wang and Wang2020) presented a robust DRL control strategy to reduce the drag of a cylinder using four synthetic jets. The DRL agent was trained with four different Reynolds numbers ( $Re$), but was proved to be effective for any
 $Re$ between 60 and 400. Paris, Beneddine & Dandois (Reference Paris, Beneddine and Dandois2021) also studied a robust DRL control scheme to reduce the drag of a cylinder via two synthetic jets. They focused on identifying the (sub-)optimal placement of the sensors in the cylinder wake flow from a predefined matrix of the sensors. Ren, Rabault & Tang (Reference Ren, Rabault and Tang2021) further extended the DRL-based control of the cylinder wake from the laminar regime to the weakly turbulent regime with
 $Re=1000$. Li & Zhang (Reference Li and Zhang2022) incorporated the physical knowledge from stability analyses into the DRL-based control of confined cylinder wakes, which facilitated the sensor placement and the reward function design in the DRL framework. Moreover, Castellanos et al. (Reference Castellanos, Cornejo Maceda, de la Fuente, Noack, Ianiro and Discetti2022) assessed both DRL-based control and linear genetic programming control (LGPC) for reducing the drag in a cylindrical wake flow at
 $Re = 100$. It was found that DRL was more robust to different initial conditions and noise contamination, while LGPC was able to realise control with fewer sensors. Pino et al. (Reference Pino, Schena, Rabault, Kuhnle and Mendez2022) provided a detailed comparison between some global optimisation techniques and ML methods (LGPC and DRL) in different flow control problems, to better understand how the DRL performs.
All the aforementioned works are implemented through numerical simulations. Fan et al. (Reference Fan, Yang, Wang, Triantafyllou and Karniadakis2020) first demonstrated experimentally the effectiveness of DRL-based control for reducing the drag in turbulent cylinder wakes through the counter-rotation of a pair of small cylinders downstream of the main one. Shimomura et al. (Reference Shimomura, Sekimoto, Oyama, Fujii and Nishida2020) proved the viability of DRL-based control for reducing the flow separation around a NACA0015 aerofoil in experiments. The control was realised through adjusting the burst frequency of a plasma actuator, and the flow reattachment was achieved under angles of attack  $12^\circ$ and
 $15^\circ$. For a more detailed description of the recent studies of DRL-based flow control in fluid mechanics, readers are referred to the latest review papers on this topic (Rabault et al. Reference Rabault, Ren, Zhang, Tang and Xu2020; Garnier et al. Reference Garnier, Viquerat, Rabault, Larcher, Kuhnle and Hachem2021; Viquerat, Meliga & Hachem Reference Viquerat, Meliga and Hachem2021).
After reviewing the works on DRL applied to flow control, we would like to point out one important research direction that deserves to be explored further, which is to embed domain knowledge or flow physics including symmetry or equivariance in the DRL-based control strategy. It has been demonstrated in other scientific fields that ML methods embedded with domain knowledge or symmetry properties inherent in the physical system can outperform the vanilla ML methods (Ling, Kurzawski & Templeton Reference Ling, Kurzawski and Templeton2016; Zhang, Shen & Zhai Reference Zhang, Shen and Zhai2018; Karniadakis et al. Reference Karniadakis, Kevrekidis, Lu, Perdikaris, Wang and Yang2021; Smidt, Geiger & Miller Reference Smidt, Geiger and Miller2021; Bogatskiy et al. Reference Bogatskiy2022). This will not only enhance the sample efficiency, but also guarantee the physical property of the controlled result. In the DRL community, only a few scattered attempts have been made (Belus et al. Reference Belus, Rabault, Viquerat, Che, Hachem and Reglade2019; Zeng & Graham Reference Zeng and Graham2021; Li & Zhang Reference Li and Zhang2022), and more works need to be followed in this direction to fully unleash the power of DRL in controlling flows.
1.2. Sensor placement optimisation
Sensors probe the states of the dynamical system. The extracted information can be used further for a variety of purposes, such as classification, reconstruction or reduced-order modelling of a high-dimensional system through a sparse set of sensor signals (Brunton et al. Reference Brunton, Brunton, Proctor and Kutz2016; Loiseau, Noack & Brunton Reference Loiseau, Noack and Brunton2018; Manohar et al. Reference Manohar, Brunton, Kutz and Brunton2018), and state estimation of large-scale partial differential equations (Khan, Morris & Stastna Reference Khan, Morris and Stastna2015; Hu, Morris & Zhang Reference Hu, Morris and Zhang2016). Here, we focus mainly on the field of active flow control, where sensors are used to collect information from the flow environment as feedback to the actuator. The effect of sensor placement on flow control performance has been investigated in boundary layer flows (Belson et al. Reference Belson, Semeraro, Rowley and Henningson2013) and cylinder wake flows (Akhtar et al. Reference Akhtar, Borggaard, Burns, Imtiaz and Zietsman2015). Identifying the optimal sensor placement is of great significance to the efficiency of the corresponding control scheme.
Initially, some heuristic efforts were made to guide the sensor placement through modal analyses. For instance, Strykowski & Sreenivasan (Reference Strykowski and Sreenivasan1990) placed a second, much smaller cylinder in the wake region of the primary cylinder, and recorded the specific placements of the second cylinder, which led to an effective suppression of the vortex shedding. Later, Giannetti & Luchini (Reference Giannetti and Luchini2007) found that the specific placements determined by Strykowski & Sreenivasan (Reference Strykowski and Sreenivasan1990) in fact corresponded to the wavemaker region where the direct and adjoint eigenmodes overlapped. Akervik et al. (Reference Akervik, Hoepffner, Ehrenstein and Henningson2007) and Bagheri et al. (Reference Bagheri, Henningson, Hoepffner and Schmid2009) proposed that in the framework of flow control, sensors should be placed in the region where the leading direct eigenmode has a large magnitude, and actuators should be placed in the region where the leading adjoint eigenmode has a large magnitude when the adjoint modes and the global modes have a small overlap. Likewise, Natarajan, Freund & Bodony (Reference Natarajan, Freund and Bodony2016) developed an extended method of structural sensitivity analysis to help place collocated sensor–actuator pairs for controlling flow instabilities in a high-subsonic diffuser. Such placements based on physical characteristics of the flow system may be appropriate for the globally unstable flow where the whole flow system beats at a particular frequency and the major disturbances never leave a specific region (such flows are called absolutely unstable; cf. Huerre & Monkewitz Reference Huerre and Monkewitz1990).
However, for a convectively-unstable flow system with a large transient growth, such a method failed to predict the optimal placement, as demonstrated by Chen & Rowley (Reference Chen and Rowley2011). They proposed to address the optimal placement issue using a mathematically rigorous method. They identified the  $\mathscr {H}_2$ optimal controller in conjunction with the optimal sensor and actuator placement via the conjugate gradient method, in order to control perturbations evolving in spatially developing flows modelled by the linearised Ginzburg–Landau equation (LGLE). Colburn (Reference Colburn2011) improved the method by working directly with the covariance of the estimation error instead of the Fisher information matrix. Chen & Rowley (Reference Chen and Rowley2014) further demonstrated the effectiveness of this method in the Orr–Sommerfeld/Squire equations for the optimal sensor and actuator placement. Oehler & Illingworth (Reference Oehler and Illingworth2018) analysed the trade-offs when placing sensors and actuators in the feedback flow control based on the LGLE. Manohar, Kutz & Brunton (Reference Manohar, Kutz and Brunton2021) studied the optimal sensor and actuator placement issue using balanced model reduction with a greedy optimisation method. The effectiveness of this method was demonstrated in the
 $\mathscr {H}_2$ optimal control of the LGLE, where a placement was achieved similar to that in Chen & Rowley (Reference Chen and Rowley2011) but with less runtime. More recently, Sashittal & Bodony (Reference Sashittal and Bodony2021) proposed a data-driven method to generate a linear reduced-order model of the flow dynamics and then optimised the sensor placement using an adjoint-based method. Jin, Illingworth & Sandberg (Reference Jin, Illingworth and Sandberg2022) explored the optimal sensor and actuator placement in the context of feedback control of vortex shedding using a gradient minimisation method, and analysed the trade-offs when placing sensors.
In most of the aforementioned studies, traditional model-based controllers were considered and gradient-based methods were adopted to solve the optimisation problem of the sensor placement, as the gradients of the control objective with respect to sensor positions can be calculated using explicit formulas involved in the model-based controllers. However, in the context of data-driven DRL-based flow control, such accurate gradient information is unavailable because of its model-free probing and controlling of the flow system in a trial-and-error manner. The sensor placement affects the DRL-based control performance in a non-trivial way. Thus studies on the optimised sensor placement in DRL-based flow control are important but currently rare. In the DRL context, Rabault et al. (Reference Rabault, Kuchta, Jensen, Réglade and Cerardi2019) attempted to use much fewer sensors – 5 and 11 – to perform the same DRL training, and found that the resulting control performance was far less satisfactory than that of the original placement of 151 sensors (see their Appendix). Paris et al. (Reference Paris, Beneddine and Dandois2021) proposed a novel algorithm named S-PPO-CMA to obtain the (sub-)optimal sensor placement. Nevertheless, they selected the best sensor layout from some predefined sensors, and the sensor position cannot change in the optimisation process. Ren et al. (Reference Ren, Rabault and Tang2021) reported that an a posteriori sensitivity analysis was helpful to improve the sensor layout, but this method was implemented as a post-processing data analysis, unable to provide guidelines for the sensor placement a priori (see also Pino et al. Reference Pino, Schena, Rabault, Kuhnle and Mendez2022). Li & Zhang (Reference Li and Zhang2022) proposed a heuristic way to place the sensors in the wavemaker region in the confined cylindrical wake flow, and the optimal layout was not determined theoretically in an optimisation problem. For optimisation problems where the gradient information is unavailable, it is natural to consider non-gradient-based methods such as genetic algorithm (GA) and particle swarm optimisation (PSO) (Koziel & Yang Reference Koziel and Yang2011). For instance, Mehrabian & Yousefi-Koma (Reference Mehrabian and Yousefi-Koma2007) adopted a bio-inspired invasive weed optimisation algorithm to place optimally piezoelectric actuators on the smart fin for vibration control. Yi, Li & Gu (Reference Yi, Li and Gu2011) utilised a generalised GA to find the optimal sensor placement in the structural health monitoring (SHM) of high-rise structures. Blanloeuil, Nurhazli & Veidt (Reference Blanloeuil, Nurhazli and Veidt2016) applied a PSO algorithm to improve the sensor placement in an ultrasonic SHM system. The improved sensor placement enabled better detection of multiple defects in the target area. Wagiman et al. (Reference Wagiman, Abdullah, Hassan and Radzi2020) adopted a PSO algorithm to find an optimal light sensor placement of an indoor lighting control system. A 24.5 % energy saving was achieved with the optimal number and position of sensors. These works enlighten us on how to distribute optimally the sensors in the model-free DRL control.
1.3. The current work
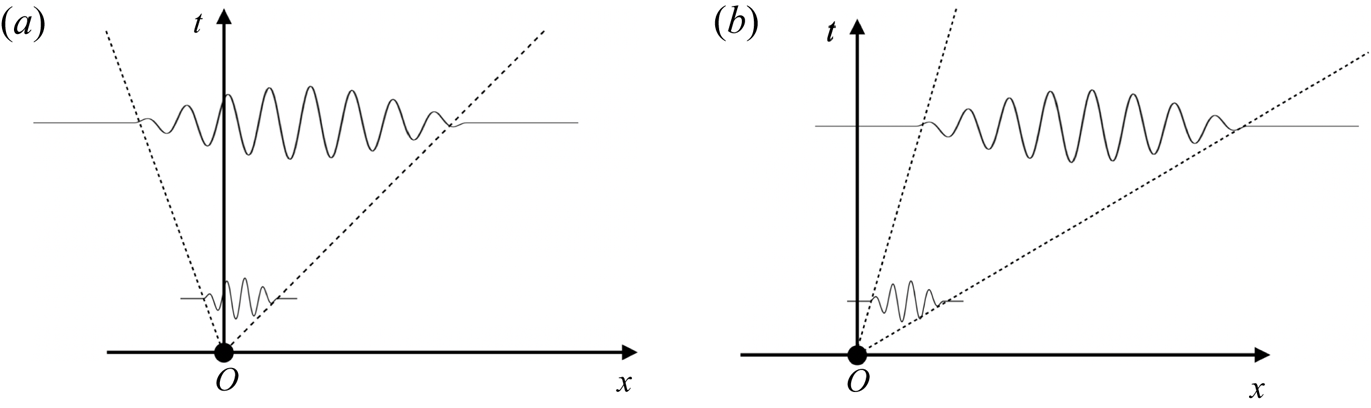
In the current work, we aim to study the performance of the model-free DRL-based strategy in controlling convectively unstable flows. The difference between absolute instability and convective instability is shown in figure 1 (Huerre & Monkewitz Reference Huerre and Monkewitz1990). An absolutely unstable flow is featured by an intrinsic instability mechanism and is thus less sensitive to the external disturbance. A good example of this type of flow is the global onset of vortex shedding in cylindrical wake flows, which have been studied extensively in DRL-based flow control (Rabault et al. Reference Rabault, Kuchta, Jensen, Réglade and Cerardi2019; Fan et al. Reference Fan, Yang, Wang, Triantafyllou and Karniadakis2020; Paris et al. Reference Paris, Beneddine and Dandois2021; Li & Zhang Reference Li and Zhang2022). On the contrary, the convectively unstable flow acts as a noise amplifier and is able to selectively amplify the external disturbance, such as boundary layer flows and jets. Compared to absolutely unstable flows, controlling a convectively unstable flow subjected to unknown upstream disturbance is more challenging, representing a more stringent test of the control ability of DRL. This type of flow is less studied in the context of DRL-based flow control.
Schematic of absolute and convective instabilities. A localised infinitesimal perturbation can grow at a fixed location, leading to (a) an absolute instability, or decay at a fixed location but grow as convected downstream, leading to (b) a convective instability.
As a proof-of-concept study, in this work we will control the 1-D linearised Kuramoto–Sivashinsky (KS) equation and the 2-D boundary layer flows. The KS equation is supplemented with an outflow boundary condition, without translational and reflection symmetries, and has been used widely as a reduced model of the disturbance developing in the laminar boundary layer flows. We will investigate the sensor placement issue in the DRL-based control by formulating an optimisation problem in the KS equation based on the PSO method. Then the optimised sensor placement determined in the KS equation will be applied directly to the 2-D Blasius boundary layer flow solved by the complete Navier–Stokes (NS) equations, to evaluate the performance of DRL in suppressing the convective instability in a more realistic flow. We were not able to optimise directly the sensor placement in the 2-D boundary layer flow using the PSO method because the computation in the latter case is exceedingly demanding. We thus circumvented this issue by resorting to the reduced-order 1-D KS equation.
The paper is structured as follows. In § 2, we introduce the flow control problem. In § 3, we present the numerical method adopted in this work. The results on DRL-based flow control and the optimal sensor placement are reported in § 4. Finally, in § 5, we conclude the paper with some discussions. In the appendices, we investigate the dynamics of the nonlinear KS equation and its control when the nonlinear effect cannot be neglected, and we propose a stability-enhanced design for the reward function to further improve the control performance. In addition, we also provide an explanation of the time delay issue in DRL-based control, and a brief introduction to the classical-model-based linear quadratic regulator (LQR).
2. Problem formulation
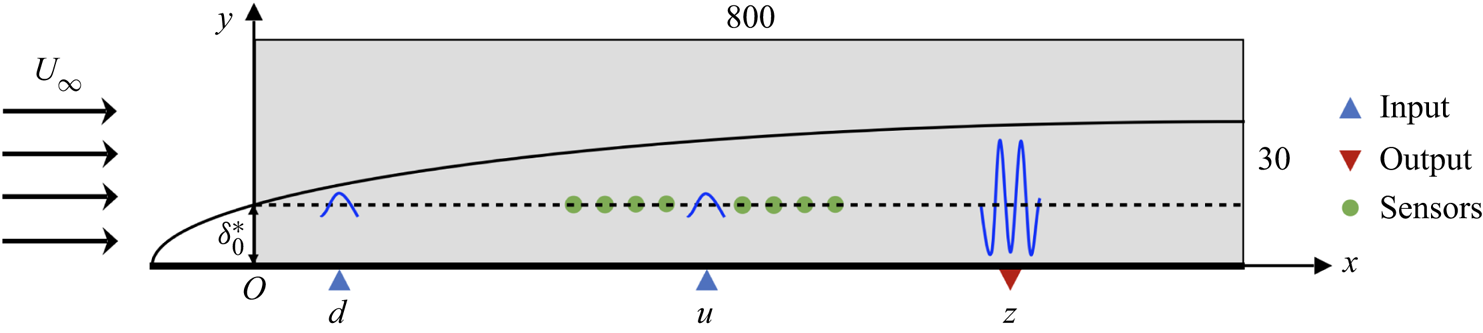
We investigate the control of perturbation evolving in a flat-plate boundary layer flow modelled by the linearised KS equation and the NS equations, as shown in figure 2. A localised Gaussian disturbance is introduced at point  $d$. Due to the convective instability of the flow, the amplitude of the perturbation will grow exponentially with time while travelling downstream, if uncontrolled. The closed-loop control system is formed by introducing a spatially localised forcing at point
 $u$ as the control action, which is determined by the DRL agent based on the feedback signals collected by sensors (denoted by green points in figure 2). The control objective is to minimise the downstream perturbation measured by an output sensor at point
 $z$, trying to abate the exponential flow instability.
Control set-up for a 2-D flat-plate boundary layer flow. Random noise is introduced at point  $d$, and a feedback control based on states collected by sensors is implemented at point
 $u$ to minimise the downstream perturbation measured at point
 $z$. Here,
 $U_\infty$ is the uniform free-stream velocity, and
 $\delta _0^*$ is the displacement thickness of the boundary layer at the inlet of the domain shown by the grey box
 $\varOmega = (0, 800) \times (0, 30)$, which is non-dimensionalised by
 $\delta _0^*$.
2.1. Governing equation of the 1-D Kuramoto–Sivashinsky equation
The original KS equation was first used to describe flame fronts in laminar flames (Kuramoto & Tsuzuki Reference Kuramoto and Tsuzuki1976; Sivashinsky Reference Sivashinsky1977) and is one of the simplest nonlinear PDEs that exhibit spatiotemporal chaos (Cvitanović, Davidchack & Siminos Reference Cvitanović, Davidchack and Siminos2010). It has become a common toy problem in the studies of ML, such as the data-driven reduction of chaotic dynamics on an inertial manifold (Linot & Graham Reference Linot and Graham2020) and the DRL-based control of chaotic systems (Bucci et al. Reference Bucci, Semeraro, Allauzen, Wisniewski, Cordier and Mathelin2019; Zeng & Graham Reference Zeng and Graham2021). Here, we investigate the 1-D linearised KS equation as a reduced-order model representation of the disturbance developing in 2-D boundary layer flows; cf. Fabbiane et al. (Reference Fabbiane, Semeraro, Bagheri and Henningson2014) for a detailed illustration of various model-based and adaptive control methods applied to the KS equation. Specifically, the linearised KS equation can describe the flow dynamics at a wall-normal position  $y=\delta _0^{*}$, where
 $\delta _0^*$ is the displacement thickness of the boundary layer at the inlet of the computational domain, as shown in figure 2. The linearised step is outlined briefly below. First, the original non-dimensionalised KS equation reads
 \begin{equation} \frac{\partial v}{\partial t}+v\,\frac{\partial v}{\partial x}={-}\frac{1}{\mathcal{R}}\left(\mathcal{P}\,\frac{\partial^{2} v}{\partial x^{2}}+\frac{\partial^{4} v}{\partial x^{4}}\right),\quad x\in(0,L), \end{equation}
where  $v(x,t)$ represents the velocity field,
 $\mathcal {R}$ is the Reynolds number (or
 $Re$ in boundary layer flows),
 $\mathcal {P}$ is a coefficient balancing energy production and dissipation, and finally
 $L$ is the length of the 1-D domain. Since we study a fluid system that is close to a steady solution
 $V$ (a constant), we can decompose the velocity into a combination of two terms as
 \begin{equation} v(x, t)=V+\varepsilon\,v^{\prime}(x, t), \end{equation}
where  $v^{\prime }(x, t)$ is the perturbation velocity with
 $\varepsilon \ll 1$. Inserting (2.2) into (2.1) yields
 \begin{equation} \frac{\partial v^{\prime}}{\partial t}={-}V\,\frac{\partial v^{\prime}}{\partial x}-\frac{1}{\mathcal{R}}\left(\mathcal{P}\,\frac{\partial^{2} v^{\prime}}{\partial x^{2}}+\frac{\partial^{4} v^{\prime}}{\partial x^{4}}\right)-\varepsilon v^{\prime}\, \frac{\partial v^{\prime}}{\partial x}+f(x, t),\quad x\in(0,L), \end{equation}
where the external forcing term  $f(x,t)$ now appears on the right-hand side for the introduction of disturbance and control terms.
When the perturbation is small enough, we can neglect the nonlinear term  $- \varepsilon v^{\prime }\,\partial v^{\prime } / \partial x$ in (2.3) and obtain the following linearised KS equation to model the dynamics of streamwise perturbation velocity evolving in flat-plate boundary layer flows:
 \begin{equation} \frac{\partial v^{\prime}}{\partial t}={-}V\,\frac{\partial v^{\prime}}{\partial x}-\frac{1}{\mathcal{R}}\left(\mathcal{P}\,\frac{\partial^{2} v^{\prime}}{\partial x^{2}}+\frac{\partial^{4} v^{\prime}}{\partial x^{4}}\right)+f(x, t),\quad x\in(0,L), \end{equation}
with the unperturbed boundary conditions
 \begin{equation} \text{inflow } \left.v^{\prime}\right|_{x=0}=0,\left. \frac{\partial v^{\prime}}{\partial x}\right|_{x=0}=0, \quad \text{outflow } \left.\frac{\partial^{3} v^{\prime}}{\partial x^{3}}\right|_{x=L}=0,\left. \frac{\partial v^{\prime}}{\partial x}\right|_{x=L}=0. \end{equation}
We adopt the same parameter settings as those in Fabbiane et al. (Reference Fabbiane, Semeraro, Bagheri and Henningson2014), i.e.  $\mathcal {R} = 0.25$,
 $\mathcal {P} = 0.05$,
 $V = 0.4$ and
 $L = 800$, to model the 2-D boundary layer at
 $Re = 1000$.
The external forcing term  $f(x, t)$ in (2.4) includes both noise input and control input:
 \begin{equation} f(x, t)=b_{d}(x)\,d(t)+b_{u}(x)\,u(t), \end{equation}
where  $b_{d}(x)$ and
 $b_{u}(x)$ represent the spatial distribution of noise and control inputs, respectively;
 $d(t)$ and
 $u(t)$ correspond to the temporal signals. The downstream output measured at point
 $z$ is expressed by
 \begin{equation} z(t)=\int_{0}^{L} c_{z}(x)\,v^{\prime}(x, t) \,{{\rm d}\kern0.7pt x} ,\end{equation}
where  $c_{z}(x)$ is the spatial support of the output sensor. In this work, all three spatial supports
 $b_{d}(x)$,
 $b_{u}(x)$ and
 $c_{z}(x)$ take the form of a Gaussian function
 \begin{gather} g(x ; {x}_{n}, \sigma)=\frac{1}{\sigma} \exp \left(-\left(\frac{x-{x}_{n}}{\sigma}\right)^{2}\right), \end{gather}
 \begin{gather}\text{i.e.}\quad b_{d}(x)=g(x ; {x}_{d}, \sigma_{d}), \quad b_{u}(x)=g(x ; {x}_{u}, \sigma_{u}), \quad c_{z}(x)=g(x ; {x}_{z}, \sigma_{z}). \end{gather}
We adopt the same spatial parameters used by Fabbiane et al. (Reference Fabbiane, Semeraro, Bagheri and Henningson2014), i.e.  ${x}_{d} = 35$,
 ${x}_{u} = 400$,
 ${x}_{z} = 700$ and
 $\sigma _{d} = \sigma _{u} = \sigma _{z} = 4$. In addition, the disturbance input
 $d(t)$ in (2.6) is modelled as Gaussian white noise with unit variance. In this work, we will use DRL to learn an effective control law, i.e. how the control action
 $u(t)$ in (2.6) varies with time, to suppress the perturbation downstream.
2.2. Governing equations for the 2-D boundary layer
We will also test the DRL-based control in 2-D Blasius boundary layer flows, governed by the incompressible NS equations
 \begin{equation} \frac{\partial \boldsymbol{u}}{\partial t}+\boldsymbol{u} \boldsymbol{\cdot} \boldsymbol{\nabla} \boldsymbol{u}={-}\boldsymbol{\nabla} p+\frac{1}{Re}\,\nabla^{2} \boldsymbol{u}+\boldsymbol{f}, \quad \boldsymbol{\nabla} \boldsymbol{\cdot} \boldsymbol{u}=0 , \end{equation}
where  $\boldsymbol {u}=(u, v)^{{\rm T}}$ is the velocity,
 $t$ is time,
 $p$ is the pressure, and
 $\boldsymbol {f}$ is the external forcing term. Here,
 $Re$ is the Reynolds number defined as
 $Re = U_\infty \delta _0^*/ \nu$, where
 $U_\infty$ is the free-stream velocity,
 $\delta _0^*$ is the displacement thickness of the boundary layer at the inlet of the computational domain, and
 $\nu$ is the kinematic viscosity. We non-dimensionalise the length and the velocity by
 $\delta _0^*$ and
 $U_\infty$, respectively, and use
 $Re = 1000$ in all cases, which is consistent with the value in the KS system. The computational domain is
 $\varOmega = (0, L_x) \times (0, L_y) = (0, 800) \times (0, 30)$, denoted by the grey box in figure 2. The inlet velocity profile is obtained from the laminar base flow profile (Blasius solution). At the outlet of the domain, we impose the standard free-outflow condition with
 $(p \boldsymbol{\mathsf{I}}-({1}/{Re})\,\boldsymbol {\nabla } \boldsymbol {u}) \boldsymbol {\cdot } \boldsymbol {n}=0$, where
 $\boldsymbol{\mathsf{I}}$ is the identity tensor, and
 $\boldsymbol {n}$ is the outward normal vector. At the bottom wall, we apply the no-slip boundary condition, and at the top of the domain, we apply the free-stream boundary condition with
 $u = U_\infty$ and
 ${\rm d}v/{{\rm d} y} = 0$.
The external forcing term  $\boldsymbol {f}$ in the momentum equation includes both noise input
 $d(t)$ and control output
 $u(t)$:
 \begin{equation} \boldsymbol{f}=\boldsymbol{b}_{d}(x, y) d(t)+\boldsymbol{b}_{u}(x, y) u(t) , \end{equation}
where  $\boldsymbol {b}_{d}$ and
 $\boldsymbol {b}_{u}$ are the corresponding spatial distribution functions, similar to those in (2.6) except that the current supports assume 2-D Gaussian functions:
 \begin{equation} \left.\begin{gathered} \boldsymbol{b}_{d}(x, y)=\left[\begin{array}{c} \left(y-y_{d}\right) \sigma_{x} / \sigma_{y} \\ -\left(x-x_{d}\right) \sigma_{y} / \sigma_{x} \end{array}\right] \exp \left(-\frac{\left(x-{x}_{d}\right)^{2}}{\sigma_{x}^{2}}-\frac{\left(y-{y}_{d}\right)^{2}}{\sigma_{y}^{2}}\right),\\ \boldsymbol{b}_{u}(x, y)=\left[\begin{array}{c} \left(y-y_{u}\right) \sigma_{x} / \sigma_{y} \\ -\left(x-x_{u}\right) \sigma_{y} / \sigma_{x} \end{array}\right] \exp \left(-\frac{\left(x-{x}_{u}\right)^{2}}{\sigma_{x}^{2}}-\frac{\left(y-{y}_{u}\right)^{2}}{\sigma_{y}^{2}}\right), \end{gathered}\right\}\end{equation}
where  $\sigma _x = 4$ and
 $\sigma _y = 1/4$ determine the size of the two spatial supports centred at
 $(x_d, y_d) = (35, 1)$ for noise input and
 $(x_u, y_u) = (400, 1)$ for control input, respectively. As an illustration, the streamwise and wall-normal components of the spatial support
 $\boldsymbol {b}_{d}$ are presented in figure 3, consistent with those in Belson et al. (Reference Belson, Semeraro, Rowley and Henningson2013).
Contour plots of the 2-D Gaussian spatial distribution  $\boldsymbol {b}_{d}(x, y)$: (a) streamwise component; (b) wall-normal component.

The downstream output at point  $z$ is a measurement of the local perturbation energy expressed by
 \begin{equation} z(t)=\sum_{i = 1}^{N}\left[\left(u^{i}(t)-U^{i}\right)^{2}+\left(v^{i}(t)-V^{i}\right)^{2}\right], \end{equation}
where  $N$ is the number of uniformly distributed neighbouring points around point
 $z$ at
 $(550, 1)$, and here we use a large
 $N = 78$;
 $u^i(t)$ and
 $v^i(t)$ are the instantaneous
 $x$- and
 $y$-direction velocity components at point
 $i$;
 $U^i$ and
 $V^i$ are the corresponding base flow velocities, i.e. a steady solution to the nonlinear NS equations.
The upstream noise input  $d(t)$ in (2.10) is modelled as Gaussian white noise with zero mean and standard deviation
 $2 \times 10^{-4}$. Induced by this random disturbance input, the boundary layer flow considered here exhibits the behaviour of convective instability in the form of an exponentially growing Tollmien–Schlichting (TS) wave. The objective of the DRL control is to suppress the growth of the unstable TS wave by modulating
 $u(t)$ in (2.10). In figure 2, the input and output positions are specified and will remain unchanged in our investigation, but the sensor position will be improved in an optimisation problem that will be discussed in § 4.5.
3. Numerical methods
3.1. Numerical simulation of the 1-D KS equation
We adopt the same numerical method used by Fabbiane et al. (Reference Fabbiane, Semeraro, Bagheri and Henningson2014) to solve the 1-D linearised KS equation. The equation is discretised using a finite difference method on  $n=400$ discretised grid points. The second- and fourth-order derivatives are discretised based on a centred five-node stencil, while the convective term is based on a one-node upwind scheme due to the convective feature. Boundary conditions in (2.5a–d) are implemented using four ghost nodes outside the left and right boundaries. The spatial discretisation yields the following set of finite-dimensional state-space equations (also referred to as plant hereafter):
 \begin{equation} \left.\begin{gathered}
\dot{\boldsymbol{v}}(t)
=\boldsymbol{\mathsf{A}}\,\boldsymbol{v}(t)+\boldsymbol{\mathsf{B}}_{d}\,d(t)+\boldsymbol{\mathsf{B}}_{u}\,u(t),
\\ z(t) =\boldsymbol{\mathsf{C}}_{z}\,\boldsymbol{v}(t),
\end{gathered}\right\}\end{equation}
where  $\boldsymbol {v}(t)\in R^n$ represents the discretised values at
 $n = 400$ equispaced nodes,
 $\dot {\boldsymbol {v}}(t)$ is its time derivative, and
 $\boldsymbol{\mathsf{A}}$ is the linear operator of the system. The input matrices
 $\boldsymbol{\mathsf{B}}_{d}$ and
 $\boldsymbol{\mathsf{B}}_{u}$, and output matrix
 $\boldsymbol{\mathsf{C}}_{z}$, are obtained by evaluating (2.8b) at the nodes. The implicit Crank–Nicolson method is adopted for time marching
 \begin{equation}
\boldsymbol{v}(t+\Delta t)=\boldsymbol{\mathsf{N}}_{I}^{{-}1}\left[\boldsymbol{\mathsf{N}}_{E}\,
\boldsymbol{v}(t)+\Delta
t\left(\boldsymbol{\mathsf{B}}_{d}\,d(t)+\boldsymbol{\mathsf{B}}_{u}\,
u(t)\right)\right] , \end{equation}
where  $\boldsymbol{\mathsf{N}}_{I}=\boldsymbol{\mathsf{I}}-({\Delta t}/{2})\boldsymbol{\mathsf{A}}$,
 $\boldsymbol{\mathsf{N}}_{E}=\boldsymbol{\mathsf{I}}+({\Delta t}/{2}) \boldsymbol{\mathsf{A}}$, and
 $\Delta t$ is the time step, chosen as
 $\Delta t = 1$ in the current work.
We also investigate the dynamics of the weakly nonlinear KS equation when the perturbation amplitude reaches a certain level, i.e. (2.3) together with boundary conditions (2.5a–d), in Appendix A. Compared with the linear plant described by (3.1), the weakly nonlinear plant has an additional nonlinear term on the right-hand side:
 \begin{equation} \left.\begin{gathered} \dot{\boldsymbol{v}}(t) =\boldsymbol{\mathsf{A}}\,\boldsymbol{v}(t)+\boldsymbol{\mathsf{B}}_{d}\,d(t)+\boldsymbol{\mathsf{B}}_{u}\,u(t)+ \boldsymbol{\mathsf{N}} (\boldsymbol{v}(t)),\\ z(t) =\boldsymbol{\mathsf{C}}_{z}\,\boldsymbol{v}(t), \end{gathered}\right\}\end{equation}
where  $\boldsymbol{\mathsf{N}}$ represents the nonlinear operator. In terms of the time marching of (3.3), we adopt a third-order semi-implicit Runge–Kutta scheme proposed by Kar (Reference Kar2006) and also used by Bucci et al. (Reference Bucci, Semeraro, Allauzen, Wisniewski, Cordier and Mathelin2019) and Zeng & Graham (Reference Zeng and Graham2021), in which the nonlinear and external forcing terms are time-marched explicitly, while the linear term is marched implicitly using a trapezoidal rule.
It should be noted that the models given by  $\boldsymbol{\mathsf{A}}$,
 $\boldsymbol{\mathsf{B}}_{u}$ and
 $\boldsymbol{\mathsf{C}}_{z}$ are only for the purpose of numerical simulations, but not for the controller design. A DRL-based controller has no awareness of the existence of such models; it learns the control law from scratch through interacting with the environment and is thus model-free and data-driven, unlike the model-based controllers whose design depends specifically on such models.
3.2. Direct numerical simulation of the 2-D Blasius boundary layer
Flow simulations are performed to solve (2.9a,b) in the computational domain  $\varOmega$ using the open source Nek5000 solver (Fischer, Lottes & Kerkemeier Reference Fischer, Lottes and Kerkemeier2017). The spatial discretisation is implemented using the spectral element method, where the velocity space in each element is spanned by the
 $K$th-order Legendre polynomial interpolants based on the Gauss–Lobatto–Legendre quadrature points. According to the mesh convergence study (not shown), we finally choose a specific mesh composed of 870 elements of the order
 $K = 7$, with the local refinement implemented close to the wall. In terms of the time integration, the two-step backward differentiation scheme is adopted in the unsteady simulations, with time step
 $5 \times 10^{-2}$ unit times, and the initial flow field is constructed from similarity solutions of the boundary layer equations.
3.3. Deep reinforcement learning
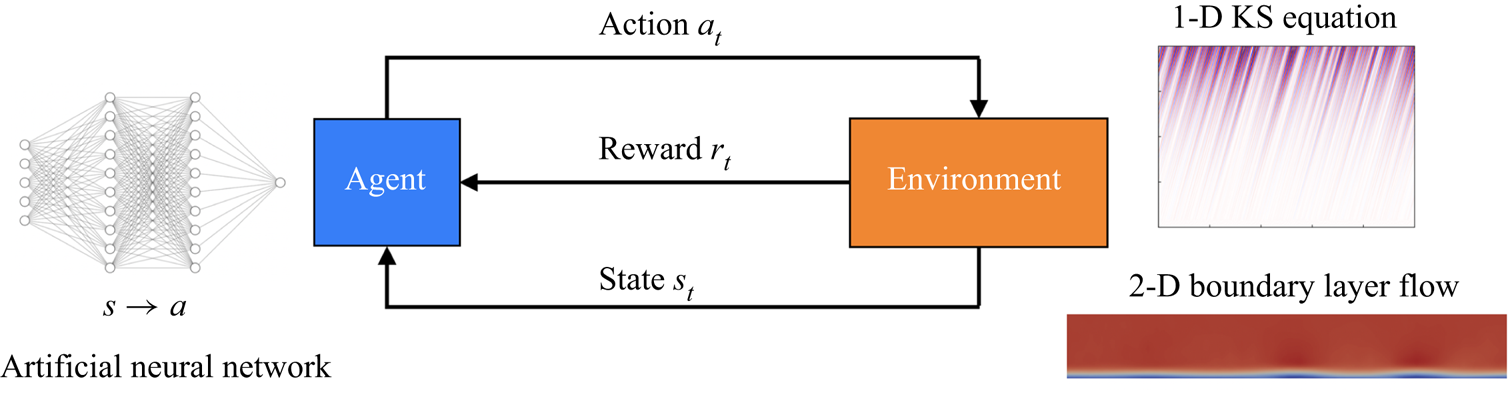
In the context of a DRL-based method, the control agent learns a specific control policy via interaction with the environment. The DRL framework in this work is shown in figure 4, where the agent is represented by an artificial neural network and the environment corresponds to the numerical simulation of the 1-D KS equation or the 2-D boundary layer, as explained above. In general, the DRL works as follows: first, the agent receives states  $s_t$ from the environment; then an action
 $a_t$ is determined based on the states and is exerted on the environment; finally, the environment returns a reward signal
 $r_t$ to evaluate the quality of the previous actions. This loop continues until the training process converges, i.e. the expected cumulative reward is maximised for each training episode.
The reinforcement learning framework in flow control. The agent is an artificial neural network; the environment is a numerical simulation of the 1-D KS equation or 2-D boundary layer flow. Action is adjustment of the external forcing; reward is reduction of the downstream perturbation; and state is streamwise velocities collected by sensors.
In the current setting of both KS equation and boundary layer flows, states refer to the streamwise velocities collected by sensors. Since the amplitude of velocity differs at different locations, states are normalised by their respective mean values and standard deviations before they are input to the agent. The number and position of sensors are determined from an optimisation process to be detailed in § 4.5. Action corresponds to  $u(t)$ in both (2.6) and (2.10), with predefined ranges
 $[-5, 5]$ and
 $[-0.01, 0.01]$, respectively. Each control action is exerted on the environment for a duration of 30 numerical time steps before the next update. This operation is the so-called sticky action, which is a common choice in DRL-based flow control (Rabault & Kuhnle Reference Rabault and Kuhnle2019; Rabault et al. Reference Rabault, Kuchta, Jensen, Réglade and Cerardi2019; Beintema et al. Reference Beintema, Corbetta, Biferale and Toschi2020). Allowing quicker actions may be detrimental to the overall performance since the action needs some time to make an impact on the environment (Burda et al. Reference Burda, Edwards, Pathak, Storkey, Darrell and Efros2018). The last crucial component in the DRL framework is reward, which is related directly to the control objective. For the 1-D KS system, the reward is defined as the negative perturbation amplitude measured by the output sensor, i.e. the negative root-mean-square (r.m.s.) value of
 $z(t)$ in (2.7), while for the 2-D boundary layer flow, the reward is defined as the negative local perturbation energy measured around point
 $z$, i.e.
 $-z(t)$ in (2.12). However, due to the time delay effect in convective flows, the instantaneous reward is not a real response to the current action. To remedy the time mismatch, we store the simulation data first and retrieve them later after the action has reached the output sensor. This operation helps the agent to perceive the dynamics of the environment in a time-matched way, and thus leads to a good training result. For details on the time delay and how to remove it, the reader can refer to Appendix B. In addition, we also consider a stability-enhanced design for the reward function, which will penalise the flow instability and further improve the control performance (Appendix C).
In terms of the training algorithm for the agent, since the action space is continuous, we adopt a policy-based algorithm named the deep deterministic policy gradient (DDPG), which is essentially a typical actor–critic network structure (Sutton & Barto Reference Sutton and Barto2018). This method has also been used in other DRL works (Koizumi et al. Reference Koizumi, Tsutsumi and Shima2010; Bucci et al. Reference Bucci, Semeraro, Allauzen, Wisniewski, Cordier and Mathelin2019; Zeng & Graham Reference Zeng and Graham2021; Kim et al. Reference Kim, Kim, Kim and Lee2022; Pino et al. Reference Pino, Schena, Rabault, Kuhnle and Mendez2022). The actor network  $\mu _{\phi }(s)$, also known as the policy network, is parametrised by
 $\phi$ and outputs an action
 $a$ to be applied to the environment for a given state
 $s$. The aim of the actor is to find an optimal policy that maximises the expected cumulative reward, which is predicted by the critic network
 $Q_{\theta }(s, a)$ parametrised by
 $\theta$. The loss function
 $L(\theta )$ for updating the parameters of the critic reads
 \begin{equation} L(\theta)=\underset{\left(s, a, r, s^{\prime}\right) \sim \mathcal{D}}{\mathbb{E}}\left[\tfrac{1}{2}\left(\left[r(s, a)+\gamma Q_{\theta_{{targ }}}\left(s^{\prime}, \mu_{\phi_{{targ}}}(s^{\prime})\right)\right]-Q_{\theta}(s, a)\right)^{2}\right] ,\end{equation}
where  $\mathbb {E}$ represents the expectation of all transition data
 $(s, a, r, s^{\prime })$ in sequence
 $\mathcal {D}$;
 $s$,
 $a$ and
 $r$ are the state, action and reward for the current step, respectively, and
 $s^{\prime }$ is the state for the next step. The right-hand side of the equation calculates the typical error in reinforcement learning, i.e. temporal-difference error, and
 $\gamma$ is the discount factor selected as 0.95 here. The objective function
 $L(\phi )$ for updating the parameters of the actor is obtained straightforwardly as
 \begin{equation} L(\phi)={-}\underset{s \sim \mathcal{D}}{\mathbb{E}}\left[Q_{\theta}\left(s, \mu_{\phi}(s)\right)\right] . \end{equation}
It should be noted that although the actor aims to maximise the  $Q$ value predicted by the critic, only gradient descent rather than gradient ascent is embedded in the adopted optimiser. Thus a negative sign is introduced on the right-hand side of (3.5).
In addition, some technical tricks such as experience memory replay and a combination of evaluation net and target net are embedded in the DDPG algorithm, in order to cut off the correlation among data and improve the stability of training. More technical details on DDPG can be found in Silver et al. (Reference Silver, Lever, Heess, Degris, Wierstra and Riedmiller2014) and Lillicrap et al. (Reference Lillicrap, Hunt, Pritzel, Heess, Erez, Tassa, Silver and Wierstra2015). For other hyperparameters used in the current study, the reader can refer to Appendix B.
3.4. Particle swarm optimisation
As mentioned earlier, sensors are used to collect flow information from the environment as feedback to the DRL-based controller. Therefore, the sensor placement plays an important role in determining the final control performance. Some studies investigated the optimal sensor placement issue in the context of flow control using an adjoint-based gradient descent method. In these studies, gradients of the objective function with respect to the sensor positions can be obtained exactly using explicit equations involved in the model-based controllers (Chen & Rowley Reference Chen and Rowley2011; Belson et al. Reference Belson, Semeraro, Rowley and Henningson2013; Oehler & Illingworth Reference Oehler and Illingworth2018; Sashittal & Bodony Reference Sashittal and Bodony2021). However, in our work, DRL-based control is model-free and such gradient information is unavailable. Therefore, we adopt a gradient-free method called particle swarm optimisation (PSO) to determine the optimal sensor placement in DRL.
PSO is a type of evolutionary optimisation method that mimics the bird flock preying behaviour and was originally proposed by Kennedy & Eberhart (Reference Kennedy and Eberhart1995). For an optimisation problem expressed by
 \begin{equation} y = f(x_1, x_2,\ldots,x_D), \end{equation}
where  $y$ is the objective function and
 $x_1, x_2,\ldots,x_D$ are
 $D$ design variables, PSO trains a swarm of particles that move around in the searching space bounded by the lower and upper boundaries, and update their positions iteratively according to the rule
 \begin{gather} v_{i d}^{k}= w v_{i d}^{k-1}+c_{1} r_{1}\left(p_{i d}^{best}-x_{i d}^{k-1}\right)+c_{2} r_{2}\left(s_{d}^{best}- x_{i d}^{k-1}\right) , \end{gather}
 \begin{gather}x_{i d}^{k}=x_{i d}^{k-1}+v_{i d}^{k-1} , \end{gather}
where  $v_{i d}^{k}$ is the
 $d$th-dimensional velocity of particle
 $i$ at the
 $k$th iteration, and
 $x_{i d}^{k}$ is the corresponding position. The first term on the right-hand side of (3.7a) is the inertial term, representing its memory on the previous state, with
 $w$ being the weight. The second term is called self-cognition, representing learning from its own experience, where
 $p_{i d}^{best}$ is the best
 $d$th-dimensional position that the particle
 $i$ has ever found for the minimum
 $y$. The third term is called social cognition, representing learning from other particles, where
 $s_{d}^{best}$ is the best
 $d$th-dimensional position among all the particles in the swarm. In (3.7b),
 $c_1$ and
 $c_2$ are scaling factors, and
 $r_1$ and
 $r_2$ are cognitive coefficients. After the iteration process converges, these particles will gather near a specific position in the search space, and this is the optimised solution.
For the optimal sensor placement in our case, design variables in (3.6) are sensor positions  $x_1, x_2,\ldots, x_n$ (where
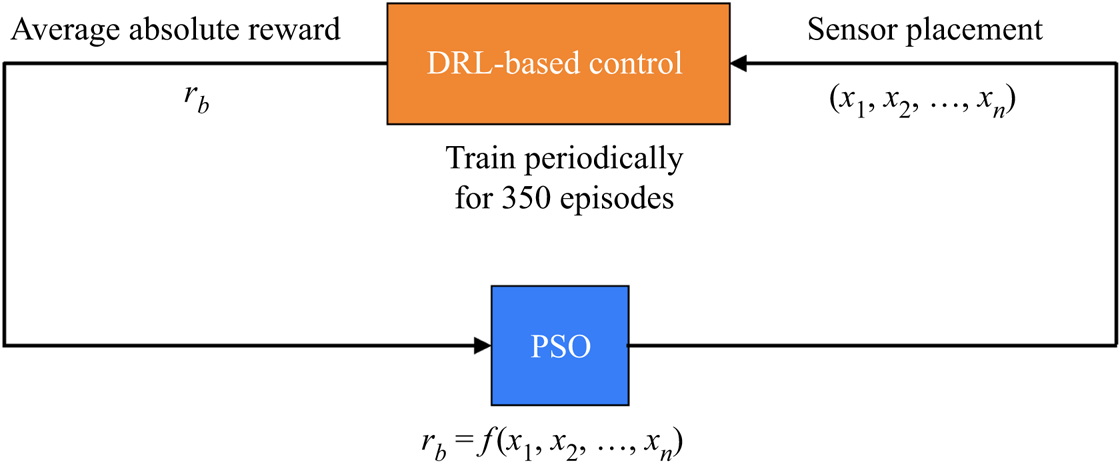
 $n$ is the number of sensors), and the objective function is related to the DRL-based control performance given the current sensor placement. As shown in figure 5, a specific sensor placement is input to the DRL-based control framework. The DRL training is then executed for 350 episodes – this number will be explained in § 4.2. For each episode, we keep a record of the absolute reward values for the action sequence, and take the average of them as the objective function for this episode, denoted by
 $r_a$. In this sense, the quantity
 $r_a$ is representative of the average perturbation amplitude monitored at the downstream location
 $x = 700$ for one training episode. In addition, the upstream noise is random and varies for different training episodes, so we take the average of
 $r_a$ from the 10 best training episodes, denoted by
 $r_b$, as a good approximation to the test control performance. Then
 $r_b$ is used as the objective function (
 $y$) in (3.6) in the PSO algorithm based on the Pyswarm package developed by Miranda (Reference Miranda2018). The swarm size is selected as 50, and all the scaling factors are set by default as 0.5. After a number of iterations, the algorithm converges and the optimal sensor placement is found. The results in §§ 4.2–4.4 are based on the optimal sensor placement, and the optimisation process is presented in § 4.5.
Schematic diagram for sensor placement optimisation. Design variables are  $n$ sensor positions
 $x_1, x_2,\ldots, x_n$. The objective function is the DRL-based control performance quantified by the average absolute value of reward
 $r_b$ from the 10 best episodes among all the 350 episodes.
4. Results and discussion
4.1. Dynamics of the 1-D linearised KS equation
As introduced in § 2, the 1-D linearised KS equation is an idealised equation for modelling the perturbation evolving in a Blasius boundary layer flow, with features such as non-normality, convective instability and a large time delay. Without control, the spatiotemporal dynamics of the KS equation subjected to upstream Gaussian white noise is presented in figure 6(a), where the perturbation is amplified significantly while travelling downstream, and the pattern of parallel slashes demonstrates the presence of a time delay. Figure 6(b) presents the temporal signal of noise with unit variance, and figure 6(c) displays the output signal at  $x=700$.
Dynamics of the 1-D linearised KS equation when subject to Gaussian white noise with unit variance: (a) spatiotemporal response of the system; (b) temporal signal of noise input  $d(t)$ at
 $x = 35$; (c) output signal
 $z(t)$ measured by sensor at
 $x = 700$. The blue arrow represents input, and the red arrow represents output.

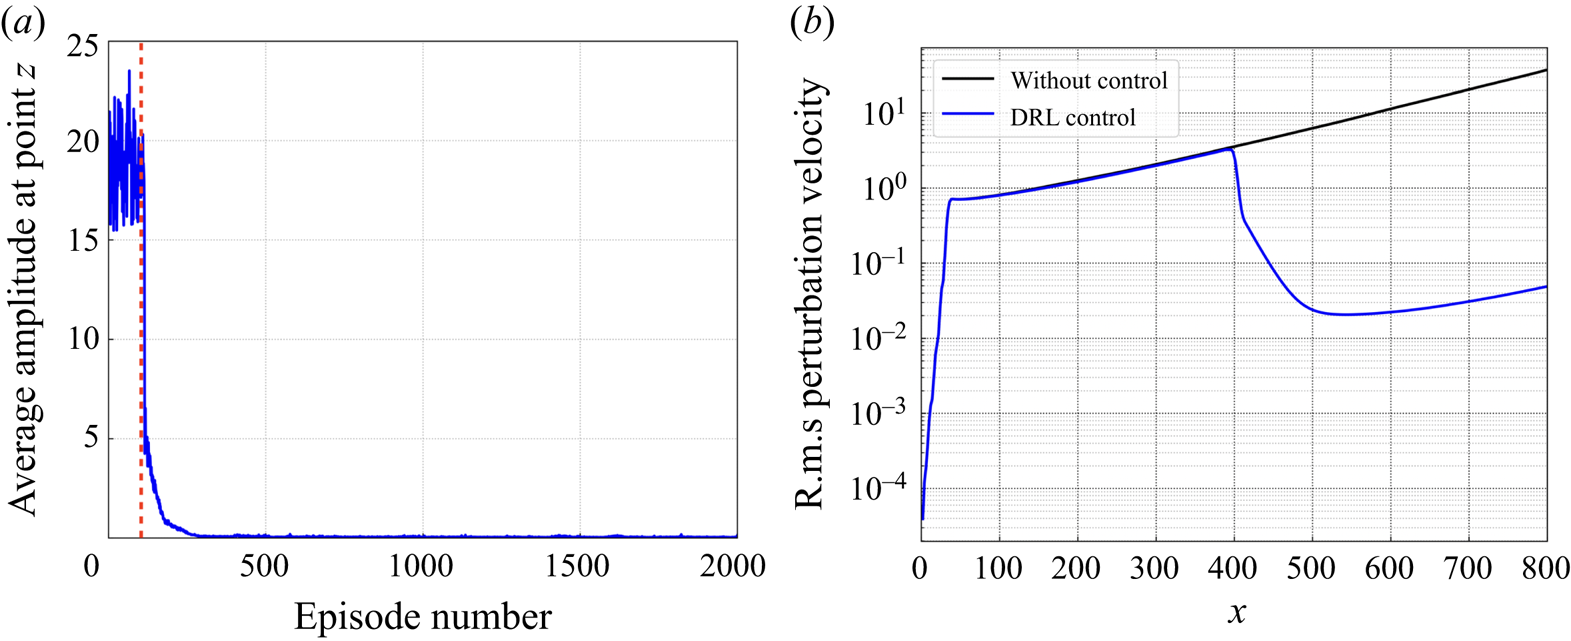
Due to the existence of linear instability in the flow, the amplitude of perturbation grows exponentially along the  $x$-direction, which is verified by the black curve in figure 7(b), where the r.m.s. value of perturbation calculated by
 \begin{equation} v^{\prime}(x)|_{rms}=\sqrt{\left(\overline{v^{\prime}(x)^{2}}-\overline{v^{\prime}(x)}^{2}\right)} \end{equation}
is plotted along the 1-D domain, and here  $\overline {v^{\prime }(x)}$ represents the time average of the perturbation velocity at a particular position
 $x$. In addition, by comparing figures 6(b) and 6(c), we find that the perturbation amplitude increases but some frequencies are filtered by the system. This is because when a white noise is introduced, a broadband of frequencies are excited. However, only frequencies corresponding to a certain range of wavelengths are unstable and amplified in the flow. This is the main trait of a convectively unstable flow, plus the nonlinearity of the flow system, rendering it difficult for flow control. Such a flow is usually coined as a noise amplifier in the hydrodynamic stability context (Huerre & Monkewitz Reference Huerre and Monkewitz1990).
DRL-based control for reducing the downstream perturbation evolving in the 1-D linearised KS equation. (a) Average perturbation amplitude at point  $z$ recorded during the training process, where the red dashed line denotes the time when the experience memory is full. (b) The r.m.s. value of perturbation along the 1-D domain plotted for both cases, with and without control.
4.2. DRL-based control of the KS system
In this subsection, we present the performance of DRL-based control on reducing the downstream perturbation evolving in the KS system. The training process is shown in figure 7(a), where the average perturbation amplitude at point  $z$ (
 $x = 700$; see figure 2) is plotted for all the training episodes. In the initial stage of training, the perturbation amplitude is large and shows no sign of decreasing, which corresponds to the filling process of experience memory in the DDPG algorithm. Once the memory is full (denoted by the red dashed line in figure 7a), the learning process begins and the amplitude decreases significantly to a value near zero, and remains almost unchanged after 350 episodes, indicating that the policy network has converged and the optimal control policy has been learnt. Note that this explains the periodical training of 350 episodes when we implement the PSO algorithm, as mentioned in § 3.4. Then we test the learnt policy by applying it to the KS environment for 10 000 time steps, with both the external disturbance input
 $d(t)$ and control input
 $u(t)$ turned on.
The spatiotemporal response of the controlled KS system is shown in figure 8(a), subjected to the noise input as shown in figure 8(b). Compared with that in figure 6(a), the downstream perturbation is significantly suppressed after the implementation of control action at  $x = 400$ starting from
 $t = 1450$ (denoted by the blue dashed line). By observing figures 8(c) and 8(d), we find that there is a short time delay between the control starting time and the time when the downstream perturbation
 $z(t)$ starts to decline. This is due to the convective nature that the action needs some time to make an impact downstream. In addition, we also plot the r.m.s. value of perturbation along the 1-D domain, as shown by the blue curve in figure 7(b). In contrast to the originally exponential growth, with the DRL-based control, the perturbation amplitude is largely reduced downstream of the control position (
 $x = 400$). For instance, the amplitude at
 $x = 700$ is reduced from about 20 to 0.03, which demonstrates the effectiveness of the DRL-based method in controlling the perturbation evolving in the 1-D KS system.
Dynamics of the 1-D linearised KS equation with both the external disturbance and control inputs: (a) spatiotemporal response of the system; (b) temporal signal of noise input  $d(t)$ at
 $x = 35$; (c) temporal signal of control input
 $u(t)$ at
 $x = 400$ provided by the DRL agent; (d) output signal
 $z(t)$ measured by sensor at
 $x = 700$. The blue arrows represent inputs, and the red arrow represents output; the blue dashed line denotes the control starting time.

4.3. Comparison between DRL and model-based LQR
In order to better evaluate the performance of DRL applied to the 1-D KS equation, we compare the DRL-controlled results with those of the classical linear quadratic regulator (LQR) method. The LQR method for controlling the KS equation has been explained in detail in Fabbiane et al. (Reference Fabbiane, Semeraro, Bagheri and Henningson2014). For the basics of LQR, the reader may consult Appendix D.
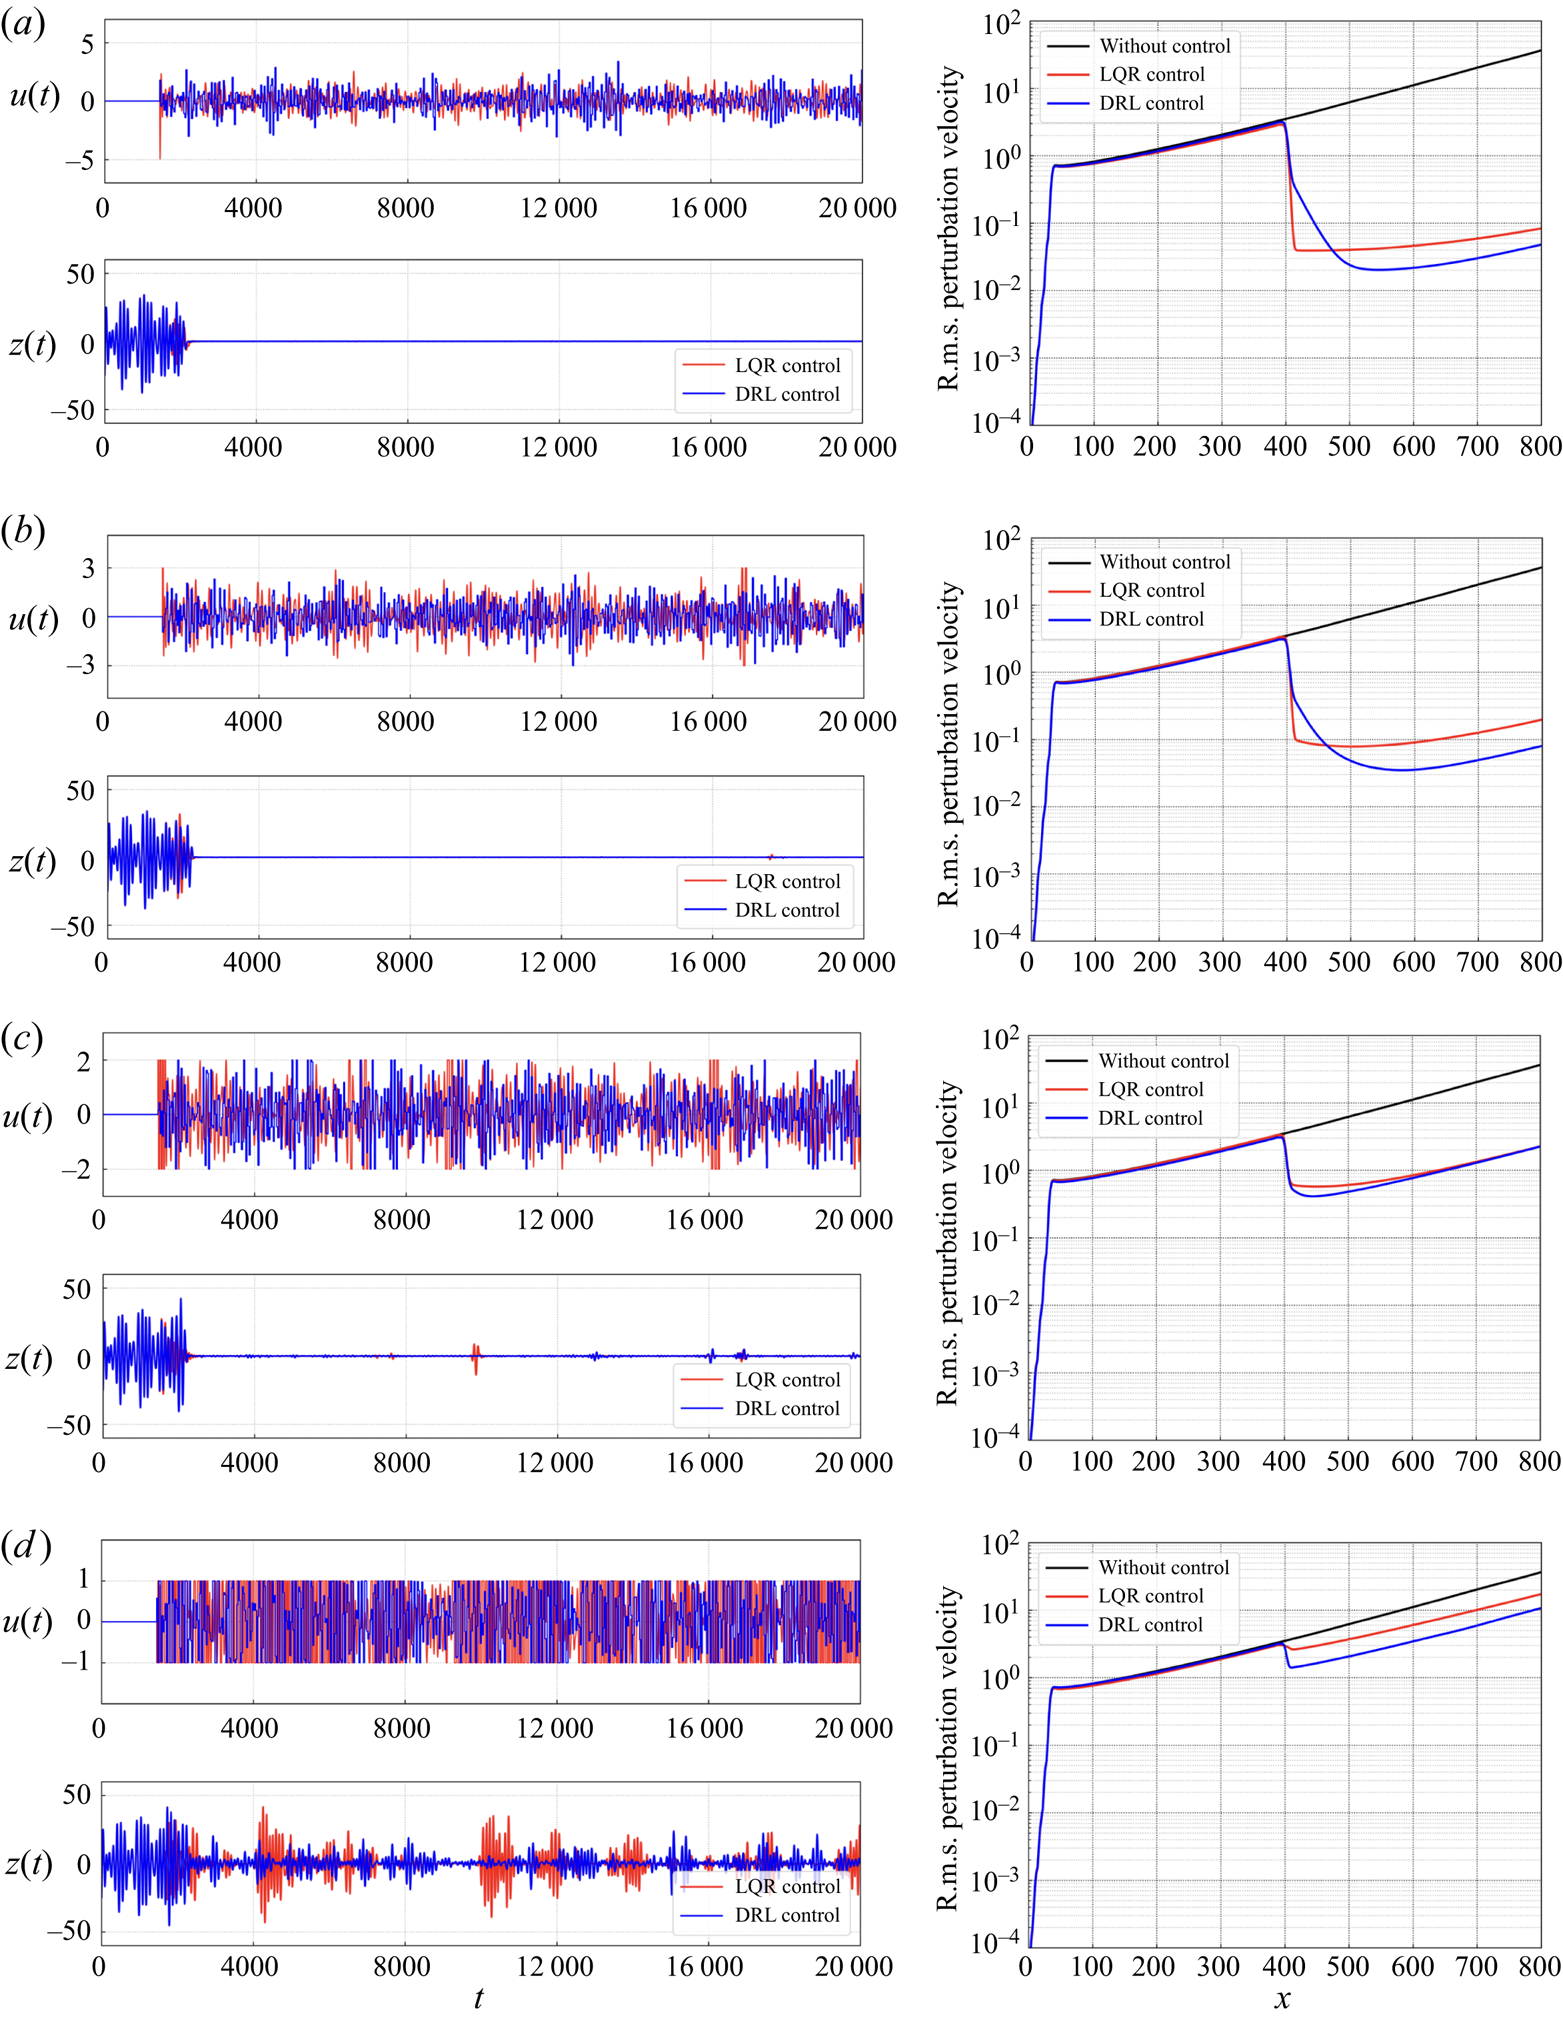
Ideally, if there are no action bounds imposed on LQR, then it will generate the optimal control performance as shown in the red curves in figure 9(a), and we call it the ideal LQR control. It is shown that the perturbation amplitude downstream of the actuator position is reduced dramatically, and the corresponding action happens to be in the range  $[-5, 5]$. Thus for a consistent comparison of LQR and DRL, we apply the same action bound
 $[-5, 5]$ to DRL-based control, and present the resulting control performance as blue curves. It is found that the DRL-based control is slightly better than the LQR control in reducing the downstream perturbation, as shown in the right-hand plot of figure 9(a). Despite the fact that in the near downstream region from
 $x = 400$ to
 $x = 470$, the amplitude of DRL-based control is higher than that of LQR control, the reduction of perturbation is more significant in the DRL control in a further downstream region.
Comparison between DRL-based control and LQR control when applied to the 1-D linearised KS system with different action bounds. In each panel, the top left plot presents the time-variation curve of the control action  $u(t)$, and the bottom left plot presents the corresponding sensor output
 $z(t)$; the right-hand plot shows the r.m.s. value of perturbation velocity along the 1-D domain. (a) Control performance of ideal LQR and of DRL with action bound
 ${[-5,5]}$. (b) Control performance of LQR and DRL both with action bound
 ${[-3,3]}$. (c) Control performance of LQR and DRL both with action bound
 ${[-2,2]}$. (d) Control performance of LQR and DRL both with action bound
 ${[-1,1]}$.
In real control applications, one needs to consider the saturation effect of the actuators, and this is realised by imposing the action bound (Grundmann & Tropea Reference Grundmann and Tropea2008; Corke, Enloe & Wilkinson Reference Corke, Enloe and Wilkinson2010). Here, we adopt the method used by Fabbiane et al. (Reference Fabbiane, Semeraro, Bagheri and Henningson2014) to bound the LQR control action as
 \begin{equation} u_{L Q R}= \begin{cases}u_{L Q R} & \text{if } \bar{u}_{min }< u_{L Q R}<\bar{u}_{max }, \\ \bar{u}_{min } & \text{if } \bar{u}_{min } \geqslant u_{L Q R}, \\ \bar{u}_{max } & \text{if } \bar{u}_{max } \leqslant u_{L Q R}. \end{cases} \end{equation}
We first impose the same action bound  $[-3, 3]$ on both LQR and DRL-based control, and compare their control performance in figure 9(b). When the saturation function is applied to the LQR control signal, the controller becomes sub-optimal, and its performance to reduce the perturbation becomes worse. It is observed that at about
 $t = 17\,000$, the action is saturated, thus there appears a small spike later in the output signal
 $z(t)$, as shown in the bottom left plot of figure 9(b). On the other hand, the DRL-based control also performs slightly worse with the smaller action range, but it still outperforms LQR control with the same action bound. Next, we further narrow down the action range to
 $[-2, 2]$, and this time both LQR and DRL-based control deteriorate due to the saturation of action, and their control performances are at a similar level, as shown in figure 9(c). Finally, we further limit the action range to
 $[-1, 1]$ and compare the corresponding control performances of the two methods in figure 9(d). In this condition, the LQR controller deteriorates severely, and the reduction of downstream perturbation is rather limited. In contrast, DRL-based control performs better, with a relatively clear trend of reduction of perturbation downstream of the actuator position, although the extent of reduction is not significant compared to the previous cases with larger action bounds, as shown in figures 9(a–c). We would like to emphasise that compared to the model-based LQR method, the DRL-based method is totally model-free, which means that the control law is learnt with no awareness of the assumed models of the plant, as mentioned in § 3.1. In addition, the control action is determined based solely on states collected by some sensors from the flow field, instead of the full knowledge of the plant as required by LQR control.
The current LQR controller is based on a specific selection of weights, i.e.  $w_z = w_u = 1$ as given in (D2). This selection was adopted by Fabbiane et al. (Reference Fabbiane, Semeraro, Bagheri and Henningson2014), indicating that equal weight has been assigned to the two parts, i.e. sensor output
 $z(t)$ and control input
 $u(t)$. These parameters influence the control performance of LQR. For example, the LQR performance can be improved by increasing the weight
 $w_z$ from 1 to 10 and 100 with a fixed
 $w_u$ at 1 (which means that we focus more on the output part). The results are shown in figure 10(a). However, the ensuing problem is that with the increase of
 $w_z$, the magnitude of control action will experience a rapid increase at the very initial stage of the control process, as shown in figure 10(b), which is unavoidable because larger weight is considered to force the output to the target value as soon as possible, and this is realised by a larger action in the beginning. In realistic applications, the choice of weights is a trade-off between the control performance and the available range of control action.
Comparison of LQR control performance with different values of weight  $w_z$. (a) The r.m.s. value of perturbation velocity along the 1-D domain. (b) The time-variation curves of control action
 $u(t)$, with the control starting at
 $t = 1450$.

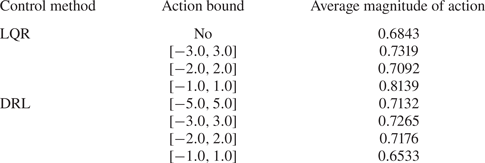
In addition to the control performance, the cost of energy effort is another important factor in active flow control. The cost of energy effort in our context can be quantified by the average magnitude of action during the control process. We compare this aspect for the two methods in table 1, which shows that the average magnitudes of action for the two methods are in general comparable to each other, except that in the case of the smallest action bound  $[-1,1]$, the averaged action of DRL is about 20 % less than that of LQR.
Average magnitude of action for different methods with different action bounds.
4.4. Robustness of the DRL policy in controlling convectively unstable flows
In this section, we test the robustness of the learnt control policy to two types of noise, i.e. measurement noise and external noise. In realistic conditions, the states collected by sensors are always subjected to noise, and we call it measurement noise. We consider this effect by adding Gaussian noise with standard deviations  $\sigma _N=0.01$, 0.05 and 0.1, respectively, to the original states, and test the robustness of the learnt policy, which was trained with
 $\sigma _N=0$ to the measurement noise of different levels. As shown in figures 11(a–c), with the increase of noise level, the overall result is still satisfactory except that the DRL-based control performance deteriorates in the sense that there are some small oscillations being monitored in the sensor output
 $z(t)$. We plot the corresponding r.m.s. value of perturbation along the 1-D domain in figure 11(d), where the control performance with uncontaminated states, i.e.
 $\sigma _N = 0$, is also shown by the black curve, for comparison. With the noise level increasing to 0.1 (accounting for about 10 % of the originally normalised state signals), the controlled amplitude of
 $z(t)$ at
 $x = 700$ increases from 0.03 to 1.0. Despite the slight deterioration of the control performance with the increased noise level, the current policy is still effective in reducing the downstream perturbation (recall that the uncontrolled amplitude at
 $x=700$ is 20). We have also attempted to train a DRL agent with
 $\sigma _N = 0.1$ and test it in the same condition. The resulting control performance is depicted by the orange dashed curve in figure 11(d), and it can be seen that the result is close to the orange solid curve, which was obtained from the agent trained with
 $\sigma _N = 0$ but tested with
 $\sigma _N = 0.1$. Therefore, the DRL agent is robust in the sense that once trained, it can effectively control a new flow situation with some additional noise. This robustness property benefits from the closed-loop nature of the control system and the decorrelation of noise among state observations, as explained by Paris et al. (Reference Paris, Beneddine and Dandois2021). More specifically, the action error caused by measurement noise does not accumulate over time since the feedback state is able to rectify the previous erroneous action and prevent it from deviating too far.
DRL-based control performance with states contaminated by Gaussian noise of three different standard deviations  $\sigma _N$. (a–c) The sensor output
 $z(t)$ plotted for the three cases. (d) The r.m.s. value of perturbation along the 1-D domain plotted for the three cases. Also, the black curve for control with uncontaminated states, and the orange dashed curve for control with the agent trained with
 $\sigma _N = 0.1$, are shown for comparison.

The second type of noise is the external noise. The current policy was trained under a fixed external noise condition, i.e. white noise input at  $x_d = 35$ with a unit standard deviation
 $\sigma _{d(t)} = 1.0$. We want to test whether the current policy is still valid in new external noise situations. For instance, we can move the noise position from
 $x_d = 35$ to
 $x_d = 75$ with the noise level unchanged, or increase the noise level from
 $\sigma _{d(t)} = 1.0$ to
 $\sigma _{d(t)} = 1.5$ with the noise position unchanged, or change both of them. We test the control policy in such new environments, and plot the obtained control performance in figure 12. Due to the increase of noise level and/or the shift of noise position, the perturbation fields upstream of the control position are only trivially different from each other, as shown in figure 12(d). Once the DRL-based control is applied, the downstream perturbation is reduced significantly, as demonstrated in figure 12. This robustness property benefits from the state normalisation process as mentioned in § 3.3, which has also been demonstrated in Paris et al. (Reference Paris, Beneddine and Dandois2021). Among the three testing cases, the second one (
 $x_d = 35$ and
 $\sigma _{d(t)} = 1.5$), depicted by the green curve in figure 12, leads to a relatively large downstream perturbation. This is due to the fact that the uncontrolled perturbation level increases (depicted by the green dashed curve in figure 12d) and sometimes is out of the current action range
 $[-5, 5]$, which will lead to the small spikes as shown in figure 12(b).
DRL-based control performance under three different upstream noise conditions: Gaussian noise input at  $x_d$ with standard deviation
 $\sigma _{d(t)}$. (a–c) The sensor output
 $z(t)$ plotted for the three cases. (d) The r.m.s. value of perturbation along the 1-D domain plotted for the three cases, and that for control testing with the same environment as training, i.e.
 $x_d = 35$ and
 $\sigma _{d(t)} = 1.0$, is also given by the black curve, for comparison.

Finally, we would like to mention that in the confined cylinder wake flow as studied by Rabault et al. (Reference Rabault, Kuchta, Jensen, Réglade and Cerardi2019), Paris et al. (Reference Paris, Beneddine and Dandois2021) and Li & Zhang (Reference Li and Zhang2022), the nature of flow instability is locally absolute; cf. Monkewitz & Nguyen (Reference Monkewitz and Nguyen1987) and Giannetti & Luchini (Reference Giannetti and Luchini2007) for the general theory of flow instability in unconfined wake flows, or see the flow stability and sensitivity analyses in Li & Zhang (Reference Li and Zhang2022) for the confined wake flow. In such a flow, the noise level is only secondary compared to the primary absolute instability mechanism accounting for the perturbation amplification; cf. Huerre & Monkewitz (Reference Huerre and Monkewitz1990) for a classical review of the absolute and convective instabilities. On the other hand, in the case of the KS equation or boundary layer flows, the nature of instability is convective, for which the perturbation amplification depends more critically on the upstream noise. Our numerical demonstration of the DRL control in the convectively unstable flow is a stricter test of its robustness and proves its applicability in such flows.
4.5. Optimisation of the sensor placement
All the above results are obtained based on the optimal sensor placement. In this subsection, we explain how the optimal sensor placement has been identified. As mentioned in § 3.4, we adopt the PSO method to find the optimal sensor placement. Before searching for the optimal sensor positions, we need to specify lower and upper bounds for the searching space. In the current work, we investigate different cases with 1, 2, 4, 6, 8 and 10 sensors located in  $x\in (370,430)$. This range is determined through our preliminary tests. We have attempted to add more sensors outside the current range, and found that they had unimportant effects on the final control performance.
The optimisation processes for all the considered cases are presented in figure 13(a), where the trends of the curves are similar. Here, we take the case with two sensors as an example to illustrate this process. The initial placement of the sensors is random. After the first iteration, the algorithm returns an initial sensor placement (denoted by the green point) that all the particles in the swarm have ever found, which corresponds to the lowest objective function  $r_b$ so far, as defined in § 3.4. Then, based on the initial placement, the particles attempt to find a new placement, which leads to a lower
 $r_b$ in the next iteration. Finally, after a number of iterations, the searching process converges, and the optimal placement is identified, denoted by the blue point. To demonstrate the effectiveness of the optimisation, we compare the control performance given by the initial sensor placement and the optimised one. As shown in figure 13(b), the optimised placement indeed results in a better control performance, i.e. a lower perturbation amplitude at the downstream position
 $x_z = 700$ than that of the unoptimised one.
Optimal sensor placement in DRL-based flow control. (a) The optimisation process using PSO presented for cases with different numbers of sensors; the optimal placement is found, which leads to the lowest perturbation amplitude  $r_b$. (b) Control performance comparison between the initial placement and the optimised one (taking 2 sensors as an example).

The optimised sensor layouts with different numbers of sensors are presented in figure 14(a), where dots represent the optimised sensor placements (OSPs), named as OSP plus the number of sensors, and the actuator position is also given as a reference. As suggested by one of the reviewers, we will test whether using sensors only upstream of the actuator is sufficient for control. To do so, we consider three newly added sensor placements, as shown by crosses in figure 14(a), among which: SP1 is a four-sensor layout with the downstream sensors removed from OSP8; SP2 is a five-sensor layout with the downstream sensors removed from OSP10; and SP3 is the uniformly spaced four-sensor layout upstream of the actuator that is scaled by the parallel slash pattern as shown in figure 6(a).
Optimal sensor placement and the effect of the number of sensors. (a) The optimal placement is presented for cases with different numbers of sensors. In addition, three specific layouts with all sensors placed upstream are also considered. (b) Comparison of the corresponding control performance with different sensor placements.

The corresponding control performance is presented in figure 14(b), where the r.m.s. value of perturbation along the 1-D domain is plotted. It is shown that if only one sensor is used, it is better to place it upstream of the actuator rather than downstream, to help the agent detect the upcoming disturbance. Nevertheless, due to the implementation of sticky actions where the control action keeps constant every 30 time steps, a single upstream sensor can inform the agent of only a single upcoming parallel slash in a packet of slashes that crosses the actuator over the duration that the action is ‘stuck’. As the slashes are generated by random noise, it is not possible for the agent to choose an action that accounts for the packet of slashes based on a single measurement. With more sensors placed upstream, it is more likely that the agent will be fully informed to select the best sticky action to suppress the packet. This hypothesis is verified by the fact that the performance of the three layouts SP1, SP2 and SP3 (crosses in figure 14a) is better than that of OSP1 and OSP2 (one upstream and one downstream). However, the four-sensor layout with all sensors placed upstream is inferior to OSP4 (two upstream and two downstream), which indicates that the downstream sensors are also necessary for a better control performance. This is determined by the inherent feature of the DRL framework, where the agent interacts with the environment in a closed loop. After the agent imposes an action on the environment, the environment needs to return states as feedback that determines the next action. Overall, with the number of sensors increasing from 1 to 8, the resulting control performance is improved continuously, as expected since more sensors will provide a more complete measurement of the flow environment. However, in the current case, as the number of sensors is increased further, from 8 to 10, no further improvement is observed, which indicates that the information given by the two additional sensors is redundant. That is the reason why we adopt eight sensors in § 3.3, and the placement of them is depicted by the purple points in figure 14(a).
Some discussions on the role of sensors in DRL control are in order. In the model-free DRL framework, sensors are used to collect states that not only provide a measurement of the flow environment but also reflect the effect of the action after it is taken. In this context, a proper number of sensors should be placed both upstream and downstream of the actuator. In contrast, in traditional model-based control methods such as the linear quadratic Gaussian regulator, the sensor is used to estimate the full states of the plant via the Kalman filter, and then the control action is calculated based on the estimated states. In this situation, one sensor can usually work well since this demonstration does not implement sticky actions and is able to observe each slash individually that passes through, and actuate accordingly. For instance, Belson et al. (Reference Belson, Semeraro, Rowley and Henningson2013) investigated the effects of different types and positions of sensor and actuator on the model-based control of boundary layer flows, and found a specific sensor–actuator pair with good control performance and robustness.
4.6. DRL-based control performance in 2-D boundary layer flows
We have demonstrated that the DRL-based method is effective in controlling the convectively unstable perturbation evolving in the 1-D KS system. Since the KS equation is a reduced model for the dynamics of the streamwise perturbation velocity evolving in the boundary layer flow at the wall-normal position  $y=1$, it is reasonable to expect that the optimised sensor placement that we have derived in the KS system can be translated to the control of 2-D Blasius boundary layer flows. We note that the nonlinear NS equations are the governing equations in this case.
Here, we adopt the same sensor placements with different numbers of sensors as shown in figure 14(a) in the DRL training for controlling boundary layer flows. A typical training process is shown in figure 15(a), where the red dashed line again denotes the time when the experience memory is full, and then the absolute value of the average reward per episode, i.e. the local perturbation energy around point  $z$ as defined in (2.12), generally decreases until convergence after about 50 episodes. Note that the reward is defined as the negative local perturbation energy; nevertheless, the global perturbation level in the whole flow field decreases. As shown in figure 15(b), we test the learnt control policy by applying it to the boundary layer flow for 6000 action steps that are 10 times longer than the training episode, with both the disturbance input
 $d(t)$ and control input
 $u(t)$ activated. It is found that the global perturbation energy downstream of the actuator is significantly reduced and maintained at a level close to zero throughout the test process. Here, the global downstream perturbation energy
 $e(t)$ is calculated as
 \begin{equation} e(t)=\sum_{i = 1}^{M}\left[\left(u^{i}(t)-U^{i}\right)^{2}+\left(v^{i}(t)-V^{i}\right)^{2}\right], \end{equation}
where  $M$ is the number of uniformly distributed, customised grid points in the downstream domain
 $(410, 800) \times (0, 30)$, and here
 $M=2052$;
 $u^i(t)$ and
 $v^i(t)$ are the instantaneous
 $x$- and
 $y$-direction velocity components at point
 $i$, and
 $U^i$ and
 $V^i$ are the corresponding base flow velocities.
DRL-based control for the 2-D Blasius boundary layer flow, subjected to an upstream disturbance input  $d(t)$. (a) Average local perturbation energy around point
 $z$ recorded during the training process. (b) Global perturbation energy downstream of the actuator recorded during the test process. (c) The r.m.s. value of streamwise velocity along
 $y=1$ plotted for DRL-based control with different numbers of sensors. (d) The r.m.s. value of streamwise velocity along
 $y=1$ plotted for DRL-based control with disturbance input of different amplitudes
 $\sigma _{d(t)}$. Curves for cases without control are also shown for reference.

We then extract the r.m.s. value of the streamwise velocity along  $y=1$ and plot it in figure 15(c), where the black curve is for the case without control, and other coloured curves represent DRL-based control with different numbers of sensors. Similar to that in the KS system (cf. figure 14b), when no control is implemented, the random noise introduced upstream exhibits exponential growth while convecting downstream. Such behaviour of linear instability is observed when the external disturbance
 $d(t)$ is small enough, with standard deviation
 $2 \times 10^{-4}$ used here. With the control activated, the perturbation amplitude downstream of the actuator is reduced significantly. Also, the effect of the number of sensors on the control performance is similar to that in the KS system. With the number of sensors increasing from 1 to 8, the resulting control performance is continuously improved, while with a further increase to 10, the control performance slightly degrades, similar to the situation for the KS equation.
Next, the amplitude of the input disturbance  $d(t)$ is increased to investigate the effect of nonlinearity on the DRL-based control performance. Each disturbance level represents an agent trained in that specific system, which means that the training conditions are the same as the test conditions. With the standard deviation
 $\sigma _{d(t)}$ increasing from
 $2 \times 10^{-4}$ to
 $5 \times 10^{-4}$ and
 $1 \times 10^{-3}$, the nonlinear behaviour gradually starts to play a role in the dynamics, as shown by the solid curves in figure 15(d), where the linear exponential growth is lost in the downstream region. The nonlinearity in turn slightly degrades the DRL-based control performance, as shown by the dashed curves in figure 15(d). The comparison of flow contours of streamwise perturbation velocity at
 $y = 1$ with and without control for the three input disturbance levels is shown in figures 16–18, respectively. Figures 16(a), 17(a) and 18(a) represent the flow field triggered solely by an upstream disturbance input
 $d(t)$, and figures 16(b), 17(b) and 18(b) display that with both
 $d(t)$ and DRL-based control
 $u(t)$ being activated. It is shown that in all three cases, the downstream perturbation is suppressed to some extent with DRL control, but the degree of effectiveness differs. With the increase of disturbance amplitude, the required magnitude of control action
 $u(t)$ increases (still within the predefined range
 $[-0.01, 0.01]$) but the resultant control performance deteriorates; compare contours in figures 16(b), 17(b) and 18(b), and also compare the recorded output signal
 $z(t)$, i.e. the localised perturbation energy around
 $(550,1)$, in figures 16(c), 17(c) and 18(d).
(a) Contour of streamwise perturbation velocity at  $y=1$ induced by an upstream disturbance
 $d(t)$ with standard deviation
 $\delta _{d(t)} = 0.0002$. (b) Contour of streamwise perturbation velocity with both disturbance input
 $d(t)$ and control input
 $u(t)$. (c) Output signal
 $z(t)$ comparison between the uncontrolled and controlled cases, i.e. the localised perturbation energy monitored around (550,1). Blue arrows represent inputs, and the red arrows represent outputs.

(a) Contour of streamwise perturbation velocity at  $y=1$ induced by an upstream disturbance
 $d(t)$ with standard deviation
 $\delta _{d(t)} = 0.0005$. (b) Contour of streamwise perturbation velocity with both disturbance input
 $d(t)$ and control input
 $u(t)$. (c) Output signal
 $z(t)$ comparison between the uncontrolled and controlled cases, i.e. the localised perturbation energy monitored around
 $(550,1)$. Blue arrows represent inputs, and the red arrows represent outputs.

(a) Contour of streamwise perturbation velocity at  $y=1$ induced by an upstream disturbance
 $d(t)$ with standard deviation
 $\delta _{d(t)} = 0.001$. (b) Contour of streamwise perturbation velocity controlled by
 $u(t)$ with the original forcing spatial distribution. (c) Contour of streamwise perturbation velocity controlled by
 $u(t)$ with the new forcing spatial distribution. (d) Output signal
 $z(t)$ comparison among the uncontrolled and controlled cases, i.e. the localised perturbation energy monitored around
 $(550,1)$. (e) Control performance comparison in terms of the r.m.s. value of streamwise velocity at
 $y=1$. The blue arrows represent inputs, and the red arrows represent outputs.

The performance degradation can be understood as follows. First, the optimised sensor placement applied here is obtained from the linearised KS system, which may be sub-optimal in the nonlinear conditions. Second, with the increase of disturbance level, such a control method via a localised volumetric forcing may not be effective due to its confined region of influence compared to the extended region influenced by the increasing disturbance input. This argument is verified by performing an additional DRL training for a spatially enlarged localised forcing and then comparing its control performance with the original one. The original control forcing is localised around point  $(400,1)$ with 2-D Gaussian supports with
 $\delta _x = 4$ and
 $\delta _y = 1/4$, and the new forcing is also localised around
 $(400,1)$ but with a slightly enlarged spatial region of influence with
 $\delta _x = 5$ and
 $\delta _y = 1/3$. All the other training parameters are the same as for the original one, and the resultant control performance is shown in figure 18(c) and the red dotted curves in figure 18(d,e). It is demonstrated that the control performance can be improved by slightly enlarging the spatial region of the localised forcing, which can be seen by comparing the downstream contour in figures 18(b,c), where the perturbation is better suppressed with the new forcing distribution, and from the recorded output signal
 $z(t)$ in figure 18(d), and also from the r.m.s. value of streamwise velocity along
 $y=1$ plotted in figure 18(e).
All the results shown in figures 15–18 are related to the perturbation reduction along a single straight line. Next, we plot the time-averaged perturbation energy field downstream of the actuator with different amplitudes of the disturbance input in figures 19(a–c). For clarity of comparison, all the raw data of the perturbation energy field are post-processed by first normalisation using its maximum value and then taking the logarithm. Thus the right bound of the colour code shown in figure 19 is zero, which corresponds to the region having the maximum perturbation energy among the considered cases. As shown in figure 19(a), when no control is implemented, the perturbation velocity keeps increasing as convected downstream, and develops from the boundary layer region into the outer region. In contrast, when DRL-based control is activated, the downstream perturbation is suppressed significantly. The effect of the number of sensors is also illustrated here. For DRL control with only one sensor, some small perturbations can still be observed along  $y=1$, while for DRL control with two sensors, some small perturbations appear at the outlet. For DRL control with 8 sensors, the downstream perturbations are almost completely suppressed.
Contours of the time-averaged perturbation energy field downstream of the actuator with different amplitudes  $\sigma _{d(t)}$ of disturbance input. In each panel, the comparison of perturbation energy field with and without control is presented. The colour bar displays the logarithm of the normalised perturbation energy. (a) Disturbance level
 $\sigma _{d(t)} = 0.0002$. (b) Disturbance level
 $\sigma _{d(t)} = 0.0005$. (c) Disturbance level
 $\sigma _{d(t)} = 0.001$.

Moreover, the effect of the amplitude of disturbance input is illustrated by the comparison among the first rows of figures 19(a–c), using the same eight-sensor placement for consistency. With the increase of disturbance level, the region with high perturbations is obviously enlarged, thus the DRL-based control performance deteriorates as explained before. A quantitative comparison is summarised in table 2, where the time-averaged global perturbation energy  $E$, (i.e.
 $E = \overline {e(t)}$, where
 $e(t)$ is defined in (4.3)) downstream of the actuator is reported and compared. It is found that when the disturbance level is low, DRL-based control is remarkably efficient, with an over 96 % reduction of the downstream perturbation energy. With the disturbance level increasing to 0.001, DRL-based control is not that efficient but still effective, with an 89.68 % reduction of the downstream perturbation energy.
DRL-based control performance quantified by the reduction of perturbation energy.
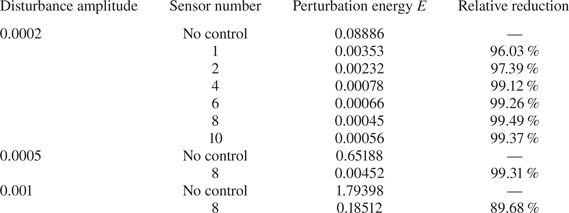
4.7. Interpretation of the learnt control policy
In this subsection, we make an attempt to understand the DRL-based flow control from a physical point of view. We stress that the convectively unstable flow system under control is a selective frequency amplifier, subject to upstream random noise. To make this point clear, we perform the stability analysis of the 2-D Blasius flow and discuss its relevance to the control.
We solve numerically the Orr–Sommerfeld equation with the solution form  $\psi (x, y, t)=\varphi (y) \exp ({\mathrm {i}(\alpha x-\omega t)})$, where
 $\varphi (y)$ is the complex amplitude,
 $\alpha$ is the wavenumber,
 $\omega = \omega _r + \mathrm {i}\omega _i$, with
 $\omega _r$ being the angular frequency and
 $\omega _i$ the exponential growth rate, and
 $c = \omega /\alpha = c_r + \mathrm {i}c_i$, where
 $c_r$ is the phase velocity of the wave, and the sign of
 $c_i$ determines whether the wave is stable or unstable. The limiting case
 $c_i = 0$ yields the neutral stability curves as shown in figure 20(a) for
 $Re\unicode{x2013} \omega _r$, non-dimensionalised by the free-stream velocity
 $U_\infty$ and the local displacement thickness
 $\delta ^*$ of the boundary layer. It is shown that the critical
 $Re$ is 519.4, and for
 $Re > 519.4$, a narrow range of frequencies is amplified. For our control case whose inlet has
 $Re = 1000$, the local displacement thickness of the boundary layer at the location of control
 $x = 400$ is about
 $\delta ^* = 1.474$, thus the local value is
 $Re_c = 1474$. Moreover, sensors used to collect state are also positioned around this location. Thus we can extract the corresponding stability curve at this section, denoted by the black dashed line in figure 20(a), and plot it in an
 $\omega _r\unicode{x2013} c_i$ plane in figure 20(b). It can be seen from figure 20(b) that the unstable frequency range at this section is about
 $(0.027, 0.079)$, denoted by two blue points. To make the control effective, this frequency range should be well resolved by state observations in DRL. In the current case, we adopt a time step of 0.05 unit times for temporal integration in 2-D simulations. The action is constant for 30 time steps, and there is only one observation collected by eight sensors at the end of each of the 30 time steps that is returned as state. Thus the control frequency is the same as the state sampling frequency, namely,
 $2{\rm \pi} /(30\times 0.05) = 4.189$, which is much larger than the aforementioned amplified frequency, thus satisfying Nyquist criteria and avoiding the aliasing effect.
Stability curves for Blasius flow by solving the Orr–Sommerfeld equation. (a) Neutral curve:  $Re$ versus
 $\omega _r$. (b) Curve for
 $Re_c = 1474$:
 $\omega _r$ versus
 $c_i$.

Moreover, we make an attempt to understand the learnt control policy through an analysis of the macroscopic flow features induced by the control action, since it is difficult to interpret the policy from the weights of neural networks due to the black box feature of ML algorithms (Schmidhuber Reference Schmidhuber2015; Rabault et al. Reference Rabault, Kuchta, Jensen, Réglade and Cerardi2019). We plot the instantaneous snapshots of streamwise perturbation velocity at three different time instants  $t_1$,
 $t_2$ and
 $t_3$ in figures 21(a–c), respectively, corresponding to the three spikes labelled in figure 15(b). In each panel, the top plot corresponds to the black curve in figure 15(b), which represents the situation with only the upstream noise input at
 $x_d = 35$, while the bottom plot corresponds to the blue curve in figure 15(b), which represents the situation with both upstream noise input at
 $x_d = 35$ and DRL-based control implemented at
 $x_u = 400$. During the control process, we record the action sequence produced by the agent and then perform a new simulation with only the recorded control actions input, and obtain the resultant field as shown by the middle plot. It is observed in all the three panels that the specific wave induced by the control action (middle plot) is of almost the same magnitude but with phase opposite to that generated by the disturbance input (top plot), which imposes a destructive inference to the incoming TS wave, and thus the downstream perturbations are well suppressed, as shown in the bottom plot of each panel. This is exactly the opposition control mechanism as has been discussed in e.g. Choi, Moin & Kim (Reference Choi, Moin and Kim1994), Grundmann & Tropea (Reference Grundmann and Tropea2008), Brennan, Gajjar & Hewitt (Reference Brennan, Gajjar and Hewitt2021), Sonoda et al. (Reference Sonoda, Liu, Itoh and Hasegawa2022) and Güemes et al. (Reference Güemes, Martín, Castellanos, Oscar and Discetti2022). To summarise, DRL control is effective in controlling the convective instability evolving in boundary layer flows, using the optimised sensor placement obtained from the KS system. The learnt control policy based on the ‘sticky action choice’ acts as opposition control to cancel the incoming perturbation TS wave.
Instantaneous snapshots of streamwise perturbation velocity at three different time instants  $t_1$,
 $t_2$ and
 $t_3$. In each panel: the top plot represents the velocity field with only the upstream disturbance input; the middle plot represents the velocity field with only the corresponding control input; the bottom plot represents the velocity field with both the disturbance input and control input turning on. The position of disturbance input and control input is denoted by the blue triangle. Plots are for (a)
 $t_1 = 1000$, (b)
 $t_2 = 3100$, (c)
 $t_3 = 5600$.

5. Conclusions
In this work, we have studied and evaluated the performance of DRL in controlling the perturbative dynamics in both the 1-D linearised KS system and the more realistic 2-D flat-plate boundary layer flows. The former is a particular variant of the original KS equation and commonly used to model the perturbation in flat-plate boundary layer flows. It is known that traditional model-based controllers usually struggle with convectively unstable flows subjected to unknown external disturbance, since it is difficult to assume an accurate flow model in a real noise environment (Dergham, Sipp & Robinet Reference Dergham, Sipp and Robinet2011; Hervé et al. Reference Hervé, Sipp, Schmid and Samuelides2012; Belson et al. Reference Belson, Semeraro, Rowley and Henningson2013). Thus the main objective of this work is to test if the model-free DRL-based flow control strategy can suppress the randomly perturbed convective instability in these flows and investigate the optimal sensor placement issue in the context of DRL flow control.
Due to the convective instability of boundary layer flows, without control, the amplitude of perturbation grows exponentially along the streamwise direction. After the DRL control is activated, the perturbation downstream of the actuator can be suppressed significantly as the perturbation amplitude at the monitoring point reduces significantly. We have also demonstrated the robustness of the learnt control policy to two types of noises, i.e. measurement noise and external noise. The former is used to mimic the realistic control scenarios as the sensors are usually subjected to noise, while the latter is used to test whether the policy learnt from a certain environment can be generalised to other unseen noise conditions. The robustness property of DRL results from the state normalisation operation in the training process and also the closed-loop nature of the control system.
We have also investigated the optimised placement of different numbers of sensors in the DRL-based flow control using the gradient-free PSO algorithm. We find that one sensor placed upstream of the actuator is not enough to generate a good control performance because, this way, the sensor cannot perceive the consequence of the action after it is taken due to the convective nature of the flow. In addition, due to the implementation of sticky actions, a single upstream sensor can inform the agent of only a single upcoming parallel slash in a packet of slashes that crosses the actuator over the duration that the action is ‘stuck’. As the slashes are generated by random noise, it is not possible for the agent to choose an action that accounts for the packet of slashes based on a single measurement. Thus a proper number of sensors placed both upstream and downstream of the actuator can provide a more complete measurement of the current flow environment in this model-free method. But more sensors do not necessarily lead to a better performance since the information provided by the additional sensors may be redundant. In our study, a specific eight-sensor placement has been found to be the optimal with the best control of the KS equation. We also investigate the dynamics of the nonlinear KS system in Appendix A, and find that, due to the nonlinear effect, the perturbation may no longer grow exponentially along the streamwise direction but saturate. The control policy learnt from the linear equation can be applied directly to control the weakly nonlinear case with an effective performance, although the controlled result is not as good as the policy trained in the real nonlinear condition. Moreover, in Appendix C, we have also embedded the information on flow stability, i.e. the leading growth rate evaluated by DMD, into the reward function to penalise the instability, and found that the control performance can be further improved.
All the above results pertain to the DRL control of the 1-D KS system. As a further demonstration, we apply the optimised sensor placement from the 1-D KS equation to the control of 2-D Blasius boundary layer flows of  $Re=1000$ subjected to a random upstream disturbance input. When the disturbance level is relatively low, DRL-based control is remarkably efficient to reduce the downstream perturbation energy, and the effect of the number of sensors on the control performance is very similar to that in the 1-D KS system. With the disturbance level increasing to 0.001, DRL-based control is less efficient. This performance degradation may be related to the fact that the adopted sensor placement is obtained from the linear KS system and also the confined region of influence of the localised control forcing. In addition, we can explain the learnt DRL policy by post-processing the flow data, and find that the DRL-based control can be interpreted as opposition control, an approach that has been studied in boundary layer flow controls.
In the end, we would like to discuss the limitations of this work and future directions that can be followed to improve the model-free DRL-based flow control. A more consistent study to determine the optimal sensor placement in the 2-D boundary layer flows would couple sensor optimisation with DRL training directly in the 2-D flows. This was our initial attempt; however, we quickly realised that the computational cost, i.e. PSO executed in the 2-D NS equations with a reasonable resolution, is impractically high, and thus resorted to the 1-D KS model of the perturbed boundary layer flows. With more computational resources, future work can consider solving for the optimal sensor placement in a more consistent manner. It should be noted that some researchers have begun to use a data-driven reduced-order model in place of the real environment in DRL control to mitigate the problem of high computational cost (Ha & Schmidhuber Reference Ha and Schmidhuber2018; Zeng, Linot & Graham Reference Zeng, Linot and Graham2022), and this may also help to circumvent the computational problem that we are facing here. Another issue lies in the time delay between the control starting time and the time when its impact on the downstream flow field can be perceived. This delay is due to the convective nature of the studied flow. Our experience is that it is important to remove such delay and match the effect of the action and the corresponding flow state/reward in the DRL framework. In academic flows, the control delay time may be obtained based on our knowledge of the flow system, as described in Appendix B. This may, however, be unobtainable in real-world applications. Thus coming up with a systematic way to eliminate the delay is important. The final issue is to embed flow physics/symmetry properties of the dynamical system in the DRL-based control. This will help to steer the black-box exploration of DRL in a physically correct direction and improve the sample efficiency. Our attempt deals with it only in a specific case. More systematic studies along this direction will be necessary and important in furthering our understanding of the DRL control.
Acknowledgements
We acknowledge the computational resources provided by the National Supercomputing Centre of Singapore.
Funding
D.X. is supported by a PhD scholarship from the Ministry of Education, Singapore. M.Z. acknowledges the financial support of a Tier-1 grant from the Ministry of Education, Singapore (WBS no. R-265-000-689-114).
Declaration of interests
The authors report no conflict of interest.
Appendix A. Dynamics of nonlinear KS equation and its control
All the previous results are related to the control of the linearised KS equation. However, when the perturbation amplitude increases above a certain level, the nonlinear effect can no longer be neglected. In this appendix, we investigate the dynamics of the nonlinear KS equation as described by (2.3), together with boundary conditions (2.5a–d), and its control issue.
The intensity of nonlinearity in (2.3) depends on the value of  $\varepsilon$. Here, we first select three different values,
 $\varepsilon = 0.001$, 0.005 and 0.01, and simulate the dynamics of the weakly nonlinear KS system subjected to an upstream random noise of unit variance at
 $x_d = 35$, using the numerical method described in § 3.1. All the other parameters are identical with those for the linearised system. The corresponding results are presented in figure 22(a), where the r.m.s. value of perturbation velocity along the 1-D domain is plotted. It is shown that with the increase of
 $\varepsilon$, the nonlinear effect becomes more evident in the sense that the perturbation is no longer growing exponentially along the
 $x$-direction, in contrast to the linear system, as shown by the black curve. The nonlinear effect can also be demonstrated by varying the external noise level. As shown in figure 22(b), we fix
 $\varepsilon = 1$ but increase the standard deviation of the upstream noise from
 $\sigma _{d(t)} = 0.001$ to
 $\sigma _{d(t)} = 0.005$, and the nonlinear effect strengthens.
Dynamics of the nonlinear KS system when subjected to an upstream random noise. (a) The r.m.s. value of perturbation velocity along the 1-D domain plotted for the KS equation excited by an upstream noise with  $\sigma _{d(t)}=1$, with different values of
 $\varepsilon$. (b) The r.m.s. value of perturbation velocity along the 1-D domain plotted for the KS equation excited by an upstream noise of different standard deviations
 $\sigma _{d(t)}$, with
 $\varepsilon$ fixed at 1.
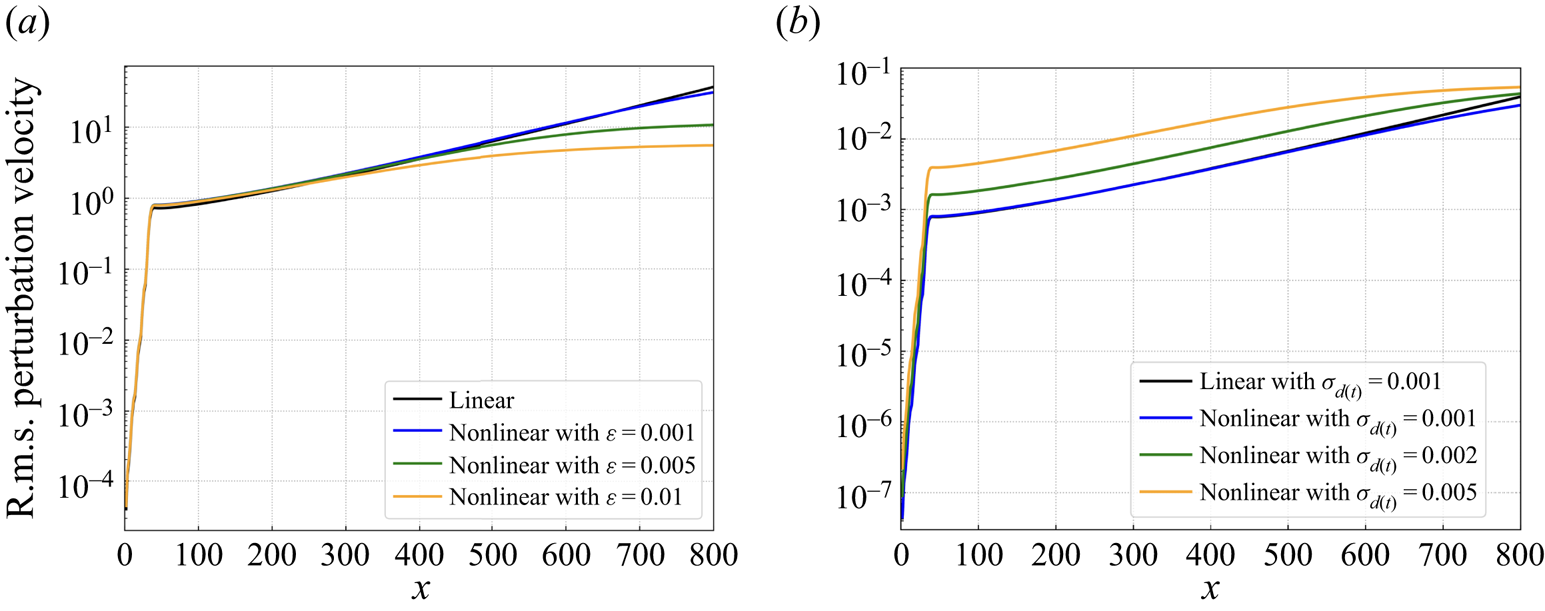
Then we investigate the DRL-based control of the nonlinear KS system. The control policy that was learnt from the linear condition is applied directly to the nonlinear case with  $\varepsilon = 0.005$ and
 $\sigma _{d(t)} = 1$. It is found that this policy is still effective in suppressing the downstream perturbation, as shown by the blue curve in figure 23(a), where the amplitude at
 $x_z = 700$ is reduced from about 10 to 0.3, although the performance is not as good as the new policy trained in the nonlinear condition with
 $\varepsilon = 0.005$ (orange curve). Similar results can also be found in Jamal & Morris (Reference Jamal and Morris2015), where the controller designed in the linearised KS equation can be used to stabilise the nonlinear KS equation. In figure 23(b), we compare the DRL-based control performance with the increase of the external noise level under the nonlinear condition with
 $\varepsilon =1$. It is shown that as the noise level increases, the control performance degrades in terms of the downstream perturbation reduction. This may be due partly to the fact that the sensor placement applied here is obtained directly from the linearised KS system, which may be sub-optimal in the nonlinear condition, and similar results are also found in 2-D boundary layer flows, to be detailed in § 4.6.
DRL-based control of the nonlinear KS system. (a) The r.m.s. value of perturbation velocity plotted for the uncontrolled case and the controlled cases using both the old policy (trained from the linear condition) and the new policy (retrained in the nonlinear condition with  $\varepsilon = 0.005$ and
 $\sigma _{d(t)} = 1$). (b) The r.m.s. value of perturbation velocity plotted for the uncontrolled and controlled cases of the KS system excited by an external noise of different levels; all the control policies applied are trained from the nonlinear condition with
 $\varepsilon = 1$.

Appendix B. Time delay in DRL-based flow control
In this appendix, we explain the time delay issue as mentioned in § 3.3 and how we circumvent this issue by correlating the reward with the right state-action tuple.
During DDPG training process, transition data  $(s,a,r,s')$ at each step are first stored into the experience memory, where
 $s$,
 $a$,
 $r$ and
 $s'$ are state, action, reward and next state, respectively, and then mini-batch samples are taken from the memory to update the parameters of the neural network. In the current DRL framework, reward
 $r$ is related to the perturbation amplitude/energy monitored at a downstream location, so its instantaneous value is not a corresponding response to the current action at an upstream position, until the impact of action has been convected to the downstream location. To eliminate this mismatch, the key is to identify the corresponding time delay
 $t_D$. Given a constant
 $t_D$, we first store
 $s, a, s'$ in three independent buffers, and after
 $t>t_D$, we start to extract
 $(s, a, s')$ at
 $t-t_D$ from their respective buffers that correspond to the data
 $t_D$ time ago. That is,
 $(s, a, s')$ at
 $t-t_D$ is combined with reward
 $r$ at
 $t$, and they are stored in the experience memory together. In this way, we remove the time delay and help the DRL agent to perceive the dynamics of environment in a time-matched way.
Next, we explain how we choose the time delay  $t_D$, which is defined as the time difference between the control starting time and the time when a downstream monitoring point responds. Before training, we first run simulations using the current control framework with both random noise input and random control input from a zero initial condition in the KS equation and from laminar base flow in the boundary layer flow. As shown in figures 24(a) and 25(a), the reward signal remains zero before the first control action reaches the downstream location, and then turns negative (since the reward is defined as the negative value of downstream perturbation amplitude for the KS system, and the negative value of downstream perturbation energy for the boundary layer case). Thus the time at this turning point is chosen as the time delay
 $t_D$, i.e.
 $t_D=25$ for the KS, and
 $t_D=120$ for the boundary layer case.
Time delay removal for DRL-based control of the 1-D KS system. (a) Time delay  $t_D$ identified at the turning point when reward turns negative. (b) The r.m.s. value of perturbation along the 1-D domain plotted for control cases with and without time delay.

Time delay removal for DRL-based control of 2-D boundary layer flow. (a) Time delay  $t_D$ identified at the turning point when reward turns negative. (b) The r.m.s. value of streamwise velocity along
 $y=1$ plotted for control cases with and without time delay.

We also present the comparison of DRL control performance with and without this modification, as shown in figure 24(b) for the KS system and figure 25(b) for the boundary layer case. For consistency, all the cases adopt the same optimised eight-sensor placement. It is shown that with time delay removed, DRL control performance is improved significantly. Especially for boundary layer flow control, with delay removed, the relative reduction of downstream perturbation energy is 99.49 % (from 0.08886 to 0.00045), while if the time delay is not treated, then the perturbation energy reduction is only 87.74 % (from 0.08886 to 0.01089). The control results are visualised in figure 26.
Contours of the time-averaged perturbation energy field downstream of the actuator, with upstream noise input  $\sigma _{d(t)} = 0.0002$. (a) Energy field without control. (b) DRL-based control with time delay. (c) DRL-based control with time delay removed.

Finally, we provide a more detailed description of our DRL framework for the reproducibility of the current work. The environment set-up has been described in § 2, and the numerical simulations of the two systems are given in §§ 3.1 and 3.2. For the interaction between the agent and the environment, the control action is updated every 30 time steps, and there is only one state observation collected by the optimised sensors at the end of each 30 time steps. Thus the control frequency is the same as the state sampling frequency, which has to be larger than twice the characteristic frequency of the problem to satisfy Nyquist criteria. For hyperparameters adopted in the training process, we define a training episode composed of 120 action steps for the 1-D KS system, and 600 action steps for the 2-D boundary layer flow. The experience memory size is chosen to be 10 000 for the KS system, and 15 000 for the Blasius case, with mini-batch size 32. Moreover, both actor and critic networks have two hidden layers each with 200 neurons using ReLU as the activation function. An Adam optimiser is adopted to update network parameters, and the learning rate is selected as 0.001 for both actor and critic networks. In terms of the computational time spent, the training in the KS system is quite fast due to the simplicity of this reduced model, and it takes about 20 min for full convergence, while for training in the Blasius case, it takes about 12 h to learn the optimal control policy. The sensor placement optimisation implemented in the KS system is quite time-consuming since the particle searching process is conducted in serial in the Pyswarm package that we adopted here, and each search corresponds to a complete DRL training in the KS system. It takes about two weeks to obtain the final optimised sensor placement in our case, and how to accelerate the optimisation process is also one of our future research directions. All of the above computations are performed on 12 cores of Intel Xeon(R) Bronze 3104.
Appendix C. Stability-enhanced reward design
In this appendix, we would like to analyse the convective nature of the 1-D KS equation and propose to embed flow physical information in the reward design. In the main body, the reward is defined as the negative r.m.s. value of  $z(t)$ that represents the downstream perturbation level. In this appendix, we discuss how the reward function in DRL-based control can be improved to incorporate information on the flow instability of the 1-D KS system to improve the control performance.
We first analyse the stability properties of the 1-D linearised KS system without the external forcing term, i.e. (2.4) with  $f(x,t) = 0$. We assume travelling-wave-like solutions in the form
 \begin{equation} v^{\prime}=\hat{v} \exp({{\rm i}(\alpha x-\omega t)}), \end{equation}
where  $\alpha \in \mathbb {R}$ is the wavenumber, and
 $\omega =\omega _{r}+\textrm {i} \omega _{i} \in \mathbb {C}$, with
 $\omega _{r}$ representing the frequency and
 $\omega _{i}$ the exponential growth rate. Inserting (C1) into (2.4) yields the following dispersion relation between
 $\omega$ and
 $\alpha$:
 \begin{equation} \omega=V \alpha+\mathrm{i}\left(\frac{\mathcal{P}}{\mathcal{R}}\, \alpha^{2}-\frac{1}{\mathcal{R}}\,\alpha^{4}\right). \end{equation}
The relation between  $\omega _i$ and
 $\alpha$ is presented in figure 27(a). It is shown that only a certain range of wavelengths are unstable and will be amplified in the final state; see again figure 6. For the convectively unstable flows, the spatiotemporal stability analysis is more relevant, which accounts for the wave development in both space and time.
Convective instability of the 1-D linearised KS system. (a) Relation between wavenumber  $\alpha$ and growth rate
 $\omega _i$. (b) Relation between group velocity
 $v_g$ and the corresponding growth rate
 $\sigma$.

The spatiotemporal instability of the convective KS system subjected to an impulse disturbance is conducted, following the post-processing method in Brancher & Chomaz (Reference Brancher and Chomaz1997); our code adapts that used in Feng et al. (Reference Feng, Wan, Zhang and Wang2022). To extract unambiguously the amplitude and phase of a wavepacket, the Hilbert transform is applied to the perturbation velocity as
 \begin{equation} v^{\prime}(x, t)=\hat{v}(x, t) \exp({{\rm i}\,\psi(x, t)}), \end{equation}
where  $\hat {v}(x, t)$ represents the complex-valued amplitude function, and
 $\psi (x, t)$ is the phase of the wavepacket. Then we calculate the amplitude function
 $\hat {\mathcal {E}}(x, t)$, which is the norm of
 $\hat {v}(x, t)$, at an (asymptotically) large time:
 \begin{equation} \hat{\mathcal{E}}(x, t) \propto t^{{-}1 / 2} \exp({\sigma(v_{g})\,t}), \quad \text{with} \ v_{g}=\left(x-x_{0}\right) / t=\text{const.},\ t \rightarrow \infty, \end{equation}
where  $x_0$ is the initial location of the impulse disturbance, and
 $\sigma (v_g)$ refers to the dominant growth rate along the ray
 $v_g$. See Huerre & Monkewitz (Reference Huerre and Monkewitz1985) for the derivation of the above equation. Based on two snapshots extracted at instants
 $t_1$ and
 $t_2$, the spatiotemporal growth rate can be calculated as
 \begin{equation} \sigma(v_{g}) \approx \frac{\ln \left[\hat{\mathcal{E}}(v_{g} t_{2}, t_{2}) / \hat{\mathcal{E}}(v_{g} t_{1}, t_{1})\right]}{t_{2}-t_{1}}+\sigma_{0}(t_{1}, t_{2}), \quad \sigma_{0}(t_{1}, t_{2})=\frac{\ln (t_{2} / t_{1})}{2(t_{2}-t_{1})} , \end{equation}
where  $\sigma _0(t_1, t_2)$ is a finite-time correction for the growth rate due to the
 $t^{-1/2}$ term in (C4) (Delbende & Chomaz Reference Delbende and Chomaz1998).
Following this method, we can calculate the spatiotemporal growth rate  $\sigma$ under various group velocities
 $v_g$, and plot it in figure 27(b). It is shown that the maximum growth rate
 $\sigma = 2.42\times 10^{-3}$ is obtained at
 $v_g = 0.4$, which is close to the maximum growth rate
 $\omega = 2.5\times 10^{-3}$ obtained in figure 27(a) at
 $\alpha = 0.158$. In addition, the absolute growth rate
 $\sigma (v_g = 0)$ is negative, as shown in figure 27(b), which demonstrates the nature of convective instability in the 1-D linearised KS system.
Now we discuss the new reward design in the DRL-based control of the linearised KS system. When the control is turned on and the external forcing term  $f(x, t)$ in (2.4) is varying, it is difficult to apply the conventional linear stability analysis. In this case, we use the traditional dynamic mode decomposition (DMD; cf. Rowley et al. Reference Rowley, Mezić, Bagheri, Schlatter and Henningson2009; Schmid Reference Schmid2010) to extract the leading growth rate and embed it into the reward function design. Here, two notable points regarding the DMD used in the current work are mentioned. First, the snapshots are extracted in a moving coordinate system with velocity 0.4, which is the group velocity leading to the maximum growth rate as calculated above (see figure 27b). If the snapshots were extracted based on a stationary coordinate, then we are not able to obtain the correct growth rate to describe the instability of the convective system. Second, the snapshots are extracted within the range
 $(410, 500)$, which is near downstream of the actuator position, since this specific range is affected by the control action most directly and can reflect the effects of control.
We embed the physical information on flow instability into the reward function in the following way, similar to that in Li & Zhang (Reference Li and Zhang2022):
 \begin{equation} \text{Reward} ={-}|z(t)|_{rms}\times e^{cg} , \end{equation}
where the first term  $-|z(t)|_{rms}$ on the right-hand side represents the initial reward, and the second term
 $e^{cg}$ is related to the flow instability, with
 $g$ being the leading growth rate evaluated by DMD, and
 $c$ being a constant equal to 50. (The specific value of
 $c$ is not essential; we choose 50 in order to compensate the small value of
 $g$.) When the control has a stabilising effect, i.e.
 $g < 0$ and
 $e^{cg} < 1.0$, a larger reward is given to encourage such control attempts. On the contrary, when the control is destabilising, i.e.
 $g > 0$ and
 $e^{cg} > 1.0$, the second term acts as a penalty to reduce the probability of the occurrence of such actions. Therefore, the new reward function penalises flow instability. Loosely speaking, one can also take the logarithm of the reward function to understand that the growth rate acts as an additional regulation term in the objective function.
Comparisons on the DRL-based control performance between using the initial reward and the stability-improved reward are presented in figures 28(a–f) for different numbers of sensors. It is shown that with 1 or 2 sensors, the control performance enhancement by using the stability-enhanced reward is limited. This may be due to the fact that too few sensors cannot provide a complete measurement of the noisy environment, preventing the new reward from demonstrating its effectiveness. As the number of sensors increases, the new reward begins to show its advantages in the sense that the perturbation downstream of the actuator is further reduced, as shown in figures 28(c–f). The manifestation of the performance improvement is revealed in figure 29, where the growth rate calculated by DMD is presented (here we use 8 sensors). When there is no control, the growth rate as a function of time is always positive, which indicates that the flow itself is convectively unstable. With the initial reward, the large spikes of positive growth rate decrease, and there are some instants with a negative growth rate, leading to the reduction of downstream perturbations. However, the instants with a positive growth rate are still frequent. With the help of stability-enhanced reward, such instants with a relatively large positive growth rate are penalised and thus become fewer. The average growth rate during the control process is decreased, thus a better control performance is achieved.
DRL-based control performance comparison between using the initial reward and the stability-enhanced reward with different numbers of sensors. The r.m.s. value of perturbation velocity along the 1-D domain is plotted: (a) 1 sensor, (b) 2 sensors, (c) 4 sensors, (d) 6 sensors, (e) 8 sensors, (f) 10 sensors.
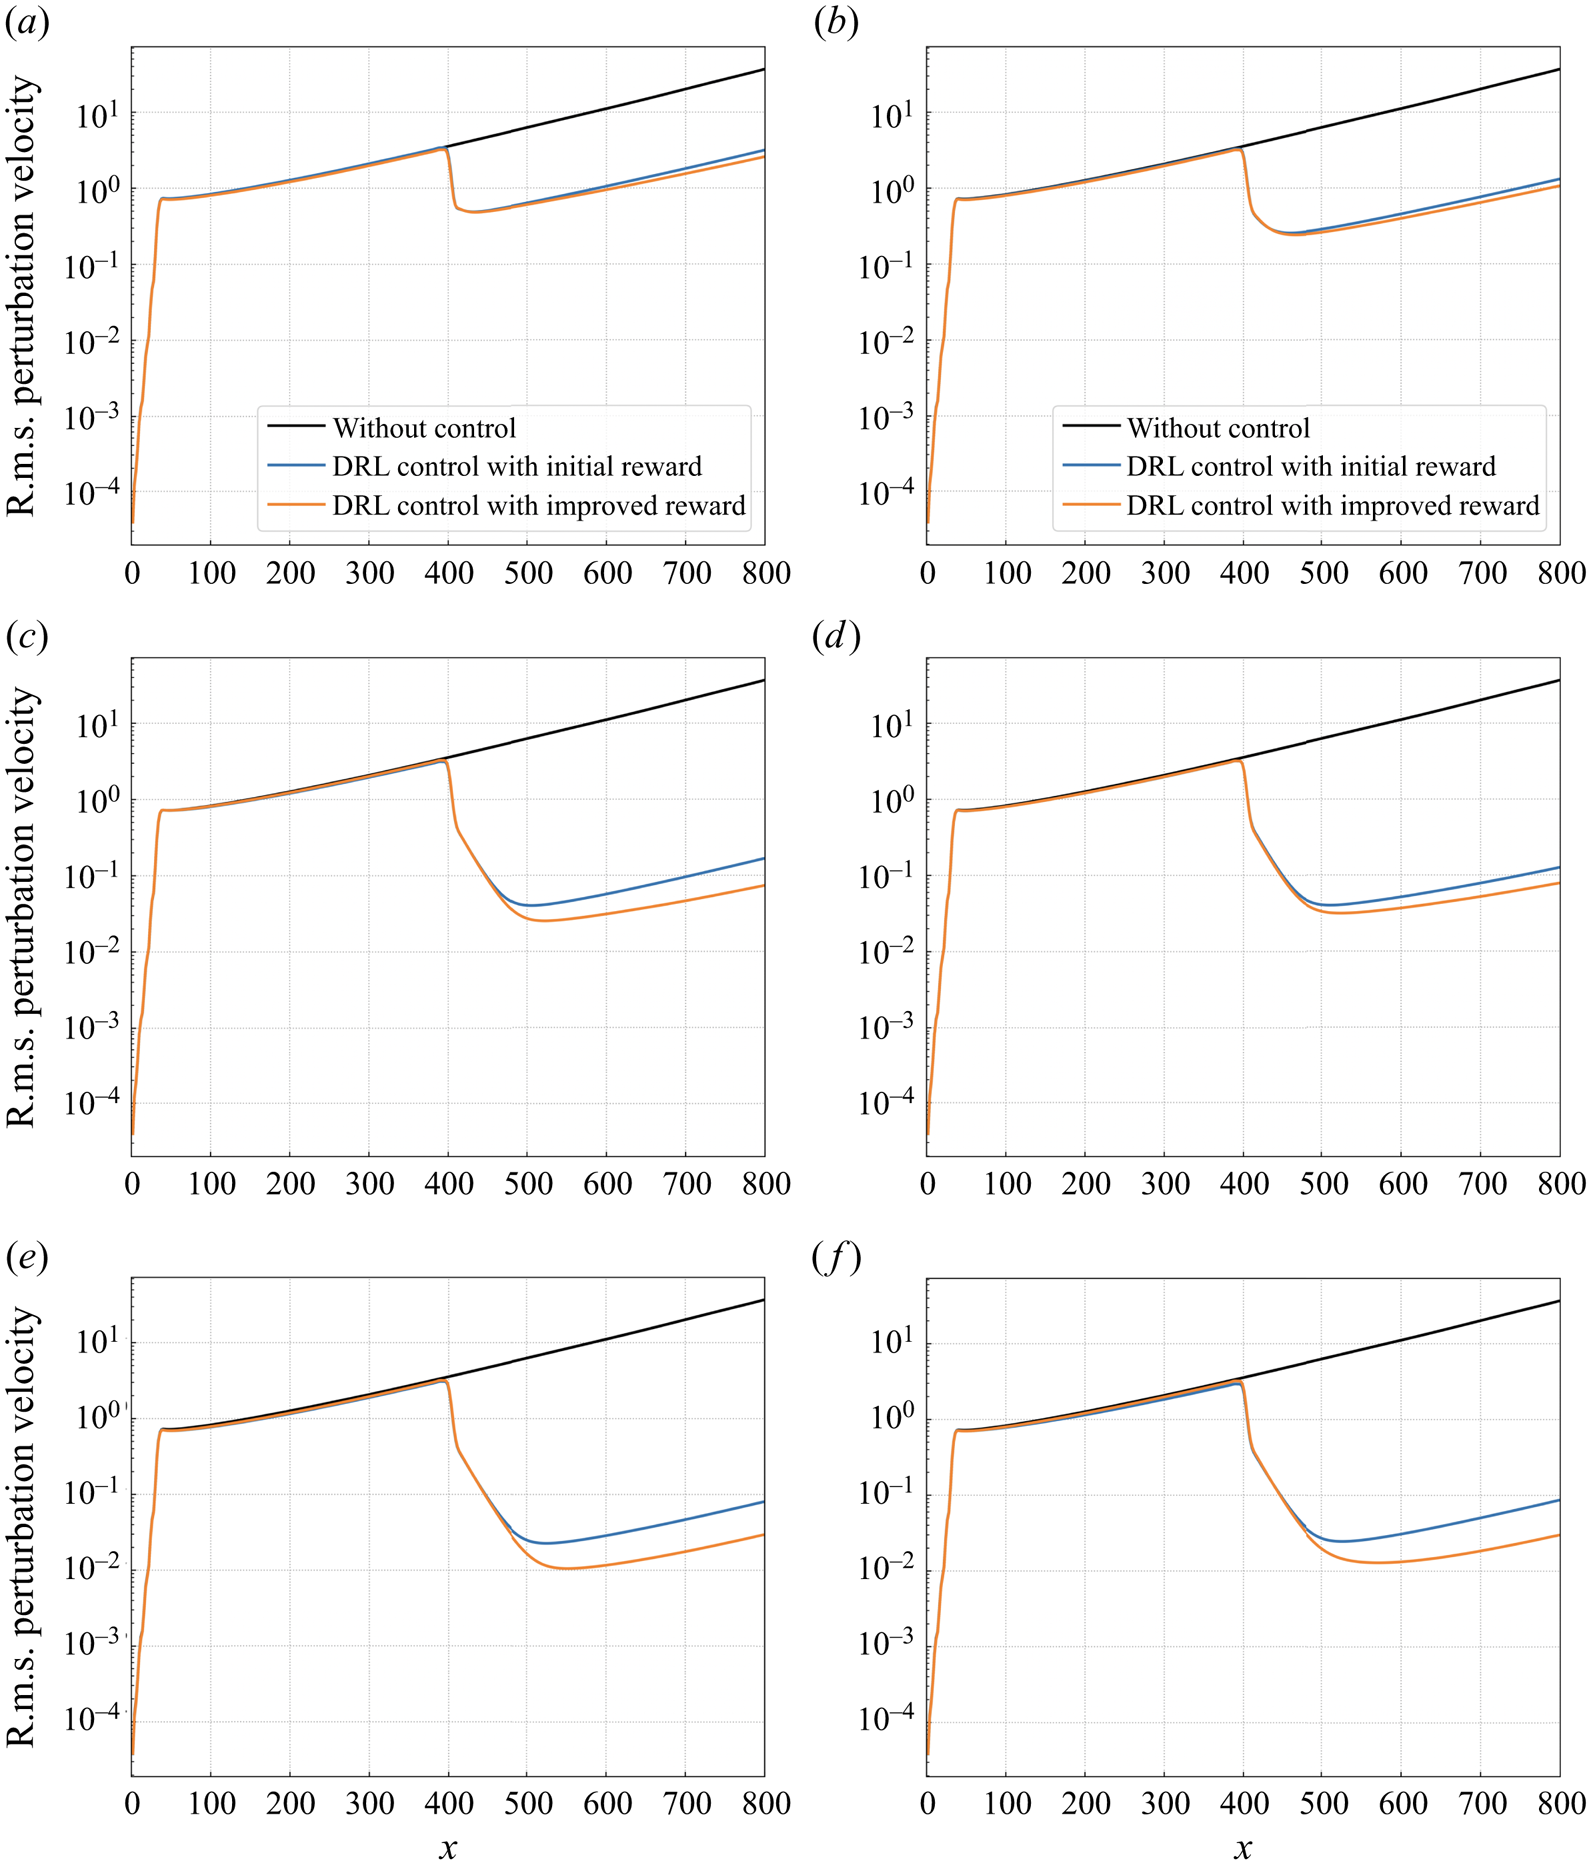
Time-variation curve of the leading growth rate evaluated by DMD during the control process, using both the initial reward and the stability-improved reward. The curve for the uncontrolled process is also plotted for comparison.
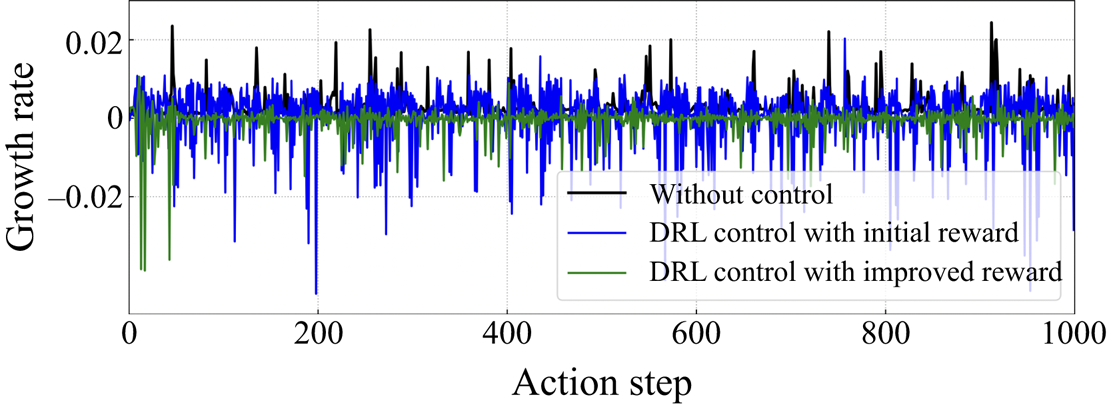
Appendix D. Linear quadratic regulator control
Linear quadratic regulator (LQR) is a classical-model-based control method that assumes full knowledge of the field  $\boldsymbol {v}({t})$ to calculate the control signal
 $u(t)$ as
 \begin{equation} u(t)=\boldsymbol{\mathsf{K}}(t)\,\boldsymbol{v}(t), \end{equation}
where  $\boldsymbol{\mathsf{K}}({t})$ is the feedback gain that will be calculated by solving a Riccati equation. The objective of an LQR controller is to seek a control signal
 $u(t)$ that minimises the cost function
 $L$ in a quadratic form considering both the sensor output
 $z(t)$ and the control effort
 $u(t)$ in some time interval
 $t \in [0, T]$:
 \begin{equation} {L}(\boldsymbol{v}(u), u)=\tfrac{1}{2} \int_{0}^{T}\left(\boldsymbol{v}^{H} \boldsymbol{\mathsf{W}}_{\boldsymbol{v}} \boldsymbol{v}+u^{H} w_{u} u\right) {\rm d} t+\int_{0}^{T} \boldsymbol{p}^{H}\left(\dot{\boldsymbol{v}}-\boldsymbol{\mathsf{A}} \boldsymbol{v}-\boldsymbol{\mathsf{B}}_{u} u\right) {\rm d} t, \end{equation}
where  $\boldsymbol{\mathsf{W}}_{\boldsymbol {v}}=\boldsymbol{\mathsf{C}}_{z}^{H} w_{z} \boldsymbol{\mathsf{C}}_{z}$, and
 $z(t) = \boldsymbol{\mathsf{C}}_{z}\,\boldsymbol {v}(t)$. Both
 $w_z$ and
 $w_u$ are weighting factors, selected as 1 here except in the cases where we will change them. The second term on the right-hand side is due to the dynamic constraint, i.e.
 $\dot {\boldsymbol {v}}(t)=\boldsymbol{\mathsf{A}}\,\boldsymbol {v}(t)+\boldsymbol{\mathsf{B}}_{u}\,u(t)$, and
 $\boldsymbol {p}$ is a Lagrangian multiplier that is also the adjoint state corresponding to the direct state
 $\boldsymbol {v}$.
For a linear time-invariant system, the most straightforward way to compute the optimal control signal  $u(t)$ is to utilise the optimal condition, i.e.
 $\partial L /\partial u$ = 0, which gives
 \begin{equation} u(t)={-}w_{u}^{{-}1} \boldsymbol{\mathsf{B}}_{u}^{H}\,\boldsymbol{p}(t). \end{equation}
Assuming a linear relation between direct state and adjoint state, i.e.  $\boldsymbol {p}(t)=\boldsymbol{\mathsf{X}}(t)\,\boldsymbol {v}(t)$, we can obtain the feedback gain
 $\boldsymbol{\mathsf{K}}({t})$ given by
 \begin{equation} \boldsymbol{\mathsf{K}}(t)={-}w_{u}^{{-}1} \boldsymbol{\mathsf{B}}_{u}^{H}\,\boldsymbol{\mathsf{X}}(t), \end{equation}
where the matrix  $\boldsymbol{\mathsf{X}}(t)$ is the solution of a differential Riccati equation (Lewis, Vrabie & Syrmos Reference Lewis, Vrabie and Syrmos2012). When
 $\boldsymbol{\mathsf{A}}$ is stable and time
 $t$ approaches infinity, we can obtain
 $\boldsymbol{\mathsf{X}}(t)$ by solving the following algebraic Riccati equation:
 \begin{equation}
\boldsymbol{0}=\boldsymbol{\mathsf{A}}^{H}
\boldsymbol{\mathsf{X}}+\boldsymbol{\mathsf{X}} \boldsymbol{\mathsf{A}}-\boldsymbol{\mathsf{X}}
\boldsymbol{\mathsf{B}}_{u} w_{u}^{{-}1} \boldsymbol{\mathsf{B}}_{u}^{H}
\boldsymbol{\mathsf{X}}+\boldsymbol{\mathsf{W}}_{\boldsymbol{v}}.
\end{equation}
The above equations describe the principle of an LQR controller. Its advantage is that the feedback gain is constant and thus needs to be computed only once. As a typical example of model-based control methods, the LQR controller is compared with our model-free DRL-based controller to control the 1-D linearised KS equation in § 4.3.


 Open access

