I. INTRODUCTION
Thermoelectric technology represents a key approach that can directly tap the currently under-utilized thermal energy from renewable and waste heat sources and convert it directly to electrical power in an environmentally friendly manner. For thermoelectric (TE) technology to become competitive, there is a need to develop high efficiency bulk TE materials with a dimensionless figure of merit, ZT, higher than 1. The efficiency of a TE material is gauged by the dimensionless figure of merit (ZT), which is defined as (S 2T/κρ), where S is the Seebeck coefficient or thermopower, T is the average temperature of the sample, and ρ is the dc electrical resistivity. In this article, the power factor PF, conventionally known as S 2/ρ, will be defined as S 2T/ρ so that ZT is simply given by the PF/κ. The total thermal conductivity κ is given by the sum κe+κL, the electronic and lattice components of κ, respectively. The potential of the class of intermetallic compounds known as half-Heusler (HH) phases for high-temperature TE power generation has recently received much attention. This is largely due to the facts that ZT ∼ 1 was reported at high temperatures (∼1000 K)Reference Culp, Poon, Hickman and Tritt1–Reference Yan, Joshi, Liu, Lan, Wang, Lee, Simonson, Poon, Tritt, Chen and Ren3 and the materials are relatively easy to synthesize as 100% dense samples and are more environmentally benign than other PbTe-based materials. The crystal structure of HH phases is of the MgAgAs type consisting of three interpenetrating filled face-centered cubic (fcc) sublattices, and a fourth open fcc sublattice of vacancies. Each filled sublattice can be tuned independently, through substitutions, to optimize the TE material system. HH phases are known to be semiconductors when the valence electron count, per unit cell, is 8 (e.g., LiMgP with bandgap of ∼3.7 eV) or 18 (e.g., MNiSn, where M = Ti, Zr, Hf, with bandgaps ∼0.2–0.4 eV). For the MNiSn phases, by doping the Sn site with Sb, the semiconducting MNiSn system is transitioned into semimetallic material with a high power factor.Reference Bhattacharya, Pope, Littleton, Tritt, Ponnambalam, Xia and Poon4 Opportunities also exist for exploring other HH compositions.Reference Yang, Li, Wu, Zhang, Chen and Yang5
In recent years, new approaches for controlling electron and phonon transports through nanostructuring have been developed, leading to a significant enhancement in bulk and thin-film TE performance.Reference Venkatasubramanian, Siivola, Colpitts and O’Quinn6, Reference Minnich, Dresselhaus, Ren and Chen7 Indeed, thin-film and bulk nanocomposites have emerged as promising high-ZT materials. These bulk materials, produced by either compacting nanostructured powdersReference Yan, Joshi, Liu, Lan, Wang, Lee, Simonson, Poon, Tritt, Chen and Ren3, Reference Poudel, Hao, Ma, Lan, Minnich, Yu, Yan, Wang, Muto, Vashaee, Chen, Liu, Dresselhaus, Chen and Ren8–Reference Li, Tang, Su, Zhang and Uher12 or embedding nanoparticles in a host,Reference Zide, Bahk, Singh, Zebarjadi, Zeng, Lu, Feser, Xu, Singer, Bian, Majumdar, Bowers, Shakouri and Gossard13 were reported to attain ZT values significantly higher than those of their prenanostructured states. Indeed, ZT as high as 1.8 was observed in the BiSbTe system.Reference Fan, Zhao, Guo, Yan, Ma and Hng11 Bulk nanocomposites are typically synthesized by preparing powder precursors, followed by consolidation into fully dense pellets by hot pressing or spark plasma sintering (SPS). One consequence of the nanostructuring is the increase of interfaces. In addition to enhancing phonon scattering to reduce thermal conductivity,Reference Venkatasubramanian, Siivola, Colpitts and O’Quinn6 the interface tends to trap low energy carriers, creating an energy filtering effect and thereby increasing the thermopower.Reference Zide, Bahk, Singh, Zebarjadi, Zeng, Lu, Feser, Xu, Singer, Bian, Majumdar, Bowers, Shakouri and Gossard13–Reference Popescu and Woods15
In the present study, several methods for enhancing the TE properties of HH materials were performed with the objective of providing directions for further investigation. Utilizing the knowledge of electronic structure, one method involved improving the power factor via alloying and nanostructuring. Another primary approach is to use grain refinement and embedment of nanoparticles in HH alloy hosts to produce fine-grained and nanostructured materials. Experimental findings are reported and discussed in light of current approaches on improving TE performance. Finally, the device-level performance of HH alloys are presented, suggesting significant potential for bulk nano-HH alloyed materials.
II. ELECTRONIC ORIGIN OF THERMOPOWER ENHANCEMENT
The thermopower can be enhanced via an energy filteringReference Kishimoto, Tsukamoto and Koyanagi14, Reference Popescu and Woods15 process or enhancement in the electronic density of statesReference Heremans, Jovovic, Toberer, Saramat, Kurosaki, Charoenphakdee, Yamanaka and Snyder16, Reference Lee, Wu and Grossman17 (DOS) near the Fermi level. In composite systems, the interfaces tend to trap carriers and create potential barriers that allow only those carriers with higher energies to pass through the grain boundary, resulting in the increase of thermopower. In alloys, DOS distortion occurs when the energy band resonates with the energy level of localized solute atoms, causing significant hybridization between the localized dopant and majority band, producing a local DOS maximum (or peak) over a narrow energy range. Recently, induction melted and spark-plasma-sintered (TiZrHf)(CoNi)Sb phase formed with in situ grown InSb nanoinclusions that occurred primarily on the grain boundaries was found to exhibit increased electrical conductivity and thermopower as well as reduced thermal conductivity.Reference Xie, Heb, Zhu, Su, Wang, Holgate, Graff, Ponnambalam, Poon, Tang, Zhang and Tritt18 In particular, a large enhancement in power factor by as much as 200% was observed. ZT was significantly increased, from ∼0.2 to ∼0.52, at 820 K. The large increase in thermopower could not possibly be explained in terms of an effective medium model and was attributed to the energy filtering effect of the carriers. Making use of the electronic structure, in another study, small concentrations of vanadium (less than 1%) was added to a HH phase Hf0.75Zr0.25NiSn to introduce additional electronic states near the conduction band edge.Reference Simonson, Wu, Xie, Tritt and Poon19 A substantial increase in the thermopower of polycrystalline alloys was observed. The electrical resistivity, on the other hand, exhibited only modest increase, thereby resulting in a 120% increase in the power factor above room temperature. These observations were discussed in terms of carrier concentration, mobility, and effective mass. When taken in conjunction with low-temperature heat-capacity measurements, the results indicated an increase in the DOS at the Fermi level, consistent with the resonant state phenomena investigated by theoretical work on semiconductors.Reference Ahmad, Hoang and Mahanti20
III. HH PHASE SYSTEMS
Experiments have been performed to provide directions for future study. A more conventional pathway to enhance ZT is to reduce the dopant level in lowering κe while simultaneously increasing or preserving the power factor. Embedment of nanoparticles to improve the TE properties has also been performed. SPS of compacted powders produces fine-grained samples. Recently, in a separate study, fully nanostructured p-type HH alloys have been shown to exhibit ZT = 0.8 at 970 K, 60% higher than that of the prenanostructured phase.Reference Yan, Joshi, Liu, Lan, Wang, Lee, Simonson, Poon, Tritt, Chen and Ren3 A large reduction in κL and a small increase in power factor contributed to the ZT enhancement.
A. Experimental procedures
Ingots of Hf0.6Zr0.4NiSn1−xSbx (x = 0.005, 0.01, 0.02) and Hf0.3Zr0.7CoSn0.3Sb0.7 were prepared by arc melting in argon atmosphere, each ingot was melted three times to ensure homogeneity. Afterwards, the ingots were pulverized into fine powders of about 10 to 30 μm in sizes. The Hf0.3Zr0.7CoSn0.3Sb0.7 powders were mixed thoroughly with approximately 1 to 2 vol.% ZrO2 nanoparticles. The HH powder materials were consolidated using SPS (SPS-1050; Sumitomo Coal Mining Co., Ltd., Tokyo, Japan) technique. The sintering temperatures were 1100 °C for Hf0.6Zr0.4NiSn1−xSbx and 1200 °C for Hf0.3Zr0.7CoSn0.3Sb0.7, significantly higher than the temperatures reached in TE properties measurement and device operation. The densities of the sample discs after SPS are in good consistence with theoretical values. X-ray diffraction was performed to confirm the phases of samples. Scanning electron microscope (SEM; JEOL 6700F) and transmission electron microscope (TEM; JEOL 2000FX, Boston, MA) were used to investigate fractured and ion-milled samples, respectively, for their morphologies and microstructures. Sample compositions determined by energy dispersive spectroscopy (EDS) were found to be essentially the same as nominal compositions. Thermal diffusivities D and the specific heat Cv were measured on a Netzsch (LFA-457) microflash system and DSC-404C Pegasus system, respectively. Thermal conductivity was calculated using the relation κ = DρCv, where ρ is the sample density. The contribution to thermal conductivity from phonon scattering, lattice thermal conductivity κL = κ – κe, can be obtained by knowing κe, where κe is the electrical contribution that can be estimated by using the Wiedenann–Franz relationship κe = LσT, in which L is the Lorenz Number (2.45 × 10⁻⁸ V2K−2) and σ is the electrical conductivity.
B. Results and discussions
1. Material phases and microstructural characterization
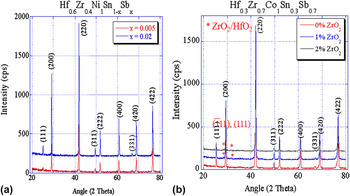
As shown in Fig. 1, the x-ray patterns of both n-type Hf0.6Zr0.4NiSn1−xSbx and p-type Hf0.3Zr0.7CoSn0.3Sb0.7 that contains ZrO2 nanoparticle inclusions can be indexed to the cubic Mg–Ag–As crystalline structure (space group  ). In Fig. 1(b), an impurity phase can also be identified as either ZrO2 or HfO2 in the p-type alloys dispersed with ZrO2 nanoparticle inclusions. Due to the similar crystal structure and lattice parameter of HfO2 and ZrO2, further identification of the impurity phase requires TEM and SEM measurements.
X-ray diffraction patterns of (a) n-type Hf0.6Zr0.4NiSn1−xSbx, where x = 0.005, 0.02 and (b) p-type Hf0.3Zr0.7CoSn0.3Sb0.7 embedded with 0, 1, and 2% ZrO2 nanoparticles.

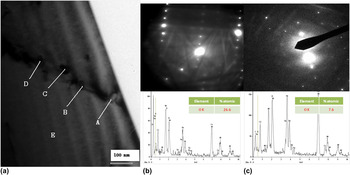
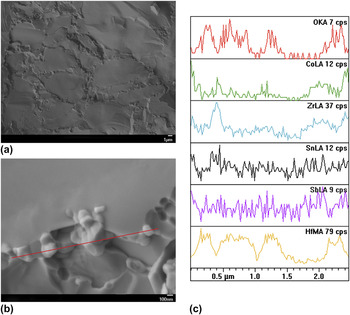
As shown in the TEM images of Fig. 2(a), for Hf0.3Zr0.7CoSn0.3Sb0.7 dispersed with 2 vol.% ZrO2 nanoparticle inclusions, grain sizes of 50–80 nm can be seen at the grain boundaries of the main matrix. In other regions, nanoparticle sizes of 200–300 nm were also detected. Different diffraction patterns as well as different oxygen contents measured by EDS at spots B (nanoparticle) and E (main matrix) shown in Figs. 2(b) and 2(c) further confirm the existence of oxide nanoinclusions. The micromorphological structures of fractured surface of Hf0.3Zr0.7CoSn0.3Sb0.7 dispersed with 2% ZrO2 nanoparticles obtained from SEM study are shown in Figs. 3(a) and 3(b). The typical main matrix grain sizes are in the range of 5–25 μm, while for nanoinclusions, they vary from 80 to 250 nm. The range of nanoparticle sizes detected can be attributed to particle coagulation due to nonuniform dispersion of the particles in the matrix. The EDS patterns shown in Fig. 3(c) indicate that the composition of the nanoinclusions is mainly HfO2, since the spectra of element Hf and O consistently peak up synchronously whenever the line scan goes across the nanoparticles.
(a) Transmission electron microscopy image of Hf0.3Zr0.7CoSn0.3Sb0.7 dispersed with 2% ZrO2 nanoparticles showing nanoinclusions on the grain boundary of main matrix, (b, c) diffraction and energy dispersive spectroscopy (EDS) patterns from nanoparticles (location B) and main matrix (location E), respectively.

Scanning electron microscopy images of Hf0.3Zr0.7CoSn0.3Sb0.7 dispersed with 2% ZrO2: (a) grains of main matrix, (b) nanoinclusions on the grain boundary, and (c) EDS line scan from left to right of (b).

2. TE properties
a. n-Type phases
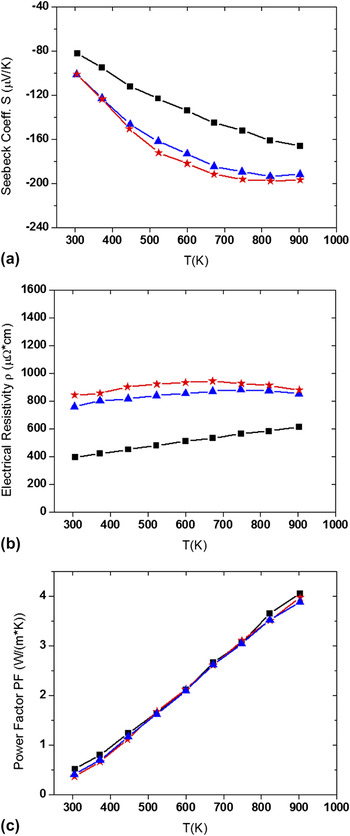
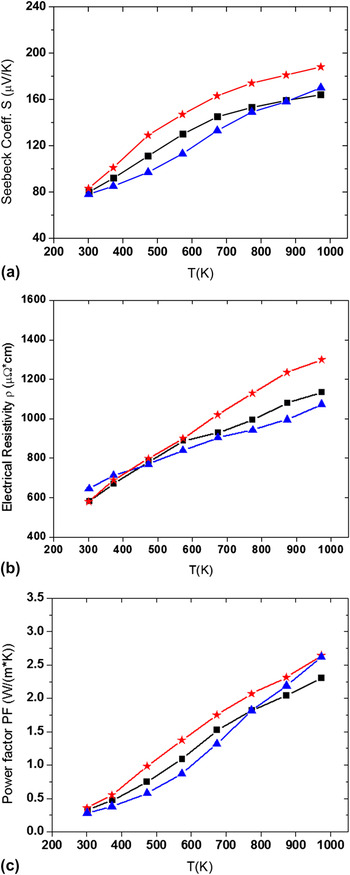
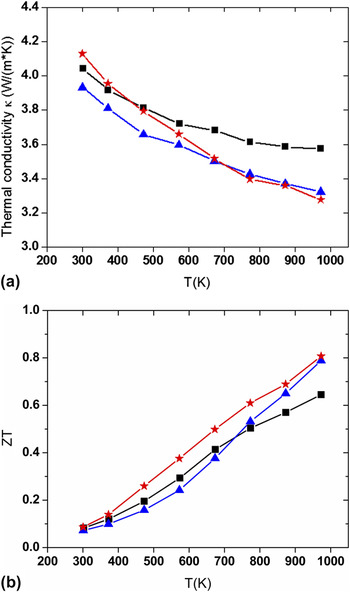
To explore the doping level in optimizing the dimensionless figure of merit of Hf0.6Zr0.4NiSn1−xSbx, alloys that contain 0.5, 1, and 2 at.% Sb were examined. Figures 4(a) and 4(b) show that as the Sb doping level decreases, the Seebeck coefficient increases over the entire temperature range 300–900 K in the x = 0.005 sample and, meanwhile, the electrical resistivity also increases accordingly. The observed trend is similar to that reported for other HfZr-based HH phases.Reference Yu, Zhu, Shi, Zhang, Zhao and He2 Fig. 4(c) shows a slight increase in the resultant power factor in the high-temperature region. As can be seen in Fig. 5(a), the thermal conductivity decreases precipitously at lower Sb doping levels. The reduction in κ is mainly due to the decrease in κe, while the estimated κL actually increases at decreasing Sb content. In sum, the reduction in κe due to the decrease in electrical conductivity is largely responsible for the enhancement in ZT (from ∼0.96 to 1.05) at high temperatures shown in Fig. 5(b). The present finding is interesting in that it suggests yet another pathway to achieve higher ZT. By reducing κL of the main matrix via nanostructuring, further increase in ZT can be expected.
Thermoelectric (TE) properties of 0.5% (star), 1% (triangle), and 2 at.% (square) Sb doped n-type Hf0.6Zr0.4NiSn: (a) Seebeck coefficient S, (b) electrical resistivity Rho, and (c) power factor PF.

(a) Thermal conductivity κ and (b) dimensionless figure of merit ZT of 0.5% (star), 1% (triangle), and 2 at.% (square) Sb doped n-type Hf0.6Zr0.4NiSn.

b. p-Type phases
Nanoparticles dispersed in the main matrix has been shown to reduce the lattice thermal conductivity due to an increase in phonon scattering, resulting in the enhancement of ZT.Reference Zide, Bahk, Singh, Zebarjadi, Zeng, Lu, Feser, Xu, Singer, Bian, Majumdar, Bowers, Shakouri and Gossard13, Reference Mingo, Hauser, Kobayashi, Plissonnier and Shakouri21 Phonon scattering increases as the nanograin size becomes comparable to the mean free path of phonons. The existence of second-phase nanoparticles can also serve as potential barriersReference Kishimoto, Tsukamoto and Koyanagi14, Reference Popescu and Woods15 that prohibit low energy carriers from passing through the grain boundaries, hence increasing the Seebeck coefficient. However, the present methods of dispersing nanoparticles in a bulk matrix do not allow a direct comparison with nanocomposite models that assume a uniform distribution of nanoparticles in the matrix. This is because these methods tend to produce coalescence of particles as the volume fraction of nanoparticles increases. In the present samples, there is also an apparent isovalent substitution of 1–2 at.% Hf for Zr in the matrix, evident from the detection of HfO2 nanoparticles in the HH-phase matrix. The interplay as well as competition of these various effects must be taken into account in interpreting the TE properties. Due to the initial decrease of Hf content in the host, the electrical resistivity of the ∼1% HfO2 sample decreases, as seen in Fig. 6(b). Nevertheless, the thermal conductivity is reduced, indicating a reduced lattice thermal conductivity, as shown in Fig. 7(a). As for the 2% HfO2 sample, the lattice thermal conductivity remains nearly the same as that of the host alloy, which may be attributed to the decrease in the density of nanoparticles due to particles coalescence. On the other hand, since HfO2 is an insulator, the electrical resistivity of the composite is increased. In Fig. 6(a), the Seebeck coefficient is seen to increase in the samples that contain 2% oxide nanoinclusions, by as much as 15% at 970 K. Although the 1% HfO2 sample exhibits an electrical resistivity lower than that of the host sample, its thermopower actually increases to exceed that of the host sample at high temperatures. Overall, the power factor of both composites increases by up to ∼13% at 970 K [Fig. 6(c)]. The present finding lends support to the energy filtering mechanism of thermopower enhancement facilitated by the nanoparticles inclusions. Similar effect was reported in HH phases embedded with InSb semiconductor nanoparticles.Reference Xie, Heb, Zhu, Su, Wang, Holgate, Graff, Ponnambalam, Poon, Tang, Zhang and Tritt18 As shown in Fig. 7(b), ZT increases by ∼23%, from 0.65 to 0.8. Overall, the increase in ZT is due to a combination of enhanced power factor and reduced electronic or lattice thermal conductivity. Thus, the increase in ZT in these nanoparticles-in-matrix alloys has an electronic as well as lattice origin. Further increase in ZT to 1, or higher, may be attainable by reducing κL through nanostructuring, as suggested by recent results obtained in another HH phase.Reference Yan, Joshi, Liu, Lan, Wang, Lee, Simonson, Poon, Tritt, Chen and Ren3
TE properties of 0% (square), 1% (triangle), and 2% (star) ZrO2 nanoparticles dispersed p-type Hf0.3Zr0.7CoSn0.3Sb0.7: (a) Seebeck coefficient S, (b) electrical resistivity Rho, and (c) power factor PF.

(a) Thermal conductivity κ and (b) dimensionless figure of merit ZT of 0% (square), 1% (triangle), and 2% (star) ZrO2 nanoparticles dispersed p-type Hf0.3Zr0.7CoSn0.3Sb0.7.

IV. NANOSTRUCTURE MODEL OF THERMAL CONDUCTIVITY FOR HIGHER ZT
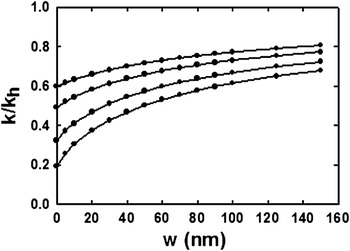
Recent modeling study of lattice thermal conductivity of nanocomposites, to be presented elsewhere, can be used to estimate the degree of ZT enhancement in fully nanostructured HH phases. Briefly, the effective medium approach (EMA) studied by Nan et al.Reference Nan, Birringer, Clarke and Gleiter22 was extended to include higher volume fractions of particle inclusions, achieved by taking into account higher order phonon scattering from nanograins or nanodomains. The effective lattice thermal conductivity (k) was obtained by solving a set of modified EMA equations. Effect of particle size (a) to phonon mean free path (L) ratio, a/L, on the reduction of κL (denoted by k h) of the prenanostructured host was investigated and enhancement of ZT was obtained assuming a constant power factor. Values of computed k were found to compare well with experimental results for monolithic nanostructured SiGe, BiTeSb, and HH phases. The modified EMA does not involve extensive computations and therefore it provides a convenient method for screening prospective high-ZT materials. For a fully nanostructured phase, k could be approximated by k/k h ≈ 1/(1 + GL/a), where G ∼ 10. However, bulk nanostructured samples inevitably exhibit grain size dispersions that must be considered in computing phonon scattering. For computational convenience, a uniform distribution of nanodomain sizes ranging from a o to a o+w instead of Gaussian distribution was assumed. Averaging over the distribution, the L/a factor in the k/k h expression was replaced by <L/a> = (L/w)ln(1 + w/a o). Figure 8 illustrates the effect of grain size distribution in the HH phase Hf0.6Zr0.4NiSn0.995Sb0.005. The latter alloy in the prenanostructured state exhibits κ = 3.8 W/m/K, κe = 2.1 W/m/K, k = κ − κe = 1.7 W/m/K, and ZT = 1.05 at 900 K. Using the plots in the figure, ZT values for nanostructured samples of the alloy with different grain size distributions can be predicted. For example, with grain sizes in the range 10–15 nm, k/k h = 0.38, which results in k = 0.65 W/m/K, κ(nano) = 2.75 W/m/K, and ZT(nano) = 1.45. By further reducing the grain sizes to 5–15 nm, ZT(nano) increases to ∼1.57. Coupled with the possibility of enhancing the power factor, there exists a good prospect for further increase of the ZT value in these material systems.
Normalized effective lattice thermal conductivity k/k h of fully nanostructured Hf0.6Zr0.4NiSn0.995Sb0.005 at 900 K as a function of width of grain size distribution (w) for various grain size ranges (a o, a o + w), plotted from top to bottom: a o = 30, 20, 10, and 5 nm.

V. DEVICE PERFORMANCE
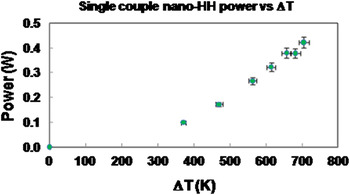
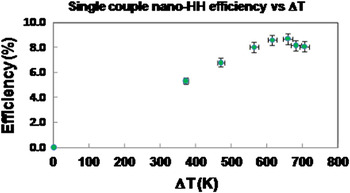
Heat-to-electric power generation devices were fabricated using the p- and n-type nanostructured HH materials namely Hf0.3Zr0.7CoSn0.3Sb0.7/nano-ZrO2 and Hf0.6Zr0.4NiSn0.995Sb0.005 discussed in Section III were power tested to determine the power output and efficiency that can be achieved with these new materials. Power testing was carried out using a Keithley 2440 source meter for power measurement which sweeps a voltage and measures a current, identifying the maximum power point where the source meter impedance matches the HH p–n device. Between voltage sweeps, the source meter voltage is set to provide a continuous load at the last measured maximum power voltage. Temperatures of the cold side and hot side of the device are measured at the same time the maximum power point is measured. Efficiency is determined from measuring the heat flow (Q) through the device using a calibrated Q-meter and the electric power output. Power test results for a nanostructured HH couple are shown in Figs. 9 and 10. At T hot = 748 °C and a ΔT of 704 °C, electrical power out is 423 mW with 8.1% efficiency. The maximum efficiency of 8.7% was achieved at T hot = 697 °C with an electrical power out of 380 mW at a ΔT of 657 °C. The efficiency of 8.7% is about 10–15% better than state-of-the-art PbTe power conversion devices. Hence, this efficiency result represents an important step towards wider application of nano-HH materials for efficient power conversion devices.
Power output from a single p–n couple made from reported half-Heusler (HH) materials as a function delta T; T cold ∼ 40 °C

Heat-to-electric conversion efficiency for a single p–n couple made from nanostructured HH materials as a function delta T; T cold ∼ 40 °C

VI. SUMMARY
Recent investigation of HH alloys as high-temperature TE materials has utilized alloying and nanostructuring to enhance their TE performance. By doping the alloy host as well as constituting bulk nanoparticles-in-matrix composite, n-type and p-type HH alloys have been shown to exhibit ZT = 1.05 and 0.8 near 900–1000 K, respectively. Analysis based a newly developed nanostructure model of lattice thermal conductivity indicated that the prospect for achieving ZT values appreciably higher than 1 in nanostructured HH alloy systems is good. Tests performed on p–n couple devices from the newly developed HH materials showed good power generation efficiencies reaching 8.7% for hot-side temperatures of about 700 °C, about 10–15% better than state-of-the-art PbTe power conversion devices.
ACKNOWLEDGMENTS
The work at University of Virginia is supported by a subcontract from a RTI International thermoelectric project sponsored by Honeywell under the auspices of the Army Research Lab. The work at Clemson University is supported by DOE/EPSCoR Implementation Grant (No. DE-FG02-04ER-46139) and the SC EPSCoR cost-sharing program.