





Introduction
Effective conservation of mobile and specialist species requires understanding how habitat varies across space and time (Stone et al. Reference Stone, Armstrong and Parker2025; Xing et al. Reference Xing, Fawen and Keming2025), as this information is essential for identifying key habitats, delineating critical areas for conservation (Morán-Ordóñez et al. Reference Morán-Ordóñez, Bota, Brotons, Canessa, García de la Morena, Mañosa, Miret-Minard, Morales, Traba, Villero and Hermoso2025), and informing effective conservation strategies (Byers et al. Reference Byers, Copsey, Lees, Miller and Traylor-Holzer2022). Patterns of habitat use are closely linked to topography, which influences the distribution and accessibility of resources such as food, water, and shelter, as well as the energetic costs of movement (Bélisle et al. Reference Bélisle, Desrochers and Fortin2001; Kauffman et al. Reference Kauffman, Aikens, Esmaeili, Kaczensky, Middleton, Monteith, Morrison, Mueller, Sawyer and Goheen2021; O’Mara et al. Reference O’Mara, Amorim, Scacco, McCracken, Safi, Mata, Tomé, Swartz, Wikelski, Beja, Rebelo and Dechmann2021; Ribon et al. Reference Ribon, dos Santos, De Marco and Marini2021; Stone et al. Reference Stone, Armstrong and Parker2025; Xing et al. Reference Xing, Fawen and Keming2025). Fine-scale topographic features (e.g., valleys, depressions, and local terrain position) may be more relevant than broad elevational gradients in shaping habitat use. These patterns can be especially pronounced in specialist species, as shown in some Neotropical forest birds that differentially use lowlands, ravines, and slopes depending on resource availability (Ribon et al. Reference Ribon, dos Santos, De Marco and Marini2021).
However, understanding these spatial patterns requires a temporal perspective, as many species shift habitat use throughout the year. Because most studies rely on short-term observations, our ability to identify year-round habitat preferences and their environmental drivers remains limited. This gap is particularly important for specialist bird species, which depend on specific environmental conditions and are highly vulnerable to habitat loss, habitat fragmentation, and climate change (Rivas-Salvador and Reif Reference Rivas-Salvador and Reif2023; Soto-Saravia et al. Reference Soto-Saravia, Garrido-Cayul, Avaria-Llautureo, Benítez-Mora, Hernández and González-Suárez2021).
Passive acoustic monitoring (PAM) offers a powerful approach to overcome these limitations, enabling continuous, non-invasive data collection across large and remote areas (Oliver et al. Reference Oliver, Ellis, Chmura, Krause, Pérez, Sweet, Gough, Wingfield and Boelman2018; Pillay et al. Reference Pillay, Fletcher, Sieving, Udell and Bernard2019). Acoustic data can be efficiently processed using automated recognition algorithms such as BirdNET (Kahl et al. Reference Kahl, Wood, Eibl and Klinck2021), a convolutional neural network capable of detecting and classifying thousands of species. However, the performance of such models is influenced by environmental conditions and soundscape characteristics, which may affect detection accuracy and reliability. This issue remains insufficiently evaluated for tropical birds (Winiarska et al. Reference Winiarska, Pérez-Granados, Budka and Osiejuk2024), particularly for species with low and irregular vocal activity, highlighting the need for validation under real field conditions.
A prime example of a threatened, highly mobile habitat specialist is Pharomachrus mocinno mocinno (Resplendent Quetzal), an iconic mountain bird of Mesoamerica. The species is classified as Near Threatened due to habitat loss and fragmentation and depends on mature cloud forests for nesting and feeding (IUCN 2023; Powell and Bjork Reference Powell and Bjork1995; Solórzano et al. Reference Solórzano, Castillo, Valverde and Avila2000; Wheelwright Reference Wheelwright1983). Its altitudinal movements are closely linked to seasonal fruit availability, increasing its vulnerability to changes in habitat structure and connectivity (Powell and Bjork Reference Powell and Bjork1995; Wheelwright Reference Wheelwright1983).
In these instances, acoustic detection offers a valuable alternative, as Pharomachrus mocinno is a vocal species with a diverse repertoire (LaBastille et al. Reference LaBastille, Allen and Durrell1972) that includes territorial, alarm, courtship, and contact calls (Figure 1), produced by one or both sexes depending on behavioral context (Bolaños-Sittler Reference Bolaños Sittler2019). Vocal activity peaks at dawn and dusk, and calls consist of low-frequency tonal signals (approximately 0.5–2 kHz), typically arranged in repeated syllables, which can be effectively recorded using autonomous devices. These vocalizations play key roles in territory defense, mate attraction, and group cohesion, supporting their use as indicators of presence and behavior (Bolaños-Sittler Reference Bolaños Sittler2019). Vocalizations of P. mocinno can propagate up to approximately 128 m in cloud forest habitats; beyond this distance, signal quality becomes increasingly degraded, particularly for contact and courtship calls (Bolaños-Sittler Reference Bolaños Sittler2019). Detection range is not uniform, being greater in front of the recorder and lower to the sides and rear, and varies among call types, with territorial and alarm vocalizations propagating more effectively (Bolaños-Sittler Reference Bolaños Sittler2019).
Representative spectrograms of the primary vocalization types of the Resplendent Quetzal (Pharomachrus mocinno), including territorial, courtship, alarm, and contact calls. Although vocal activity is relatively infrequent and unpredictable—even during the breeding season—and detectability may be affected by environmental noise such as wind (Bolaños-Sittler Reference Bolaños Sittler2019), PAM remains a highly valuable tool for studying this otherwise cryptic species.

Figure 1. Long description
Four spectrograms depict different vocalization types of the Resplendent Quetzal. Panel A: The spectrogram labeled ‘Territorial’ shows frequency (kHz) on the vertical axis and time (seconds) on the horizontal axis. It displays two distinct clusters of frequency patterns around 1 kHz and 1.5 kHz. Panel B: The spectrogram labeled ‘Courtship’ also has frequency (kHz) on the vertical axis and time (seconds) on the horizontal axis. It shows a continuous, wavy frequency pattern around 1 kHz. Panel C: The spectrogram labeled ‘Alarm’ has frequency (kHz) on the vertical axis and time (seconds) on the horizontal axis. It displays multiple vertical streaks of frequency patterns ranging from 1 kHz to 2.5 kHz. Panel D: The spectrogram labeled ‘Contact’ has frequency (kHz) on the vertical axis and time (seconds) on the horizontal axis. It shows scattered frequency patterns around 1 kHz and 1.5 kHz.
Given both the ecological complexity of habitat use and the need to validate automated detection tools under real-world conditions, this study applies passive acoustic monitoring combined with BirdNET to investigate the vocal ecology of P. mocinno in a protected cloud forest in Guatemala. Specifically, we (1) evaluate the performance of BirdNET in detecting P. mocinno vocalizations, (2) characterize temporal patterns of its vocal activity, and (3) assess how acoustic activity varies across topographic features as an indicator of habitat use.
Materials and methods
Study area
This study was conducted in the Biotopo Universitario Mario Dary Rivera para la Conservación del Quetzal (BUCQ), a protected area located 160 km from Guatemala City, along the CA-9 highway, in the municipality of Purulhá, Department of Baja Verapaz, central Guatemala, and designated for the conservation of P. mocinno. The BUCQ comprises 1,017 hectares of primary cloud forest, with an additional buffer zone spanning 5,241 hectares. The area is characterized by highly variable topography, including steep slopes, deep ravines, and elevations ranging from 1,200 to 2,300 m above sea level. Climatically, the region experiences an average temperature of 18°C, a relative humidity of 93.9%, and an average annual rainfall of 2,092 mm (Centro de Estudios Conservacionistas 2019). The landscape surrounding the BUCQ includes several private protected areas and patches of cloud and montane forest, which are interspersed with various land uses such as farms, human settlements, and touristic areas, among others. These agricultural areas include crops such as tomato (Solanum lycopersicum), sweet pepper (Capsicum annuum), various vegetables, and leatherleaf fern (Rumohra adiantiformis).
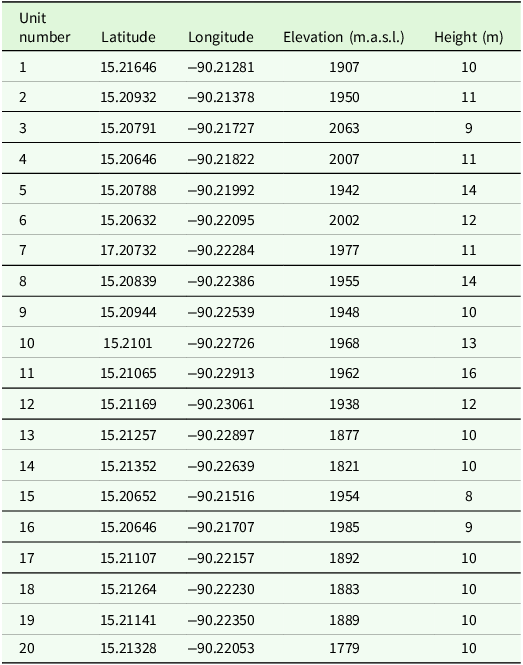
Twenty AudioMoth® 1.2.0 (Open Acoustic Devices) autonomous recording units (Hill et al. Reference Hill, Prince, Snaddon, Doncaster and Rogers2019), equipped with built-in microphones (i.e., no external microphones), were deployed across the study area (Figure 2) with a minimum spacing of 300 m to minimize overlap in acoustic detections (Bolaños-Sittler Reference Bolaños-Sittler, Sueur, Fuchs and Aubin2019). Each unit was housed in a protective polycarbonate AudioMoth IPX7 case to reduce damage from humidity and environmental exposure. Recordings were collected at a sampling rate of 48 kHz, 16-bit resolution, and medium gain. The devices operated continuously for one year, recording 1-minute audio segments every 20 minutes, resulting in 63,530 recordings (1,390 total hours). Recorders were installed at heights of 8–20 m above ground, corresponding to the typical perching and flight strata of the P. mocinno in cloud forest habitats. The geographic coordinates, elevation, and installation height of each unit are detailed in Table 1. To install, retrieve, and service the recorders (e.g., battery replacement), a rope-based system using durable plastic cords and wooden support was employed. In most cases, park rangers manually secured the ropes over suitable branches to position the devices in the canopy.
Geographic location, elevation, and height above vegetation of autonomous audio recorders deployed in the study area

Table 1. Long description
A table with 20 rows and 5 columns detailing the geographic location, elevation, and height of autonomous audio recorders deployed in Guatemala. The columns are labeled Unit number, Latitude, Longitude, Elevation (m.a.s.l.), and Height (m). Each row provides specific data for each unit. Row 1: Unit number, 1; Latitude, 15.21646; Longitude, -90.21281; Elevation (m.a.s.l.), 1907; Height (m), 10. Row 2: Unit number, 2; Latitude, 15.20932; Longitude, -90.21378; Elevation (m.a.s.l.), 1950; Height (m), 11. Row 3: Unit number, 3; Latitude, 15.20791; Longitude, -90.21727; Elevation (m.a.s.l.), 2063; Height (m), 9. Row 4: Unit number, 4; Latitude, 15.20646; Longitude, -90.21822; Elevation (m.a.s.l.), 2007; Height (m), 11. Row 5: Unit number, 5; Latitude, 15.20788; Longitude, -90.21992; Elevation (m.a.s.l.), 1942; Height (m), 14. Row 6: Unit number, 6; Latitude, 15.20632; Longitude, -90.22095; Elevation (m.a.s.l.), 2002; Height (m), 12. Row 7: Unit number, 7; Latitude, 17.20732; Longitude, -90.22284; Elevation (m.a.s.l.), 1977; Height (m), 11. Row 8: Unit number, 8; Latitude, 15.20839; Longitude, -90.22386; Elevation (m.a.s.l.), 1955; Height (m), 14. Row 9: Unit number, 9; Latitude, 15.20944; Longitude, -90.22539; Elevation (m.a.s.l.), 1948; Height (m), 10. Row 10: Unit number, 10; Latitude, 15.2101; Longitude, -90.22726; Elevation (m.a.s.l.), 1968; Height (m), 13. Row 11: Unit number, 11; Latitude, 15.21065; Longitude, -90.22913; Elevation (m.a.s.l.), 1962; Height (m), 16. Row 12: Unit number, 12; Latitude, 15.21169; Longitude, -90.23061; Elevation (m.a.s.l.), 1938; Height (m), 12. Row 13: Unit number, 13; Latitude, 15.21257; Longitude, -90.22897; Elevation (m.a.s.l.), 1877; Height (m), 10. Row 14: Unit number, 14; Latitude, 15.21352; Longitude, -90.22639; Elevation (m.a.s.l.), 1821; Height (m), 10. Row 15: Unit number, 15; Latitude, 15.20652; Longitude, -90.21516; Elevation (m.a.s.l.), 1954; Height (m), 8. Row 16: Unit number, 16; Latitude, 15.20646; Longitude, -90.21707; Elevation (m.a.s.l.), 1985; Height (m), 9. Row 17: Unit number, 17; Latitude, 15.21107; Longitude, -90.22157; Elevation (m.a.s.l.), 1892; Height (m), 10. Row 18: Unit number, 18; Latitude, 15.21264; Longitude, -90.22230; Elevation (m.a.s.l.), 1883; Height (m), 10. Row 19: Unit number, 19; Latitude, 15.21141; Longitude, -90.22350; Elevation (m.a.s.l.), 1889; Height (m), 10. Row 20: Unit number, 20; Latitude, 15.21328; Longitude, -90.22053; Elevation (m.a.s.l.), 1779; Height (m), 10.
Location of the study area, showing the Biotopo Universitario Mario Dary Rivera para la Conservación del Quetzal (BUCQ) in the department of Baja Verapaz, Guatemala (top left), the sampled area outlined with a square within the protected area (top right), and the placement of 20 autonomous recording units (AU1–AU20) across the sampled area in the mid-lower portion of the protected area (bottom).

Figure 2. Long description
Panel A: A map of Central America highlighting Guatemala and the Biotopo Universitario Mario Dary Rivera protected area. Panel B: A zoomed-in map of the protected area in Baja Verapaz, Guatemala, with the sampled area outlined. Panel C: A detailed map of the sampled area showing the placement of 20 autonomous recording units (AU1–AU20) and the CA14 Highway. The map includes markers for the entrance and recorder locations, and a compass rose indicating direction.
The audio data were analyzed using BirdNET (Kahl et al. Reference Kahl, Wood, Eibl and Klinck2021), version 1.2.0, a software tool designed for automated identification of bird vocalizations. The algorithm, recently expanded to include over 3,000 bird species (Wood et al. Reference Wood, Kahl, Barnes, Van Horne and Brown2023), processes audio recordings in 3-second segments and assigns a prediction score to each species. BirdNET is based on a convolutional neural network (CNN) trained on large datasets of annotated bird vocalizations. Audio recordings are converted into spectrograms, which are used as input to the model to detect species-specific acoustic patterns. The resulting prediction score reflects the similarity between the analyzed signal and the acoustic characteristics of each species in the training dataset. This score represents a machine-learning likelihood and should not be interpreted as an ecological probability of species presence, thus requiring validation before ecological inference.
The performance of the automated detection system was evaluated by comparing BirdNET outputs with manually annotated vocalizations of P. mocinno. To ensure consistency between both datasets, detections and annotations were analyzed at a temporal resolution of 3-second windows, corresponding to the native output of BirdNET. This approach avoids underestimating true positives when manually annotated vocal bouts extend across multiple consecutive detection windows.
The analysis was conducted using a minimum confidence threshold of 0.5, a window length of 3 s, a sensitivity setting of 1.0, and no overlap between consecutive segments. Geographic coordinates were provided to enable location-based filtering, with a location filter threshold of 0.03, and analyses were performed across the full annual cycle.
To examine the relationship between singing activity and topographic features, a confidence threshold was established to determine the presence of Resplendent Quetzal vocalizations. Field data were annotated, and 500 detections with varying probability scores were randomly selected for validation.
Topographical analysis
The study area’s topography was analyzed using digital elevation models (DEMs) and geographic information systems (GIS). Data on elevation, slope, and ravine presence were extracted for each recording point. Statistical analyses were conducted to assess correlations between the Quetzals’ activity patterns and the topographical features of the terrain.
Statistical analysis
To ensure reproducibility and to appropriately reflect the structure of the dataset, analyses were conducted at the level of individual recordings. Although recorders were spatially separated to minimize spatial pseudoreplication, repeated observations within sites may introduce temporal autocorrelation. Given the exploratory scope of this analysis and the focus on broad temporal and topographic patterns, recordings were treated as independent observational units. This approach allowed us to retain temporal variability while avoiding potential biases associated with pooling detections across sites or aggregating them over time.
Vocal activity was modeled using a generalized linear model (GLM) with a negative binomial distribution to account for overdispersion in count data. The response variable corresponded to the number of detections per recording unit. Recordings were treated as independent observational units, as described above.
Predictor variables included month (categorical variable) to account for seasonal variation and Topographic Position Index (TPI) as a descriptor of local terrain position. TPI values were extracted for each recording location.
Prior to modeling, exploratory analyses were conducted to assess collinearity among topographic variables. Based on these analyses and ecological interpretability, TPI was retained as the primary topographic predictor in the final model.
Given the scope of the dataset, we focused on a reduced model:
 ${\rm count} \sim {\rm TPI} + {\rm month}$
All analyses were performed in Python using the libraries statsmodels (for statistical modeling), pandas (for data handling), and NumPy (for numerical operations).
Results
Detection performance evaluation
Based on comparisons with manually annotated vocalizations, evaluated at a 3-s temporal resolution, the model yielded 307 true positives (TP), 7 false positives (FP), and 610 false negatives (FN). This approach avoids underestimating true positives when annotated vocal bouts span multiple consecutive detection windows. Detection precision was high (0.978), whereas recall was moderate (0.335), resulting in an F1-score of 0.499.
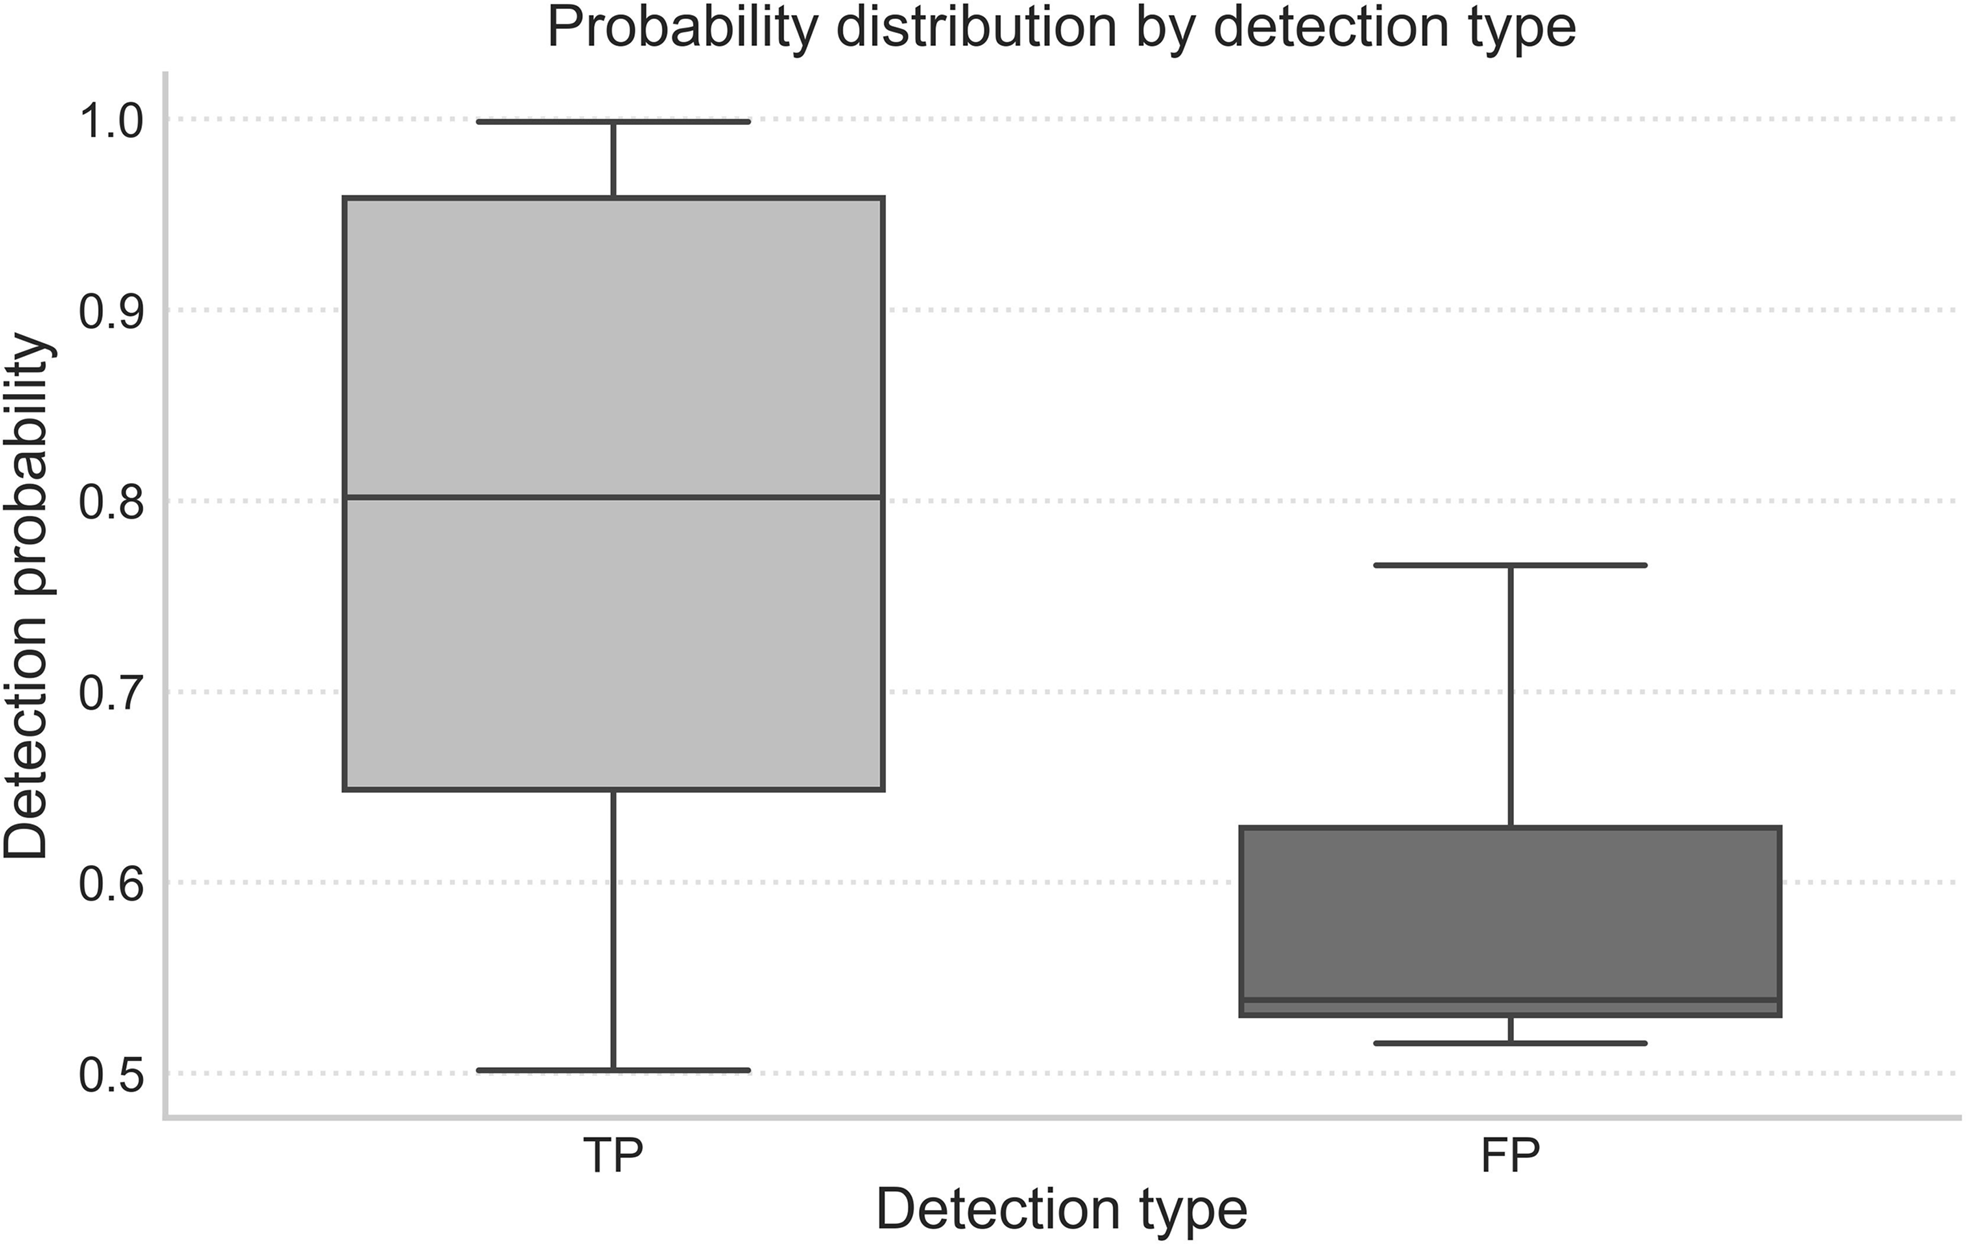
The probability scores associated with each detection were further analyzed according to their match type. TP exhibited a higher mean probability (0.79 ± 0.16), with 75% of detections exceeding a probability of 0.96 (Figure 3). In contrast, FP showed lower probability values (mean = 0.60 ± 0.10), with a narrower distribution and most values below 0.63. These differences indicate that the model assigns substantially higher confidence to correct detections than to incorrect ones.
Detection probability score distributions for true positives (TP) and false positives (FP) in acoustic detections of P. mocinno. True positives exhibit higher mean scores and wider dispersion compared to false positives, which cluster at lower values.

Because only detections with probability ≥0.5 were included in the analysis, low-confidence detections were excluded. As a result, recall values should be interpreted as conservative estimates, as additional true detections may exist below this threshold.
Receiver Operating Characteristic (ROC) analysis yielded an area under the curve (AUC) of 0.83, indicating moderate discriminative performance. However, given the highly imbalanced nature of the dataset, ROC curves may provide an optimistic estimate of performance, as they do not strongly penalize false positives.
In contrast, the F1-score versus threshold analysis (Figure 4) provides a more informative representation of the trade-off between precision and recall. The F1-score reached its maximum at low probability thresholds (very low values), indicating that lower thresholds improve detection completeness. However, increasing the threshold substantially reduces false positives while maintaining high confidence in retained detections. Therefore, a threshold of 0.5 was selected as a conservative compromise, prioritizing detection reliability over completeness.
F1-score versus threshold curve showing the trade-off between precision and recall in acoustic detections of P. mocinno.

Acoustic activity patterns of P. mocinno
Using the CNN-based detection system and applying a probability threshold of 0.5, a total of 525 detections of P. mocinno were obtained. These detections were distributed across several months of the year. The highest number occurred in January (224 detections), followed by March (113), June (58), and April (53). Lower numbers were recorded in February (47), May (16), and November (11). Minimal detection activity was observed in July (2 detections) and October (1 detection), while no detection was recorded in the remaining months (Figure 5).
Monthly detections of Pharomachrus mocinno in the study area.

The hourly distribution of detections revealed a marked peak in vocal activity during the early morning (Figure 6). The highest number of detections was recorded at 06:00 (339 detections), indicating a strong concentration of vocal activity around dawn. A gradual decline in detections was observed from 07:00 (23 detections) through 11:00 (18 detections). A smaller secondary peak was observed in the late afternoon, particularly at 17:00 (48 detections) and 16:00 (33 detections), while lower detection rates were recorded during mid-morning and early afternoon hours (Figure 6).
Hourly acoustic detections of Pharomachrus mocinno.

The number of detections per site varied widely (Figure 7). Site AU12 showed the highest number of detections, accounting for over 45% of the total. This site is located at a relatively high elevation (1,957 m) and stands out as the most remote, positioned furthest from the main access road (Figure 7). Other sites with notable numbers of detections included AU11, AU13, AU07, and AU08, all situated near AU12 and generally at higher elevations. In contrast, several sites showed very few or no detections, including AU04, AU05, AU15, and AU16, suggesting spatial variation in habitat use or vocal activity. The site with the highest number of cumulative detections is AU12 (277 detections), while AU04, AU10, and AU16 each registered only one detection.
Number of detections per site at the study site. Numeric site labels represent Autonomous Recording Units (AU1–AUn), with the prefix omitted for visual clarity. The number of detections varied across months (Figure 8). AU12 recorded the highest number of detections in January and February. Recorders that recorded the most at the beginning of the year were also the most consistent in detection numbers during the first semester.

Location of automatic recording devices at the study site. The size of each ring represents the acoustic activity of P. mocinno using a sublinear square root scale (SQR). Colors indicate the month of detection, ranging from yellow (January) to purple (December).

Topographic and temporal drivers of P. mocinno detections
Topographic and temporal drivers of detections were assessed using a negative binomial regression model to account for overdispersion in detection counts.
TPI showed a negative effect on detection counts, indicating a tendency for higher detections in areas with lower TPI values, corresponding to more sheltered or valley-like terrain. However, this effect was not statistically significant (p = 0.078).
Seasonal variation was observed across months, with higher detection counts concentrated in the early part of the year, particularly in January.
Discussion
Detection performance evaluation
The automatic detection system for P. mocinno vocalizations showed high precision, with correct detections generally receiving high confidence scores and false positives clustering at lower scores. While some actual occurrences of the species may have gone undetected, the system effectively prioritized reliability over completeness. Analyses of detection thresholds highlighted the trade-off between maximizing detection and minimizing false positives, supporting the use of a higher threshold to ensure confident detections and reduce validation effort.
The results indicate that the detection probability score of the algorithm is a useful indicator for distinguishing correct from incorrect detections, making the system suitable for applications where minimizing false positives is critical. These results also indicate that BirdNET performs best under conditions where vocalizations are clearly detectable, background noise is limited, and signal structure is well defined. Under such conditions, the algorithm assigns consistently high confidence scores to true detections, enhancing reliability. In contrast, detection performance may decrease in acoustic complex environments, during low-intensity vocalizations, or when signals overlap with other species or environmental noise, which can contribute to false negatives.
It is important to note that the detection probability score generated by the algorithm does not directly correspond to the probability of detecting a species in the field from an ecological perspective. In this study, ecological detection probability was estimated through manual validation of the automatic results, which provided an independent measure of species occurrence. This distinction is critical, as the relationship between algorithm scores and true ecological detection may vary across habitats or geographic areas, meaning that thresholds calibrated in one forest may not be directly transferable to another. This highlights that detection performance is context-dependent, and factors such as habitat structure, background soundscape, and species vocal behavior can influence the effectiveness of automated classification.
The selection of the threshold to score should be established depending on the project’s objectives. For instance, higher thresholds are particularly appropriate in conditions where background noise or species richness may increase the risk of false positives, whereas lower thresholds may be more suitable in quieter environments where maximizing detection is prioritized. Low scores are recommended if the project aims to detect only the presence of the species or its call rate, while high scores should be used to determine the occupancy of the species in a certain area (Knight et al. Reference Knight, Hannah, Foleu, Scott, Brigham and Bayne2017). The presence information of this kind of threatened species and the information of its behavior (reflected in call rates or temporal call activity) are useful to determine the influence of human perturbance and threats to the species distribution that can be used to design effective management strategies (Sebastián-González et al. Reference Sebastián-González, Pang-Ching, Barbosa and Hart2015).
Overall, these findings emphasize that the performance of automated acoustic detection systems is influenced not only by algorithmic thresholds but also by environmental and acoustic conditions, which should be carefully considered when applying these tools in ecological studies. Soundscape composition, including species richness, vocal overlap, and the presence of acoustically dominant taxa (e.g., howler monkeys or other loud species), may affect detection performance and increase the likelihood of false positives or false negatives. Future work should evaluate performance across different soundscapes, as models calibrated in one ecosystem may not be directly transferable to others without additional validation.
Acoustic activity patterns
Acoustic activity of P. mocinno showed clear seasonal variation, with peaks in the early months of the year. This pattern likely reflects increased vocal activity associated with breeding season dynamics, including courtship, nesting, and chick rearing. Conversely, the lower detection rates observed toward the end of the year may reflect post-breeding dispersal away from reproductive areas, a trend consistent with previous findings (Bustamante-Castillo. et al. Reference Bustamante-Castillo, Bosarreyes and Barrios-Izas2024; Powell and Bjork Reference Powell and Bjork1995; Wheelwright Reference Wheelwright1983).
P. mocinno was most vocally active in the early morning, exhibiting a bimodal pattern with a pronounced peak at dawn and a smaller peak in the late afternoon. The dawn peak corresponds to the dawn chorus, a phenomenon widely documented in Neotropical birds, when acoustic conditions favor sound transmission and coincide with key reproductive behaviors such as mate attraction and territory defense (Catchpole and Slater Reference Catchpole and Slater2008; Xia et al. Reference Xia, Wei, Lloyd, Liu, Wu and Zhang2014). This bimodal daily pattern is consistent with observations in other forest Neotropical species (Ducrettet et al. Reference Ducrettet, Forget, Ulloa, Yguel, Gaucher, Princé, Haupert and Sueur2020). For instance, both the buff-breasted wren (Cantorchilus leucotis) and the thrush-like wren (Campylorhynchus rufinucha) exhibit the largest vocal activity around sunrise and a second, smaller peak near dusk. In the buff-breasted wren, the evening peak has been proposed to enhance communication between pair members, with both mates vocalizing before returning to nests or roosts (Amorós-Ausina et al. Reference Amorós-Ausina, Schuchmann, Marques and Pérez-Granados2024). These parallels suggest that the bimodal pattern observed in P. mocinno may serve similar functions related to reproductive and territorial behaviors. Nevertheless, our understanding of the factors influencing diel vocal activity in tropical birds remains limited, highlighting the value of studies such as ours in contributing to species-specific acoustic ecology (Pérez-Granados and Schuchmann Reference Pérez-Granados and Schuchmann2021; Winiarska et al. Reference Winiarska, Pérez-Granados, Budka and Osiejuk2024).
In addition, understanding the temporal patterns of vocal activity in P. mocinno could improve sampling efficiency in monitoring programs (Pérez-Granados and Schuchmann Reference Pérez-Granados and Schuchmann2021; Tozer et al. Reference Tozer, Drake and Falconer2016). Targeting peak activity periods at dawn and dusk may optimize recording schedules, reduce data storage needs, simplify data analysis, and make more efficient use of time and resources, particularly in protected areas or study sites with limited capacity. Focusing on periods of peak vocal activity during early hours in peak months may help locate nesting sites, allowing targeted monitoring and management actions—such as protecting nests and minimizing egg and chick predation—that support the maintenance of healthy P. mocinno populations. Furthermore, this approach is well-suited for application in highly rugged and difficult-to-access terrains, which are common in montane habitats and along migratory routes, as is the case for the resplendent quetzal (Doren et al. Reference Van Doren, Lostanlen, Cramer, Salamon, Dokter, Kelling, Bello and Farnsworth2022). These advantages make it particularly relevant for monitoring the species across its entire distribution range. In addition, future studies on population structure and dynamics may benefit from focusing on these periods of peak vocal activity, potentially increasing detection rates and improving the overall effectiveness of conservation research.
Topographic and temporal drivers of P. mocinno detections
Our findings highlight key topographic features that influence the acoustic activity of P. mocinno, with TPI, rather than elevation, showing a consistent but non-significant effect on vocal behavior. Areas characterized by lower TPI values, corresponding to sheltered terrain such as ravines and small valleys, tended to support higher vocal activity, although this pattern was not statistically significant. This tendency may nonetheless reflect underlying ecological processes, such as favorable microclimates, increased cover, enhanced security, and greater resource availability, particularly during the reproductive season. This evidence may provide preliminary guidance on cloud forest restoration efforts by prioritizing sites with these characteristics and guiding specific actions, such as planting food resources for the quetzal, restoring natural refuges, and implementing artificial nests to enhance reproduction.
Similar patterns have been observed in other bird species, such as the Burrowing Parrot (Cyanoliseus patagonus), which selects specific ravines for nesting based on intrinsic morphological characteristics and whose reproductive output is influenced by both local ravine features and their position in the landscape relative to resources and human disturbance (Ramirez-Herranz et al. Reference Ramirez-Herranz, Rios, Vargas-Rodriguez, Novoa-Jerez and Squeo2017). This resemblance supports the idea that topographically complex habitats contribute to shaping behavioral components, such as vocal activity and courtship displays, as observed in P. mocinno. These results are also consistent with broader community-level studies, which have identified topography as one of the strongest predictors of bird community composition and species distribution (Zasadil et al. Reference Zasadil, Romportl and Horák2020).
In addition, the association between aspect and acoustic activity was only observed in exploratory analyses and should therefore be interpreted with caution, as it may reflect the influence of microclimatic conditions, such as temperature, humidity, and vegetation structure, that are shaped by variation in solar exposure. Differences in aspect have been linked to contrasting microclimates and vegetation characteristics in various landscapes (Desta et al. Reference Desta, Colbert, Rentch and Gottschalk2004; Gutiérrez-Jurado and Vivoni Reference Gutiérrez-Jurado and Vivoni2013; Yin et al. Reference Yin, Xie, Ma, Xie, Verger, Descals, Filella and Penuelas2023). While the underlying mechanisms in the Resplendent Quetzal remain to be confirmed, these findings underscore the potential influence of topographic variables like aspect on habitat use and vocal behavior in the species.
Temporal variables revealed clear patterns in detection probability, with higher activity during early morning hours and significant variation across months. In contrast, the previously reported interaction between altitude and month was not supported in the revised analysis and is therefore not retained. Although elevation is known to influence broader spatial distribution, it did not emerge as a significant predictor in the main models, suggesting that finer-scale topographic positioning may be more relevant for explaining acoustic detections. These results suggest that the influence of elevation on vocal activity is not constant throughout the year but rather modulated by seasonal dynamics. This aligns with known altitudinal movements of P. mocinno, which tend to occur towards the end of the year, typically between November and January, when individuals move from higher-elevation areas, commonly used for feeding, resting, and reproduction, to lower-elevation zones (Bustamante-Castillo et al. Reference Bustamante-Castillo, Bosarreyes and Barrios-Izas2024; Powell and Bjork Reference Powell and Bjork1995).
Although the specific drivers of these movements are not yet fully understood, they have been associated with changes in food availability (Solórzano et al. Reference Solórzano, Castillo, Valverde and Avila2000; Wheelwright Reference Wheelwright1983) and possibly habitat microclimatic conditions (García-Rojas Reference García-Rojas and Kappelle2006). Although elevation is ecologically relevant due to known altitudinal movements of the species, no statistical support for its effect was found in the present analysis, likely due to the limited altitudinal gradient represented within the sampling area, which may have constrained the detection of elevation-related patterns. This is expected, as P. mocinno is a species that moves to different altitudes throughout the year, depending on the month (Bustamante-Castillo et al. Reference Bustamante-Castillo, Bosarreyes and Barrios-Izas2024; Powell and Bjork Reference Powell and Bjork1995). Although seasonal variation in the effect of elevation is expected based on known altitudinal movements of the species, no statistical support for this pattern was found in the present analysis. This may be partly due to the relatively limited altitudinal range covered by the sampling sites or to other unmeasured environmental factors influencing detection patterns.
Monitoring sites located farther from roads and trails, such as small valleys, depressions, or ravines, tended to show higher detection counts. Although we did not directly measure acoustic interference or human disturbance, these spatial patterns may reflect more favorable conditions for vocal activity, potentially due to reduced noise and more stable access to natural resources. This interpretation is consistent with evidence that chronic noise can act as an ecological filter by masking avian vocal signals critical for territory defense and mate attraction (Francis et al. Reference Francis, Ortega and Cruz2011). Given that P. mocinno relies on vocalizations, particularly during the breeding season, and the relatively low frequency of many of its calls, the species may be especially susceptible to acoustic masking from overlapping noise frequencies (Bolaños-Sittler Reference Bolaños-Sittler, Sueur, Fuchs and Aubin2019).
In addition to making communication, anthropogenic noise may reduce overall bioacoustic activity or alter behavior by prompting individuals to remain silent or relocate to less disturbed areas (Dapper et al. Reference Dapper, Baugh and Ryan2011; McClure et al. Reference McClure, Ware, Carlisle, Kaltenecker and Barber2013; Tyack et al. Reference Tyack, Zimmer, Moretti, Southall, Claridge, Durban, Clark, DiMarzio, Jarvis, McCarthy, Morrissey, Ward and Boyd2011). Such responses are often heightened when noise is perceived as a potential threat, leading animals to limit detectability while increasing vigilance. Furthermore, birds may avoid road-adjacent habitats not only due to acoustic disturbance but also because of other stressors, including reduced territory quality, exhaust emissions, ground vibrations, and visual stimuli (Forman et al. Reference Forman, Sperling, Bissonette, Clevenger, Cutshall, Dale, Fahrig, France, Goldman, Heanue, Jones, Swanson, Turrentine and Winter2003; Kociolek et al. Reference Kociolek, Clevenger, St Clair and Proppe2011). While additional road-related impacts, such as fragmentation or direct mortality, may influence distribution, studies suggest that noise alone can be a strong driver of habitat avoidance (McClure et al. Reference McClure, Ware, Carlisle, Kaltenecker and Barber2013; Rheindt Reference Rheindt2003). This is particularly relevant for territorial species like the P. mocinno during the reproductive season, underscoring the importance of integrating acoustic conditions into habitat suitability assessments.
Regulating and monitoring excessive noise and human activity in areas of high acoustic activity, which may indicate intense quetzal presence, may serve as an effective management strategy to reduce anthropogenic disturbance during the species’ most sensitive life stage, reproduction. This approach is particularly relevant for the management of conservation areas, where visitor access can be better regulated and measures implemented to mitigate excessive noise and improve visitor guidance. In addition to regulating visitor access, implementing measures during peak vocal activity hours (early morning) could further minimize disturbance, especially in breeding territories. Targeted zoning strategies that restrict access to topographically complex habitats, such as ravines and valleys, may also help safeguard critical reproductive sites. While these management actions are promising, their effectiveness should be empirically tested to ensure long-term benefits for the species during this critical period.
Our results indicate that while topography establishes the structural context of suitable habitats, seasonal cycles largely govern the intensity of vocal behavior, emphasizing the need to incorporate both spatial and temporal factors into conservation planning. Monthly variation in activity is consistent with known altitudinal movements of the species linked to seasonal fruit availability, although elevation was not a significant predictor in the statistical models. Seasonal shifts in vocal activity likely correspond to the availability of fruiting trees (e.g., Lauraceae), which are known to influence altitudinal movements in P. mocinno. These findings underscore the importance of protecting topographically sheltered features such as ravines and low-lying areas, which may provide critical resources for the species. Additionally, our study demonstrates that bioacoustic monitoring is a powerful approach for assessing behavior and habitat use in dense, difficult-to-access montane forests.
An important limitation of the present approach is that automated detections do not differentiate among distinct vocalization types of P. mocinno. The species exhibits multiple structurally distinct call types associated with different behavioral contexts, including territorial defense, courtship, alarm, and contact calls (Bolaños-Sittler Reference Bolaños-Sittler, Sueur, Fuchs and Aubin2019). Collapsing these vocalizations into a single detection category may obscure fine-scale ecological patterns related to behavior and habitat use.
While frameworks such as BirdNET are highly effective for large-scale, multi-species monitoring, their generalist design inherently prioritizes broad taxonomic coverage over behavioral specificity. Importantly, however, such approaches are flexible and can be adapted to specific research questions through the development of custom classifiers trained on targeted vocalization types. Given the large number of species handled by these systems, incorporating detailed behavioral distinctions at the global scale is not feasible but can be effectively addressed at the level of individual studies.
Future work could build upon this flexibility by developing call-type-specific classifiers for P. mocinno, enabling discrimination between behavioral contexts such as territorial, reproductive, and alarm vocalizations. This would allow more precise identification of breeding areas, territorial zones, feeding sites, and disturbance-related responses, representing a promising direction for improving the ecological interpretability and conservation relevance of acoustic monitoring for this species.
Conclusions
BirdNET demonstrated high precision in detecting P. mocinno vocalizations, with true detections consistently associated with higher confidence scores and false positives largely confined to lower thresholds. This high precision indicates that the detection system is inherently conservative, producing very few false positives. Such performance is particularly advantageous for the ecological monitoring of rare species, where minimizing false detections is often more important than maximizing detection completeness. However, this conservative behavior is reflected in lower recall, suggesting that some vocalization events remain undetected. These limitations are likely driven by variability in vocalizations, environmental noise, and the limited representation of tropical soundscapes in the training dataset. Overall, these results indicate that BirdNET is especially suitable for applications where data reliability is prioritized if detection thresholds are carefully selected according to study objectives.
Our study demonstrates that temporal factors strongly influence the acoustic activity and habitat use of P. mocinno, while topographic effects appear weaker. Although elevation and topographic complexity, including ravines, valleys, and less steep terrain, are ecologically relevant features of the species’ habitat, they did not emerge as significant predictors in the present analysis but may still play an important role in shaping habitat use, potentially reflecting favorable microclimates, increased cover, and resource availability during the reproductive season.
Seasonal and diel patterns in vocal activity, with peaks at dawn and in early months, highlight the importance of timing for monitoring, nest identification, and management interventions. Areas of high acoustic activity can guide targeted conservation actions, such as regulating visitor access, mitigating noise, restoring food plants, protecting natural refuges, and implementing artificial nests, particularly in topographically sheltered habitats that may be important for reproduction. Moreover, our validation of automated acoustic monitoring demonstrates its utility for studying elusive species in rugged, difficult-to-access montane forests, offering a cost-effective and scalable tool for range-wide monitoring. However, detection performance is influenced by environmental and acoustic conditions, and caution is required when transferring models across different ecosystems. Together, these findings provide an integrated framework to inform habitat restoration and evidence-based management strategies, contributing to the long-term conservation of P. mocinno.
Acknowledgements
We thank Licda. Myra Oliva, director of the Biotopo Universitario Mario Dary Rivera para la Conservación del Quetzal (BUCQ), for her invaluable support and collaboration. We are grateful to the BUCQ staff and resource guards—Rubén Antonio Castellanos Chocó, Juan José Isem Bol, Oscar Rene Co Xicol, Martin Bin Tipol, Ángel Velásquez Coy, Geovany Humberto Pacay Quib, Bacilio Muz Coy, Josué Eduardo Maas Cahuec, and Pablo Tun Caal—for their dedicated assistance in field data collection and autonomous recorder deployment. Finally, we thank Oliver Gereda and Carlos André Chúa for assistance with field logistics and mapping.
Financial support
The completion of this work was made possible through financial support from the National Fund for Science and Technology (FONACYT), granted by the National Secretariat of Science and Technology (SENACYT) and the National Council for Science and Technology (CONCYT), through the project FINDECYT/GeneraCYT 02-2022.
Competing interests
The authors declare that they have no financial, professional, or personal conflicts of interest that could have influenced the work reported in this study. All authors have read and approved the final version of the manuscript and agree with its submission to the Journal of Tropical Ecology.
Ethical statement
None.




 Open access

