Introduction
Although it is well established that patients with schizophrenia have demonstrable structural and functional brain abnormalities in prefrontal and temporal regions, much less is known about brain changes over time in association with the disorder (Shenton et al. Reference Shenton, Dickey, Frumin and McCarley2001; Fusar-Poli et al. Reference Fusar-Poli, Perez, Broome, Borgwardt, Placentino, Caverzasi, Cortesi, Veggiotti, Politi, Barale and McGuire2007). This issue has central importance with regard to understanding the nature of the disease, in terms of whether abnormalities are neurodevelopmental in origin, whether they are progressive, or a combination of the two. Indeed, the lack of unequivocal evidence for clinical or biological progression in the established condition could infer that the period of greatest change occurs prior to development of the disorder and could relate to inheritance of the schizophrenic trait, or alternatively may reflect subtle changes in association with evolving symptomatology. Hence, there is interest in studying the relationship between functional brain abnormalities and the course and early symptoms of the disorder.
There is a paucity of data tracking the progression of functional abnormalities in high-risk populations. Longitudinal functional magnetic resonance imaging (fMRI) studies have, however, previously been conducted in patients with established schizophrenia and other clinical populations as well as in healthy control subjects, indicating the feasibility of the technique to examine changes in brain function (Ward et al. Reference Ward, Brown, Thompson and Frackowiak2003; Tombari et al. Reference Tombari, Loubinoux, Pariente, Gerdelat, Albucher, Tardy, Cassol and Chollet2004; Yoo et al. Reference Yoo, O'Leary, Dickey, Wei, Guttmann, Park and Panych2005; Szaflarski et al. Reference Szaflarski, Schmithorst, Altaye, Byars, Ret, Plante and Holland2006; Marchand et al. Reference Marchand, Lee, Thatcher, Thatcher, Jensen and Starr2007). There is also a growing body of literature directly addressing issues relating to the reliability of fMRI responses, which has obvious importance for longitudinal studies. In general such studies have suggested that, in healthy controls at least, although there may be variability in the volume of response, there are consistent patterns of activation between scanning sessions at the group level (Casey et al. Reference Casey, Cohen, O'Craven, Davidson, Irwin, Nelson, Noll, Hu, Lowe, Rosen, Truwitt and Turski1998; Machielsen et al. Reference Machielsen, Rombouts, Barkhof, Scheltens and Witter2000; Chee et al. Reference Chee, Lee, Soon, Westphal and Venkatraman2003). Functional imaging techniques are therefore of interest in the investigation of longitudinal changes related to schizophrenia in those at high risk of developing the disorder. It should be noted, however, that there are as yet relatively few reproducibility studies in patient populations (Manoach et al. Reference Manoach, Halpern, Kramer, Chang, Goff, Rauch, Kennedy and Gollub2001; Chen & Small, Reference Chen and Small2007) and it is therefore important that reliability of fMRI in such populations is addresed.
The current study examines subjects from the Edinburgh High Risk Study (EHRS). This was a prospective 10-year longitudinal study designed to address issues relating to genetic vulnerability to psychosis (Johnstone et al. Reference Johnstone, Lawrie and Cosway2002, Reference Johnstone, Ebmeier, Miller, Owens and Lawrie2005). Functional imaging was introduced in the last 5 years of the study and involved a sentence completion paradigm known to activate regions reported to be abnormal in established schizophrenia (frontal and temporal lobes). The aim of the current study was to address three issues: (i) the reliability of the Hayling task in high-risk and control subjects; (ii) whether longitudinal changes occur in high-risk subjects who differ from healthy control subjects reflecting inheritance of the schizophrenic ‘trait’; (iii) whether longitudinal changes occur in high-risk subjects relating to fluctuations in psychotic symptoms, reflecting ‘state’-related effects. Since the study involved high-risk participants who did not meet diagnostic criteria for a psychiatric disorder, the term ‘state’ here is used to describe partial phenotypic expression of some of the characteristic symptoms of schizophrenia, rather than full phenotypic expression of the disease.
Based on previous cross-sectional functional imaging studies relating to positive psychotic symptoms (Cleghorn et al. Reference Cleghorn, Franco, Szechtman, Kaplan, Szechtman, Brown, Nahmias and Garnett1992; Suzuki et al. Reference Suzuki, Yuasa, Minabe, Murata and Kurachi1993; David et al. Reference David, Woodruff, Howard, Mellers, Brammer, Bullmore, Wright, Andrew and Williams1996; Dierks et al. Reference Dierks, Linden, Jandl, Formisano, Goebel, Lanfermann and Singer1999; Lennox et al. Reference Lennox, Park, Medley, Morris and Jones2000; Shergill et al. Reference Shergill, Brammer, Williams, Murray and McGuire2000; Stephane et al. Reference Stephane, Folstein, Matthew and Hill2000; van de Ven et al. Reference van de Ven, Formisano, Roder, Prvulovic, Bittner, Dietz, Hubl, Dierks, Federspiel, Esposito, Di Salle, Jansma, Goebel and Linden2005), and longitudinal structural imaging studies regarding the importance of temporal lobe changes in early schizophrenia (Kasai et al. Reference Kasai, Shenton, Salisbury, Hirayasu, Lee, Ciszewski, Yurgelun-Todd, Kikinis, Jolesz and McCarley2003a, Reference Kasai, Shenton, Salisbury, Hirayasu, Onitsuka, Spencer, Yurgelun-Todd, Kikinis, Jolesz and McCarleyb; Whitford et al. Reference Whitford, Grieve, Farrow, Gomes, Brennan, Harris, Gordon and Williams2006) and high-risk subjects (Thompson et al. Reference Thompson, Vidal, Giedd, Gochman, Blumenthal, Nicolson, Toga and Rapoport2001; Lawrie et al. Reference Lawrie, Whalley, Abukmeil, Kestelman, Miller, Best, Owens and Johnstone2002; Pantelis et al. Reference Pantelis, Velakoulis, McGorry, Wood, Suckling, Phillips, Yung, Bullmore, Brewer, Soulsby, Desmond and McGuire2003; Job et al. Reference Job, Whalley, Johnstone and Lawrie2005), and in our own cross-sectional fMRI study in high-risk subjects (Whalley et al. Reference Whalley, Gountouna, Hall, McIntosh, Whyte, Simonotto, Job, Owens, Johnstone and Lawrie2007), we hypothesized changes in temporal lobe activation in high-risk subjects relating to changes in symptomatic state.
Method
Subject details
The EHRS examines young adults at enhanced genetic risk of schizophrenia over the period at which they are at greatest risk of becoming ill (Hafner et al. Reference Hafner, Maurer, Loffler and Reicher-Rossler1993) in comparison with matched healthy controls (Johnstone et al. Reference Johnstone, Lawrie and Cosway2002). The high-risk and control subjects were matched as closely as possible at recruitment for age, gender and social class at birth based on father's occupation (see Byrne et al. Reference Byrne, Hodges, Grant, Owens and Johnstone1999). High-risk participants were selected on the basis of being aged between 16 and 25 years when first recruited (1994–1999), and having one first- or second-degree relative with schizophrenia and a minimum of one further genetic relative with the illness (Hodges et al. Reference Hodges, Byrne, Grant and Johnstone1999; Johnstone et al. Reference Johnstone, Lawrie and Cosway2002, Reference Johnstone, Ebmeier, Miller, Owens and Lawrie2005). This report concerns longitudinal fMRI data obtained during the second phase of the study (1999–2004) when functional imaging was introduced into the protocol. All subjects were supplied with detailed written information regarding the study and provided written informed consent. The study was approved by the Psychiatry and Clinical Psychology subcommittee of the Lothian research ethics committee.
During the study, a total of 96 high-risk subjects and 26 matched healthy controls underwent an fMRI scan at baseline. Sixty-three high-risk subjects and 19 control participants provided a repeat scan after approximately 18 months. Regarding the high-risk group, 33 subjects (comprising 19 asymptomatic and 14 symptomatic subjects at baseline) did not have a repeat scan: 10 refused or had withdrawn, seven were excluded because of abnormality or movement artefact, two had become ill between assessments, for six subjects it was not possible to schedule a suitable time for assessment, and finally due to rolling recruitment a suitable time interval between assessments had not elapsed in eight subjects. For the controls, out of the seven subjects who did not have a repeat scan, two refused or had withdrawn, and three subjects were not re-scanned due to rolling recruitment. The remainder had either previously accompanied a participant who had subsequently refused or withdrawn from the study, or it was not possible to schedule a suitable time for assessment.
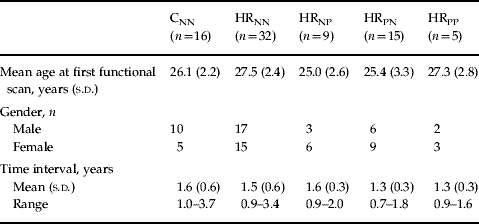
Participant demographics are presented in Table 1. At the time of scanning all subjects underwent a structured psychiatric interview, the Present State Examination (PSE; Wing et al. Reference Wing, Cooper and Sartorius1974). These interviews, conducted by experienced psychiatrists (E.C.J. and D.G.C.O.), were filmed, and videotapes have been retained. The PSE was chosen as the primary method to determine the presence or absence of psychotic symptoms in this study as it is a detailed instrument providing a standardized assessment of a wide range of symptomatology, which we considered useful in the context of establishing the extent of psychopathology in the high-risk and control subjects (Johnstone et al. Reference Johnstone, Abukmeil, Byrne, Clafferty, Grant, Hodges, Lawrie and Owens2000). Subjects were then split according to the presence or absence of psychotic symptoms. Our notation of symptomatic or asymptomatic participants refers specifically to the presence of isolated and/or transient psychotic symptoms reported at interview. Thirty-two high-risk subjects were found to be asymptomatic at both time points (HRNN), nine subjects went from asymptomatic to symptomatic (HRNP), fifteen went from symptomatic to asymptomatic (HRPN), five subjects were symptomatic at both time points (HRPP), and finally two subjects went from being symptomatic to developing schizophrenia. The diagnosis was made when psychotic symptoms were sufficiently severe or sustained to satisfy categorization in terms of PSE/Catego (Wing et al. Reference Wing, Cooper and Sartorius1974) and ICD-10 (WHO, 1993) criteria as previously described (Johnstone et al. Reference Johnstone, Ebmeier, Miller, Owens and Lawrie2005). Due to this small number it was not possible to examine progressive changes preceding illness. Regarding the control subjects, sixteen subjects were asymptomatic at both time points (CNN), and three subjects went from asymptomatic to symptomatic. Analysis of demographic variables and behavioural measures was conducted in the Statistical Package for the Social Sciences (SPSS version 14; SPSS Inc., Chicago, IL, USA). There were no significant differences in age, gender, handedness or symptomatic status between those who were rescanned and those that were not. Due to small numbers of subjects in the groups containing high-risk subjects who went from being symptomatic to ill (n=2), and control subjects who went from being asymptomatic to symptomatic (n=3), subsequent analyses were conducted excluding these groups.
Demographics

CNN, Control subjects with no psychotic symptoms at times 1 and 2; HRNN, high-risk subjects with no psychotic symptoms at times 1 and 2; HRNP, high-risk subjects with no psychotic symptoms at time 1 but with psychotic symptoms at time 2; HRPN, high-risk subjects with psychotic symptoms at time 1 but with none at time 2; HRPP, high-risk subjects with psychotic symptoms at both time 1 and time 2.
For the purposes of the trait contrast, group comparisons were conducted between the control and high-risk groups. For the purposes of the state contrast, group comparisons were conducted between the HRNN and the HRNP groups and between the HRNN and the HRPN groups.
Scanning procedure
Imaging was carried out at the Brain Imaging Research Centre (BIRC) for Scotland on a GE 1.5 T Signa scanner (GE Medical, Milwaukee, WI, USA). The imaging protocol consisted of a localizer scan, followed by a T2-weighted fast spin-echo sequence, and a structural T1-weighted sequence followed by the functional imaging paradigms. Axial gradient-echo planar images (EPI) [repetition time 4000 ms, echo time 40 ms; matrix=64×128; field of view (FOV) 220×440 mm] were acquired continually. Thirty-eight contiguous 5 mm slices aligned to the anterior and posterior commissure were acquired within each repetition time period. Each acquisition was run for 204 volumes, of which the first four volumes were discarded.
Experimental paradigm
Participants performed the verbal initiation section of the Hayling sentence completion test in the scanner as described previously (Burgess & Shallice, Reference Burgess and Shallice1997; Whalley et al. Reference Whalley, Simonotto, Flett, Marshall, Ebmeier, Owens, Goddard, Johnstone and Lawrie2004). Subjects were shown sentences with the last word missing and were asked to silently think of an appropriate word to complete the sentence and press a button when they had done so, generating within-scanner reaction time measures. Sentences were presented in blocks of fixed difficulty, determined by the range of suitable words suggested by the sentence context, of which there were four levels. Each block lasted 40 s and included eight sentences. Sentences were presented for a period of 3 s followed by a fixation cross for 2 s and subjects could respond at any time until the next sentence appeared. The baseline condition consisted of viewing a screen of white circles on a black background for 40 s. The order of the blocks was pseudo-random, and each block was repeated four times. Immediately after scanning, subjects were given the same sequence of sentences on paper and requested to complete each sentence with the word they first thought of in the scanner. ‘Word appropriateness’ scores were determined from the word frequency list of sentence completion norms (Bloom & Fischler, Reference Bloom and Fischler1980). For more detail, see Whalley et al. (Reference Whalley, Simonotto, Flett, Marshall, Ebmeier, Owens, Goddard, Johnstone and Lawrie2004).
Image processing and analysis
Scan analysis was performed using the standard Statistical Parametric Mapping (SPM) approach in SPM2 (The Wellcome Department of Cognitive Neurology and collaborators, Institute of Neurology, London; http://www.fil.ion.ucl.ac.uk/spm/) running in matlab (MathWorks, Natick, MA, USA). Briefly, for both scanning sessions EPI volumes were realigned to the mean volume in the series, normalized to a study-specific EPI template (comprising 121 participants of the EHRS) and spatially smoothed with a 6×6×6 mm3 full-width half-maximum (FWHM) Gaussian filter.
First-level analysis
Statistical analysis was performed using the general linear model approach as implemented in SPM. At the individual subject level the data were modelled with five conditions (the four difficulty levels and baseline), each modelled by a boxcar function convolved with a synthetic haemodynamic response function. Estimates of head movement from the realignment stage of pre-processing were included as additional regressors in the analysis. Before fitting the model the first-order autoregressive (AR-1) technique was used to address issues of temporal autocorrelations in the data and the data were filtered in the time domain using a high-pass filter (200 s cut-off). Contrasts were constructed to examine all four sentence completion conditions versus baseline, and a parametric contrast which examines increasing activation with increasing difficulty (Whalley et al. Reference Whalley, Simonotto, Flett, Marshall, Ebmeier, Owens, Goddard, Johnstone and Lawrie2004).
Second-level analysis
Contrast images for each subject representing a subject-specific summary of brain responses to the different conditions were then entered into second-level random-effects analyses. Initially, a single-sample t test was used to generate within-group maps for each time point for both sentence completion versus baseline and the parametric contrast. Within-subject ‘change’ maps were then generated for sentence completion versus baseline and the parametric contrast by subtracting for each subject the respective contrast images from visit 1 from visit 2, divided by the time interval between the scanning sessions. Although there were no significant group differences in the time interval between the scans, the time interval was included to control for within-subject variability related to the between-scan interval. The individual subject change maps were then entered into further random-effects analyses to examine changes in activation within (one-sample t test) and between (analysis of variance; ANOVA) each of the groups. To test the concurrent validity of this approach, results from the active versus baseline contrast were compared with a more complex repeated-measures analysis of covariance (ANCOVA) model. Here, contrast images for each individual from time 1 and time 2 were entered as separate regressors into the model (per group) and the time interval between the scans was entered as a covariate of no interest. Contrasts were then constructed to examine activation differences between the groups. The two approaches yielded a similar pattern of results; therefore, the simpler ‘one contrast image per subject’ subtraction model was used.
Statistical maps were thresholded at a level of p=0.001 uncorrected, and regions were considered significant at p<0.05 cluster level-corrected for multiple comparisons. All p values quoted in the text are at the corrected cluster level. A small volume correction for the temporal lobes was applied to contrasts examining state effects in line with our a priori hypothesis of change in activation in this region with symptom development.
Reliability measures
Reliability was assessed using approaches similar to those described previously (Specht et al. Reference Specht, Willmes, Shah and Jancke2003; Aron et al. Reference Aron, Gluck and Poldrack2006). Measures were computed for the CNN and HRNN groups only in order that reliability measures were not confounded by symptom effects seen in the other groups. Intra-class correlation coefficient (ICC) values were calculated on a voxel-by-voxel basis using a one-way ANOVA model (Specht et al. Reference Specht, Willmes, Shah and Jancke2003) on contrast images representing sentence completion versus baseline. High ICC values suggest low within-subject variability. The resulting three-dimensional ICC maps of ICC values >0.5 were then masked with a binary image representing the main network of regions involved in the task at visit 1 or visit 2 (Aron et al. Reference Aron, Gluck and Poldrack2006). The mask was generated by performing a one-sample t test on subjects at visit 1 and at visit 2. The resulting group activation maps for visit 1 and visit 2 were then thresholded at p=0.01 [p corrected family-wise error (FWE), cluster extent threshold in voxels (KE)=500], and a binary mask created. ICC maps therefore only present voxels that were activated at visit 1 or at visit 2.
The mean response for three main regions of interest (left superior/medial frontal gyrus, left middle temporal gyrus and left inferior frontal gyrus) for each subject and each visit was also extracted in order to generate signal plots of visit 1 versus visit 2. The coordinates for the three main regions of interest were identified from the cluster results from an all-subjects second-level random-effects analysis; the left superior/middle frontal gyrus (−4, 4, 56), the left middle temporal gyrus (−54, −38, −6) and the left inferior frontal gyrus (−54, 14, 14) and values were extracted for a 10 mm radius sphere centred on these coordinates.
Results
Subject groups
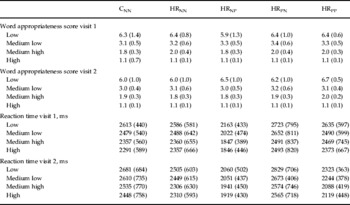
There were no statistically significant differences between the groups regarding the time interval between the scans, or gender. There was, however, a significant difference in age at the time of the first functional scan between the groups (p=0.049). The results presented below survived controlling for age. Behavioural measures for each time point are presented in Table 2. These indicated the expected pattern of quicker reaction time and lower word appropriateness scores with greater contextual constraint at both assessments and indicate that the subjects were performing the task appropriately in the scanner. There were no significant group×time interactions for any of the behavioural measures (general linear model repeated-measures ANCOVA).
Behavioural measuresFootnote a

CNN, Control subjects with no psychotic symptoms at times 1 and 2; HRNN, high-risk subjects with no psychotic symptoms at times 1 and 2; HRNP, high-risk subjects with no psychotic symptoms at time 1 but with psychotic symptoms at time 2; HRPN, high-risk subjects with psychotic symptoms at time 1 but with none at time 2; HRPP, high-risk subjects with psychotic symptoms at both time 1 and time 2.
Values are given as mean (standard deviation).
a Constraint levels high to low represent increasing task difficulty. Low word appropriateness scores represent more appropriate words, i.e. better task performance. Reaction times were recorded in the scanner.
Reliability measures
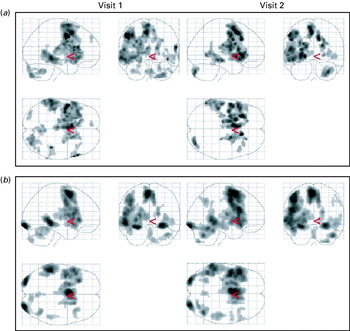
Fig. 1 presents within-group maps at each time point for sentence completion versus baseline, providing a means of qualitative assessment of reliability. Fig. 1 shows that there were consistent activation patterns across time in both groups in regions previously associated with the task, namely the left precentral gyrus, inferior frontal gyrus, medial/superior frontal gyrus, middle temporal gyrus, and the right posterior lobe of the cerebellum.
Sentence completion versus baseline maps (a) for control subjects (n=16) at visits 1 and 2, thresholded at T=3.5, cluster extent threshold in voxels (KE)=100, and (b) maps for high-risk subjects (n=61) for visits 1 and 2, thresholded at T=5.5, KE=100. Maps were thresholded at different levels for visualization purposes only in order to accommodate differences in group numbers. Standard statistical thresholds were used in all group comparisons.

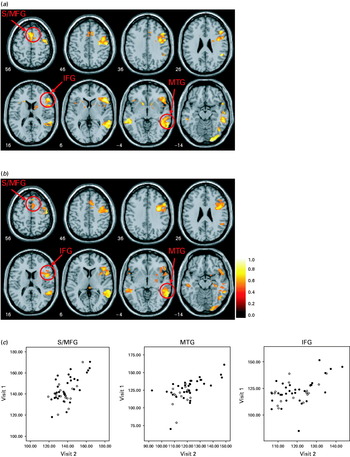
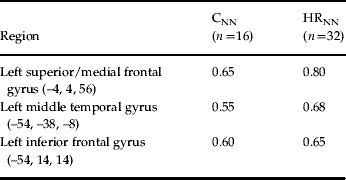
ICC maps for the main regions activated for the sentence completion versus baseline contrast are presented in Fig. 2(a, b) for both groups for voxels activated at either visit 1 or visit 2. Plots of the mean response in these regions for visits 1 and 2 are presented in Fig. 2c and indicate that responses were highly correlated and were similar across the groups. ICC values for the mean responses for the three main regions of interest are presented in Table 3. Values ranged from 0.55 to 0.65 for the controls and from 0.65 to 0.80 for the HRNN group, indicating good agreement.
Intra-class correlation coefficient values (<0.5) are shown for the main regions of activation in the sentence completion versus baseline contrast for (a) control subjects with no psychotic symptoms at times 1 and 2 (CNN group) and (b) high-risk subjects with no psychotic symptoms at times 1 and 2 (HRNN group); see Method section for further details. (c) Signal plots are presented for the three main regions of interest at visit 1 and visit 2 for the CNN (○) and HRNN (•) groups. The three main regions of interest are the superior/medial frontal gyrus (S/MFG), the middle temporal gyrus (MTG) and the inferior frontal gyrus (IFG).

ICC values for regions of interestFootnote a

ICC, Intra-class correlation coefficient; CNN, control subjects with no psychotic symptoms at times 1 and 2; HRNN, high-risk subjects with no psychotic symptoms at times 1 and 2.
a ICC values for sphere, radius 10 mm, centred on respective coordinates.
Sentence completion versus baseline contrast
Trait effects
Formal statistical comparisons revealed no significant differences between the groups at the chosen levels of significance.
State effects
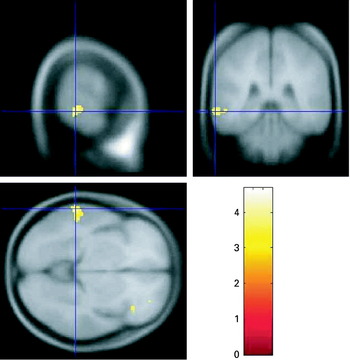
Comparison of the HRNN and HRNP groups revealed significant increases in activation over time in those at high risk who moved from asymptomatic to symptomatic in the left middle temporal gyrus (BA21) [p corrected=0.026, KE=112, Z=3.94 (–64, –38, –6)], using a small volume correction for temporal lobes (Fig. 3). There were no significant differences between the HRNN and HRPN groups.
State contrast: significant difference between high-risk groups in the left posterior middle temporal gyrus (p=0.026), representing greater increases over time in the high-risk subjects with no psychotic symptoms at time 1 but with psychotic symptoms at time 2 (HRNP group) versus the high-risk subjects with no psychotic symptoms at times 1 and 2 (HRNN group).

Parametric contrast
Trait effects
Formal comparison of the changes over time between the groups revealed no significant differences between the groups at the chosen levels of significance.
State effects
Comparison of the HRNN and HRNP, and HRNN and HRPN groups revealed no significant increases or decreases over time between the groups.
Discussion
The results of this large longitudinal fMRI study conducted over a relatively long time interval (18 months) indicate no change over time between high-risk subjects and controls (‘trait’ effects). We did, however, see changes over time in those developing psychotic symptoms. Our results, therefore, indicate that the greatest functional changes over time in our high-risk subjects relate to changes in (sub-diagnostic) symptoms, i.e. ‘state’ effects. Behavioural measures indicated minimal practice effects and all those studied were naive to antipsychotic medication – hence the findings are unlikely to be attributable to such factors. Furthermore, reliability measures indicated consistent patterns of activation in the stable asymptomatic groups.
The small number of functional longitudinal studies on the established illness have in general been conducted with the purpose of examining effects of medication on changes in symptoms and brain function (Davis et al. Reference Davis, Jeste and Eyler2005). In general, these studies suggest treatment effects or ‘normalization’ of brain function in frontal, temporal and cerebellar regions post-medication (Honey et al. Reference Honey, Bullmore, Soni, Varatheesan, Williams and Sharma1999; Davis et al. Reference Davis, Jeste and Eyler2005; Stip et al. Reference Stip, Fahim, Mancini-Marie, Bentaleb, Mensour, Mendrek and Beauregard2005; Yurgelun-Todd et al. Reference Yurgelun-Todd, Coyle, Gruber, Renshaw, Silveri, Amico, Cohen and Goff2005). By design, however, these studies have been conducted over relatively short time-frames and do not address longer-term changes in function and symptoms over the course of the illness. These studies have also been accompanied by methodological limitations such as small sample sizes, lack of healthy control data, and a lack of reliability measures (Davis et al. Reference Davis, Jeste and Eyler2005). As described earlier, the majority of reproducibility studies have been conducted on healthy control populations, and very few studies have examined reproducibility in patient populations, particularly using complex tasks (Manoach et al. Reference Manoach, Halpern, Kramer, Chang, Goff, Rauch, Kennedy and Gollub2001; Chen & Small, Reference Chen and Small2007). Our reproducibility findings in both controls and high-risk subjects performing the current cognitive task indicating good agreement aid interpretation of the current findings and are encouraging for future longitudinal fMRI studies.
In line with our original hypothesis regarding progressive changes in the temporal lobe, fluctuating symptom effects were associated with changes in activation in the lateral temporal cortex. High-risk subjects who moved from asymptomatic to symptomatic demonstrated increasing activation in the left middle temporal gyrus. Although to our knowledge there are no other longitudinal fMRI studies in high-risk individuals, our findings are in general consistent with the available literature regarding progressive structural changes in grey matter in the lateral temporal cortex during early stages of the illness (Kasai et al. Reference Kasai, Shenton, Salisbury, Hirayasu, Lee, Ciszewski, Yurgelun-Todd, Kikinis, Jolesz and McCarley2003a, b; Whitford et al. Reference Whitford, Grieve, Farrow, Gomes, Brennan, Harris, Gordon and Williams2006) and in high-risk individuals (Thompson et al. Reference Thompson, Vidal, Giedd, Gochman, Blumenthal, Nicolson, Toga and Rapoport2001; Lawrie et al. Reference Lawrie, Whalley, Abukmeil, Kestelman, Miller, Best, Owens and Johnstone2002; Pantelis et al. Reference Pantelis, Velakoulis, McGorry, Wood, Suckling, Phillips, Yung, Bullmore, Brewer, Soulsby, Desmond and McGuire2003; Job et al. Reference Job, Whalley, Johnstone and Lawrie2005). Indeed, the lateral temporal cortex has been widely implicated regarding the manifestation of psychotic symptoms in the established illness, in particular auditory hallucinations (Cleghorn et al. Reference Cleghorn, Franco, Szechtman, Kaplan, Szechtman, Brown, Nahmias and Garnett1992; Suzuki et al. Reference Suzuki, Yuasa, Minabe, Murata and Kurachi1993; David et al. Reference David, Woodruff, Howard, Mellers, Brammer, Bullmore, Wright, Andrew and Williams1996; Dierks et al. Reference Dierks, Linden, Jandl, Formisano, Goebel, Lanfermann and Singer1999; Lennox et al. Reference Lennox, Park, Medley, Morris and Jones2000; Shergill et al. Reference Shergill, Brammer, Williams, Murray and McGuire2000; Stephane et al. Reference Stephane, Folstein, Matthew and Hill2000; van de Ven et al. Reference van de Ven, Formisano, Roder, Prvulovic, Bittner, Dietz, Hubl, Dierks, Federspiel, Esposito, Di Salle, Jansma, Goebel and Linden2005). Further, although slightly more anterior to the region reported here, we have also prevously found associations between activation in the left middle temporal gyrus and the severity of hallucinations in the full baseline sample of the same high-risk cohort (Whalley et al. Reference Whalley, Gountouna, Hall, McIntosh, Whyte, Simonotto, Job, Owens, Johnstone and Lawrie2007). Due to the relatively small numbers of high-risk subjects in the asymptomatic to symptomatic group, however, we did not consider it appropriate in the current study to further split the group according to the types of symptoms experienced. It is also worth noting that the current results were seen for the contrast of sentence completion (all levels of difficulty) versus a visual baseline, rather than the more subtle and more heavily controlled parametric contrast. We cannot exclude the possibility therefore that these findings may relate to basic cognitive processes involved in the task rather than higher-level processes relating specifically to semantic memory components of the task.
One other limitation of the current study is that the group of subjects with fluctuating symptoms is relatively small. The difficulty in collecting such data, however, should not be underestimated. We also acknowledge that the finding of increasing activation when subjects move to being symptomatic would be strengthened if the reverse were seen in those moving to being asymptomatic. It is difficult to speculate why this was not the case since little is known regarding the course and fluctuation of psychotic symptoms, and indeed it may simply be the case that in clinical terms the HRNP group are not simply the ‘inverse’ of the HRPN group. Another methodological issue relates to the chosen group comparisons. Although a number of other comparisons were possible we considered that a restricted range of comparisons of specific groups directed at addressing our primary hypotheses was the most favourable approach in order to limit the number of comparisons made. It is also worth noting that it is not possible to say from these data whether these functional brain changes represent the cause or consequence of the symptomatic changes.
In conclusion, findings from this study indicate that fMRI activation patterns were consistent in the clinically stable groups of controls and genetic high-risk subjects. Further, they demonstrate the presence of symptom-related functional brain changes in subjects at high genetic risk of schizophrenia, indicating changes in functional activation occur in association with the development of psychotic symptoms. These findings are consistent with other literature indicating that changes in symptomatology and neurobiology are an important aspect in our improved understanding of the neural changes underpinning schizophrenia.
Acknowledgements
The study was funded by a Medical Research Council (MRC) programme grant. S.M.L. and H.C.W. are supported by a charitable donation from the Dr Mortimer and Theresa Sackler Foundation. Scanning was carried out at the BIRC for Scotland. Both BIRC and the Centre for Functional Imaging Studies (CFIS) are funded by the Scottish Higher Education Funding Council (SHEFC).
Declaration of Interest
None.