Introduction
Older adults who feel hopeless about their future experience a wide range of negative outcomes – depression, mental distress, poor physical health, painful thoughts of suicide or even suicide attempts, and death (Everson et al., Reference Everson, Kaplan, Goldberg, Salonen and Salonen1997; Haatainen et al., Reference Haatainen2003; Mcmillan et al., Reference Mcmillan, Gilbody, Beresford and Neilly2007). Likewise, older adults who feel lonely experience many of the same painful outcomes, including suicidal thoughts and actions (Marty et al., Reference Marty, Segal, Coolidge and Klebe2012). Although some studies indicate that hopelessness and loneliness accompany each other, these characteristics tend to be studied separately, and few studies have tried to understand how they are related, particularly over time. Thus, we aimed to examine relationships between hopelessness and loneliness over time, using three waves of data from the US Health and Retirement Study (HRS) (2006, 2010, 2014).
A hopeless person has general expectations that the future will be dominated by negative, bleak outcomes (Beck et al., Reference Beck, Weissman, Lester and Trexler1974). Hopeless individuals often continue to feel hopeless over long periods of time (Haatainen et al., Reference Haatainen2003) and experience a wide range of deleterious outcomes. Compared to those who are less hopeless, those with greater hopelessness are more depressed (Haatainen et al., Reference Haatainen2003), have more thoughts of suicide (Marty et al., Reference Marty, Segal, Coolidge and Klebe2012), harm themselves (Dennis et al., Reference Dennis, Wakefield, Molloy, Andrews and Friedman2005), actually die by suicide more often (Mcmillan et al., Reference Mcmillan, Gilbody, Beresford and Neilly2007), have worse physical health (Everson et al., Reference Everson, Kaplan, Goldberg, Salonen and Salonen1997), and die from a variety of causes (Meller et al., Reference Meller, Fichter and Schroppel2004).
Similar to hopelessness, loneliness involves subjective perceptions. Loneliness is a subjective marker for deficits in one's social relationships and interactions. These social deficits can be in terms of quantity (i.e. limited social interactions or absence of social interactions), and especially in terms of quality (i.e. lack of intimacy, reliable alliance, attachment; De Jong Gierveld, Reference De Jong Gierveld1998). There is an abundance of findings attesting to the detrimental emotional and physical consequences of loneliness, including depressive symptoms (Vanderweele et al., Reference Vanderweele, Hawkley, Thisted and Cacioppo2011) and serious thoughts of suicide and self-harm (Marty et al., Reference Marty, Segal, Coolidge and Klebe2012). For older adults, those who are lonely are more likely to be depressed a year later, although depressed older adults were not more likely to become lonely (Cacioppo et al., Reference Cacioppo, Hawkley and Thisted2010). Lonely older adults also tend to have a more sedentary lifestyle (Netz et al., Reference Netz, Goldsmith, Shimony, Arnon and Zeev2013). Additionally, there is a growing body of research that has specifically linked loneliness to cardiovascular health (Thurston and Kubzansky, Reference Thurston and Kubzansky2009), inflammatory markers associated with cardiovascular morbidity (Jaremka et al., Reference Jaremka2013), and metabolic dysregulation (O'luanaigh et al., Reference O'luanaigh2012). Moreover, a recent meta-analysis has found that loneliness increases the risk for mortality (Holt-Lunstad et al., Reference Holt-Lunstad, Smith, Baker, Harris and Stephenson2015).
These parallel patterns of findings for hopelessness and loneliness suggest they may be related to each other; and indeed, initial research indicates that hopeless older adults are more likely to also be lonely. In a study of American older primary care patients (N = 105), hopelessness and loneliness were highly correlated (r = 0.66; Cukrowicz et al., Reference Cukrowicz, Cheavens, Van Orden, Ragain and Cook2011). Another study of 102 older Americans found higher mean scores on the Beck Hopelessness Scale for older adults who were lonely compared to older adults who were not lonely (Barg et al., Reference Barg, Huss-Ashmore, Wittink, Murray, Bogner and Gallo2006). In a cross-sectional study of community-dwelling older adults in Dublin, Ireland (N = 1,299), a measure of hopelessness was independently predicted by perceiving oneself as lonely, perceiving pain or intrusive thoughts about being lonely, and perceiving non-integrated social networks, after controlling for depressed mood and physical disability (Golden et al., Reference Golden2009). It is important to note that this measure of hopelessness included some elements of suicidal ideation (death ideas, death wishes). Other research has shown that similar constructs are related as well. Specifically, older adults who hold more hopeful views that they can achieve goals report a stronger sense of belonging, lower perceptions of being a burden on others (Cheavens et al., Reference Cheavens, Cukrowicz, Hansen and Mitchell2016), and fewer perceived social losses (Steverink et al., Reference Steverink, Westerhof, Bode and Dittmann-Kohli2001), compared to less hopeful older adults.
Feeling lonely may lead older adults to be hopeless about their future, as suggested by the authors of the cross-sectional Irish study, in which loneliness and pain about loneliness predicted hopelessness (Golden et al., Reference Golden2009). This conceptualization is consistent with Fromm-Reichmann's (Reference Fromm-Reichmann1959) classic theory of loneliness, asserting that true loneliness leads to a sense of paralyzing hopelessness. Individuals initially attempt to improve social relations and eliminate loneliness. When they are not successful, they perceive a hopeless, bleak future without meaningful relationships, and give up trying to improve social relationships or other aspects of their lives. As such, lonely older adults also may give up on other important goals for the future, such as health. Although not specifically focused on hopelessness, Cacioppo and colleagues’ (Reference Cacioppo, Hawkley and Thisted2010) study informs this hypothesis as well. Longitudinally, loneliness predicted depressive symptoms as measured by the Centers for Epidemiological Studies-Depression (CES-D), which includes an item regarding hopelessness. This relationship was unidirectional; CES-D scores did not predict later loneliness. Similarly, in qualitative interviews, older adults described loneliness as leading to depressive symptoms (Barg et al., Reference Barg, Huss-Ashmore, Wittink, Murray, Bogner and Gallo2006). Depressive symptoms and hopelessness are moderately to highly correlated (Beck et al., Reference Beck, Steer, Beck and Newman1993), so loneliness may impact both depressive symptoms and hopelessness.
Another conceptualization is that hopelessness about the future leads to loneliness. This was the case in the only longitudinal study to explore relationships between hopelessness and loneliness over time, conducted with 234 college students over a ten-week period. More hopeless students tended to become lonelier over time, but lonely students did not become more hopeless, based on a series of multiple regression analyses of changes in hopelessness and loneliness that controlled for depressive symptoms (Joiner and Rudd, Reference Joiner and Rudd1996). Within this conceptualization, the authors suggested that hopeless expectations for the future lead people to stop trying to form, maintain, or improve social relationships, and to stop pursuing other meaningful life goals that might impact social relationships (e.g. health, education, career, hobbies). By not pursuing social goals or other meaningful life goals, people may withdraw from social relationships or suffer other interpersonal deficits (e.g. passivity, lack of responsiveness, irritability) that harm relationships or prevent relationships from forming. This conceptualization also is consistent with a theory of hopeful thinking (i.e. beliefs about one's abilities to pursue goals); this construct of hopeful thinking is moderately negatively correlated with the Beck Hopelessness Scale (Snyder et al., Reference Snyder1991; Cheavens et al., Reference Cheavens, Gum, Snyder, Maltby, Lewis and Hill2000).
In summary, the two primary hypotheses in the literature are that loneliness may lead to hopelessness over time, and/or that hopelessness may lead to loneliness over time. These constructs are related to depressive symptoms, but also independently related to each other. A better understanding of the longitudinal relationships between hopelessness and loneliness would be valuable for several reasons. Because both constructs are closely related to depression, suicide risk, poorer physical health, and mortality, it would inform theories of these constructs. Moreover, findings would also suggest ways to intervene to ameliorate and prevent these two conditions. For example, guided by the interpersonal theory of suicide, Van Orden et al. (Reference Van Orden, Stone, Rowe, McIntosh, Podgorski and Conwell2013) are researching an intervention to reduce desire for suicide in older adults by providing supportive peer companionship to reduce perceptions of being a burden and not belonging. Perhaps this intervention could reduce hopelessness, if loneliness contributes to hopelessness over time. Alternatively, if hopelessness contributes to loneliness over time, then it may be important to focus directly on hopelessness as well as social connections, such as by intervening to improve expectations for the future and abilities to set and pursue goals, including socially related goals.
To address this gap in the literature, the purpose of the current study was to gather evidence about the potential impacts that hopelessness and loneliness have on each other over time, using longitudinal data from the US HRS and controlling for several covariates of both constructs, including depressive symptoms and medical conditions. Based on the only other longitudinal study we identified (Joiner and Rudd, Reference Joiner and Rudd1996), our primary hypothesis was that older adults who were more hopeless would be more likely to report worse loneliness over time, compared to those who were less hopeless. Although Joiner and Rudd did not find that loneliness predicted later hopelessness, we thought it is plausible that loneliness might predict later hopelessness, as others have suggested (Fromm-Reichmann, Reference Fromm-Reichmann1959; Golden et al., Reference Golden2009). Our design is similar to the study of cross-lagged effects between loneliness and depression with older adults (Cacioppo et al., Reference Cacioppo, Hawkley and Thisted2010), allowing us to examine reciprocal relationships over time.
Methods
The sample
The present study relies on the 2006, 2010, and 2014 waves of the US HRS. The HRS is supported by the National Institute on Aging (NIA U01AG009740) and the Social Security Administration. It is a biannual longitudinal panel of US nationally representative individuals aged 50 and older and their spouses of any age. It has an over-representation of Blacks, Hispanics, and residents of the State of Florida. The HRS contains questions about health, work, pension, and assets. As of 2006, a psychosocial questionnaire has been administered to a rotating 50% of the core panel participants. This results in half the sample completing the survey on a rotating basis every four years. The psychosocial questionnaire is a self-administered questionnaire, which includes questions about subjective well-being, lifestyle and stress, personality, beliefs, and quality of social ties. The present study is based on all respondents, 50 years of age and over, who completed the loneliness and the hopelessness questionnaires at least once over the three waves of administration (N = 7,831).
Compared with those who did not have at least one complete wave of data collection (N = 446), those who completed the loneliness and the hopelessness questionnaires at least once over the three waves of administration were significantly more educated (M (SD) = 11.7 (3.7) vs. M (SD) = 12.6 (3.2) respectively; t (483) = −5.4, p < 0.001) and less depressed (M (SD) = 1.2 (1.7) vs. M (SD) = 1.7 (2.0), respectively; t (196) = 3.5, p < 0.001).
Measures
Loneliness
A shortened version of one of the most widely used scales of loneliness, the Revised UCLA Loneliness Scale (Hughes et al., Reference Hughes, Waite, Hawkley and Cacioppo2004), was administered. In its short form, the measure includes three questions with a simplified set of three response categories. Respondents were asked to rate, on a three-point scale, how often they felt as if they: (a) lacked companionship, (b) were left out, or (c) were isolated from others. A mean score was calculated, with a higher overall score representing greater loneliness (range 1–3; α = 0.81–0.82 across waves).
Hopelessness
The measure consists of four items. Two items are from Everson et al. (Reference Everson, Kaplan, Goldberg, Salonen and Salonen1997): “I feel it is impossible for me to reach the goals that I would like to strive for;” and “The future seems hopeless to me and I can't believe that things are changing for the better.” Two additional items were from Beck et al. (Reference Beck, Weissman, Lester and Trexler1974): “I don't expect to get what I really want;” and “There is no use in trying to get something I want because I probably won't get it.” Hopelessness was measured on a Likert scale with a range between 1 and 6 (α = 0.84).
Covariates
Age in 2006, sex (1 = male, 2 = female), and years of education were gathered based on self-report. Other covariates were number of medical conditions (hypertension, diabetes, cancer, lung disease, heart condition, arthritis, and stroke; range 0–7) and depressive symptoms measured by seven items taken from the Centers for Epidemiological Scale-Depression (excluding the loneliness item; range 0–7; Wallace and Herzog, Reference Wallace and Herzog1995). Covariates were available for all three waves of data collection.
Statistical analysis
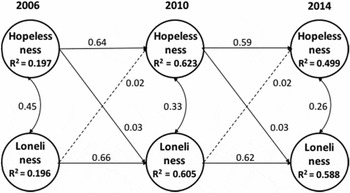
We first calculated descriptive statistics and correlations between variables. Next, we used Structural Equation Modeling with Mplus version 7.3 (Muthén and Muthén, Reference Muthén and Muthén1998–Reference Muthén and Muthén2012) to evaluate the cross-lagged autoregressive model (Finkel, Reference Finkel1995), outlined in Figure 1. The model allows for the simultaneous evaluation of the reciprocal associations of loneliness and hopelessness while controlling for measurement biases. Age in 2006, gender, years of education, number of medical conditions, and depressive symptoms were included as covariates because of their known associations with loneliness (Thurston and Kubzansky, Reference Thurston and Kubzansky2009; Vanderweele et al., Reference Vanderweele, Hawkley, Thisted and Cacioppo2011; O'luanaigh et al., Reference O'luanaigh2012) and with hopelessness (Everson et al., Reference Everson, Kaplan, Goldberg, Salonen and Salonen1997; Haatainen et al., Reference Haatainen2003). Loneliness, hopelessness, and depressive symptoms were modeled as latent constructs with their items serving as indicators. Age, gender, number of medical conditions, and years of education were modeled as observed variables.
A cross-lagged panel model of the reciprocal relations of loneliness and hopelessness. A structural equation model of cross-lagged hopelessness and loneliness effects with standardized parameters. The solid lines indicate paths statistically significant at p < 0.05. The dotted lines indicate non-significant paths. R2 represents the proportion of explained variance.

Because there were missing values in the data and the data deviated from normality, we used the Mplus WLSMV estimator that allows for maximum likelihood estimation with robust standard errors and χ 2 calculation in the presence of missing values. Weights and strata were specified in the model to account for the complex survey design. To estimate the models’ goodness-of-fit, we followed the recommendations of Schreiber et al. (Reference Schreiber, Nora, Stage, Barlow and King2006) and report, in addition to the χ 2 statistic, three approximate fit indices, the Tucker–Lewis Index (TLI), the Comparative Fit Index (CFI), and the Root Mean-Square Error of Approximation (RMSEA). TLI and CFI close to or above 0.95 combined with RMSEA of 0.06 or lower indicate reasonably good fit (Hu and Bentler, Reference Hu and Bentler1999). The significance level criterion for all other statistical tests was set at 0.05.
Variance resulting from specific measurement occurrences in the cross-lagged panel model was accounted for by correlating the uniquenesses within waves (Marsh and Hau, Reference Marsh and Hau1996). Because factorial invariance across time points is a major requirement of a valid autoregressive model (Finkel, Reference Finkel1995), we first tested for and assured “weak factorial invariance” (in terms of Meredith, Reference Meredith1993) by setting the factor loadings of the latent variables, loneliness, hopelessness, and depressive symptoms, as equal across waves. These constructs’ disturbances were specified as correlated within each wave. Stationarity was tested for and specified by setting all path coefficients to be invariant across waves (except for the correlation between loneliness and hopelessness at wave 1).
Results
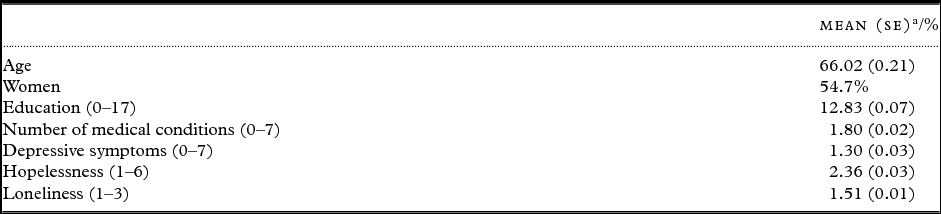
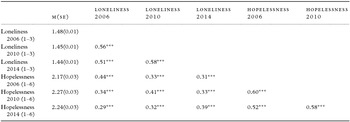
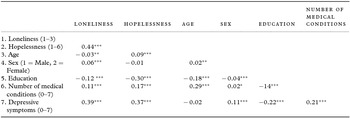
Sample characteristics are presented in Table 1. Table 2 presents the associations between loneliness and hopelessness across the three waves of data collection. Significant associations between loneliness and hopelessness were moderate across all three waves (2006, 2010, 2014), with concurrent correlations between 0.39–0.44. Table 3 presents inter-correlations among baseline variables, measured in 2006.
Sample characteristics at baseline (N = 7,831)

a SE = standard error.
Means, standard errors, and correlations among loneliness (3-item R-UCLA) and hopelessness scores across the three waves a

***p < 0.001.
a Overall, 7,831 respondents aged 50 and older completed the at least one wave between 2006 and 2014.
Inter-correlations among variables at baseline (n = 1,225)

*p < 0.05, **p < 0.01, *** p < 0.001.
As a first step of our main analyses, we tested the measurement model of the three latent constructs measured over three time points, with cross-wave correlations between errors of the same measures and with factor loadings constrained for equality across waves. The model fitted well to the data, with χ2 (763) = 2,246.56, p < 0.001, TLI = 0.962, CFI = 0.967, RMSEA = 0.015 (90% CI = 0.014; 0.016).
Next, we fitted the hypothesized autoregressive cross-lagged model with covariates. Time-invariant age, gender, and education were specified to affect each one of the three occurrences of loneliness and hopelessness. Depressive symptoms and number of medical conditions were specified to affect loneliness and hopelessness measured in the same wave. This model fitted the data well, χ2 (1,006) = 3,455.67, p < 0.001, TLI = 0.927, CFI = 0.934, RMSEA = 0.020 (90% CI = 0.020; 0.021). Figure 1 presents the main elements of this model (standardized paths and proportions of explained variance), with relations between covariates and main research variables omitted from the Figure. In the text, we report unstandardized coefficients.
The autoregressive effects of loneliness (B (SE) = 0.63 (0.02), p < 0.001) and hopelessness (B (SE) = 0.63 (0.02), p < 0.001) were substantive and significant across the three waves, pointing to the stability of both constructs over the eight-year study period. The lagged effect of loneliness on hopelessness was non-significant (B (SE) = 0.05 (0.03), p = 0.16), whereas the lagged effect of hopelessness on loneliness was significant (B (SE) = 0.01 (0.01), p = 0.03). Because the standardized coefficients of the lagged effects were similar, additional analyses were conducted to determine whether the lagged effects of hopelessness on loneliness was significantly different from the lagged effects of loneliness on hopelessness, using the Diftest command. The χ 2 test for difference testing was not significant, χ2 (1) = 2.016, p = 0.156. Thus, although hopelessness significantly predicted later loneliness and loneliness did not significantly predict later hopelessness, the magnitude of these relationships were not statistically different.
Because the sample was relatively young, sensitivity analysis was conducted, repeating the analysis for adults aged 75 and older. The results were consistent: the lagged effect of loneliness on hopelessness was non-significant (B (SE) = −0.06 (0.09), p = 0.46), whereas the lagged effect of hopelessness on loneliness was significant (B (SE) = 0.63 (0.04), p < 0.001).
Discussion
The primary aims of this study were to examine the longitudinal relationships of hopelessness and loneliness in a nationally representative sample of Americans aged 50 and older. Those who were more hopeless more often became lonely four years later, across two four-year time periods. The opposite was not found; lonelier participants did not become more hopeless over time. These findings should be viewed with caution, however, because the magnitude of the lagged effects was not significantly different. As such, if hopelessness does predict loneliness four years later and if loneliness does predict loneliness four years later, the magnitude of these long-term effects would appear to be small, at best. These results were found after controlling for the stability of hopelessness and loneliness over time, as well as several baseline covariates: age, gender, years of education, number of medical conditions, and depressive symptoms. Hopelessness and loneliness were remarkably consistent over time; hopeless individuals tended to remain hopeless, and lonely individuals tended to remain lonely. Moreover, hopelessness and loneliness were moderately correlated with each other at each time point (r = 0.39–44), so they may impact each other more strongly over shorter periods of time. The covariates were correlated with hopelessness and loneliness at baseline in predictable patterns based on previous research (Everson et al., Reference Everson, Kaplan, Goldberg, Salonen and Salonen1997; Haatainen et al., Reference Haatainen2003; Thurston and Kubzansky, Reference Thurston and Kubzansky2009; Vanderweele et al., Reference Vanderweele, Hawkley, Thisted and Cacioppo2011; Holt-Lunstad et al., Reference Holt-Lunstad, Smith, Baker, Harris and Stephenson2015). Participants who were more hopeless or lonely tended to have less education, more medical conditions, and worse depressive symptoms. Lonely participants also were more likely to be younger and female, whereas hopeless individual were more likely to be older. The strongest correlations were for depressive symptoms (hopelessness r = 0.37, loneliness r = 0.39), medical conditions (hopelessness r = 0.17, loneliness r = 0.11), and education (hopelessness r = −0.30, loneliness r = −0.12).
The statistically significant result for hopelessness predicting loneliness four years later is consistent with the hypotheses and the only prior longitudinal study we identified that examined lagged effects of hopelessness and loneliness (Joiner and Rudd, Reference Joiner and Rudd1996). As such, our study extends the findings from college students to a large nationally representative sample of older Americans, and extends the findings from a ten-week follow-up to an eight-year follow-up. These are the strengths of the current study – the large representative sample and the long follow-up with three waves of data.
The primary consideration in interpreting the findings is the small magnitude of the cross-lagged effects, rendering the findings tentative. Hopelessness predicted loneliness four years later with a standardized coefficient of 0.03, which was statistically significant (p = 0.03); although the coefficient of loneliness predicting hopelessness four years later was 0.02, it was not statistically significant (p = 0.16). Because the magnitude of the lagged effects in the current study was small and not significantly different from the non-significant lagged effect of loneliness on hopelessness, it appears that the long-term effects of hopelessness on loneliness are small, if present at all. Hopelessness and loneliness were significantly correlated at each time point (r = 0.39–0.44), so perhaps these variables influence each other over shorter periods of time.
One weakness of the study is the correlational design, which limits any determination of causality. Other weaknesses include lack of information about potential mechanisms by which hopelessness might contribute to loneliness and lack of measurement of different facets of loneliness and social functioning that might relate differentially to hopelessness.
One consideration in interpreting the findings is the measurement of hopelessness in older adults (Neufeld et al., Reference Neufeld, O'rourke and Donnelly2010). Older adults may possess a different perspective regarding the future than younger age groups, and they may not respond well to the original true/false format of the Beck Hopelessness Scale. Despite these concerns, there is evidence of utility of the measure of hopelessness used here. The HRS used four items to measure hopelessness, omitting items from the Beck Hopelessness Scale that might be problematic (such as imagining one's future in ten years) and using a 6-point Likert response scale, which has been found to improve validity (Neufeld et al., Reference Neufeld, O'rourke and Donnelly2010). The items included focus on the person's expectations for the future and ability to achieve desired outcomes. Internal consistency was good (α = 0.84), and the hopelessness scale correlated as expected with other variables, particularly depressive symptoms (r = 0.37).
In a sense, this study's findings raise more questions than answers. The first question is whether hopelessness and loneliness may predict each other over shorter periods of time, such as the ten-week study (Joiner and Rudd, Reference Joiner and Rudd1996) or intermediate time frames. Given their moderate correlations at concurrent time points, perhaps they have more cyclical influence on each other, which would be better captured by microlongitudinal designs or even daily studies. Additional questions include mechanisms of how hopelessness might contribute to loneliness, magnitude of hopelessness effects on loneliness, under what conditions loneliness might contribute to hopelessness, and intervention strategies to improve both of these aversive conditions.
Regarding mechanisms by which hopelessness might contribute to loneliness, hopelessness could impact social relationships and perceptions in several ways. A hopeless person likely withdraws from social relationships or does not try to form social relationships; other people also may withdraw from someone who is hopeless. A hopeless person also withdraws from other goals and obligations, creating conflict or disruptions in social relationships (e.g. partners or family members becoming disappointed or angry with a hopeless relative not taking care of household or work responsibilities). Moreover, if a hopeless person withdraws from other activities (e.g. hobbies, work responsibilities), then they would miss opportunities to meet and interact with other people. It would be valuable in future studies to further explore mechanisms by which hopelessness may lead to loneliness, such as through social withdrawal or withdrawal from other goals and responsibilities. Another direction for future research includes the study of hopefulness, involving expectations about being able to achieve desired goals, which is associated with a variety of positive outcomes, including good perceived social functioning (for review, please see Gum, in press).
Several theorists and researchers have theorized that loneliness contributes to hopelessness (e.g. Golden et al., Reference Golden2009), although this lagged effect was not significant in the current findings. In the current study, hopelessness was measured as a general expectation regarding the future. Perhaps loneliness contributes to hopelessness related to social ties and perceptions. The evolutionary theory of loneliness (Hawkley and Cacioppo, Reference Hawkley and Cacioppo2010) approaches loneliness as an aversive signal that derives from the discrepancy between desired and actual social relationships, which motivates people to socially engage and reconnect. If they feel hopeful about being able to improve their social relationships, then they would take action and extricate themselves from this painful and distressing experience. This might explain why loneliness was not associated with hopelessness over time. In contrast, there are people who are caught in a vicious cycle referred to as a “regulatory loop,” when their efforts to reconnect fail and lead to chronic, prolonged loneliness (Hawkley and Cacioppo, Reference Hawkley and Cacioppo2010). Loneliness might lead to hopelessness over time in cases when people cannot free themselves of their painful social situation. Thus, it would be worthwhile to explore the association between prolonged loneliness and hopelessness over time in future research.
Given the relationships between hopelessness and loneliness, as well as their relationships with depressive symptoms and medical conditions, optimal intervention strategies will likely be multimodal in nature. Some promising interventions help older adults at risk of suicide to improve loneliness and social functioning through peer contacts (Van Orden et al., Reference Van Orden, Stone, Rowe, McIntosh, Podgorski and Conwell2013). Similarly, peer educators can benefit older adults with depressive symptoms (Conner et al., Reference Conner, Mckinnon, Ward, Reynolds and Brown2015). If hopelessness contributes to loneliness, then it may be valuable to explicitly measure and target hopelessness as part of these socialization interventions. Interventionists could examine general hopelessness as well as hopelessness about social relationships. Strategies from interventions to increase hope in older adults (Gum, in press) are potentially relevant. Based on a goal pursuit theory of hope, strategies include helping individuals identify personally relevant goals, pathways to achieve goals, and motivation to pursue goals and work around challenges. The focus could be on identifying and pursuing social goals, other personal goals related to interpersonal problems or isolation, and goals related to medical conditions affecting social functioning. A hope-based intervention has been found to benefit older adults and medically ill adults in terms of hope, depressive symptoms, and functional disability (Cheavens and Guter, in press, Klausner et al., Reference Klausner, Clarkin, Spielman, Pupo, Abrams and Alexopoulos1998). By integrating these intervention strategies, we may be able to improve both hope and social connections for older adults, thereby preventing many harmful outcomes in later life.
Conflict of interest
None.
Description of authors’ roles
All three authors developed the design, hypotheses, and statistical design; wrote sections of the manuscript; and reviewed and revised the entire manuscript. A. Gum and S. Shiovitz-Ezra drafted sections of the introduction and discussion. L. Ayalon carried out the statistical analyses and drafted the methods and results.
Acknowledgments
The HRS is supported by the National Institute on Aging (NIA U01AG009740) and the Social Security Administration. Amber Gum was supported by a 2015–2016 Fulbright Core Scholar Award from the US Department of State to Bar-Ilan University during the preparation of this manuscript.