INTRODUCTION
Forest ecosystems play an important role in the world's carbon budget with one-third of terrestrial net primary production generated by tropical rain forests alone (Field et al. Reference FIELD, BEHRENFELD, RANDERSON and FALKOWSKI1998, Malhi et al. Reference MALHI, BAKER, PHILLIPS, ALMEIDA, ALVAREZ, ARROYO, CHAVE, CZIMCZIK, DIFIORE, HIGUCHI, KILLEEN, LAURANCE, LAURENCE, LEWIS, MERCADO MONTOYA, MONTEAGUDO, NEILL, NÚNEZ VARGAS, PATIÑO, PITMAN, QUESADA, SALOMAO, MACEDO SILVA, TORRES LEZAMA, VÁSQUEZ MARTÍNEZ, TERBORGH, VINCETI and LLOYD2004). Earlier studies (Tanner et al. Reference TANNER, VITOUSEK and CUEVAS1998) investigating the extent to which productivity of tropical forests is constrained by nitrogen (N) availability seemed to confirm the soil-age nutrient limitation model by Walker & Syers (Reference WALKER and SYERS1976): N, which is derived primarily from the atmosphere, gradually accumulates as soils develop, while rock-derived phosphorus (P) becomes progressively bound in unavailable forms as soils age. This model suggests that productivity of forest ecosystems on young soils could be N-limited while ecosystems on highly weathered soils could be P-limited.
Nutrient limitation to an ecosystem process cannot be defined in an absolute way, e.g. nutrient concentration in soil, but is an interplay between nutrient availability on one hand and nutrient demand by an ecosystem process on the other hand. Thus, limitation by a nutrient can only be revealed if addition of that nutrient (i.e. experimentally) increases the rate of an ecosystem process (Tanner et al. Reference TANNER, VITOUSEK and CUEVAS1998). Results from earlier N-addition studies seem to generally support the soil-age N limitation model. However, this generalization is strongly influenced by the well-studied Metrosideros polymorpha forests on Hawaii. N addition in monospecific stands in Hawaii increased stem diameter growth on young (Raich et al. Reference RAICH, RUSSEL, CREWS, FARRINGTON and VITOUSEK1996, Vitousek et al. Reference VITOUSEK, WALKER, WHITEAKER and MATSON1993) to intermediate-aged (Vitousek & Farrington Reference VITOUSEK and FARRINGTON1997) soils and litterfall on young soils (Harrington et al. Reference HARRINGTON, FOWNES and VITOUSEK2001, Vitousek et al. Reference VITOUSEK, WALKER, WHITEAKER and MATSON1993), while it had no effect on stem diameter growth in stands on a highly weathered Oxisol (Herbert & Fownes Reference HERBERT and FOWNES1995). However, some findings also contradict this pattern: N addition did not affect stem diameter growth in a mixed-species stand in Colombia on a thin (young) soil (Cavelier et al. Reference CAVELIER, TANNER and SANTAMARIA2000), did not affect litterfall in a mixed-species stand in Venezuela on an Inceptisol (young soil) (Tanner et al. Reference TANNER, KAPOS and FRANCO1992), but increased litterfall in a monospecific stand in Hawaii on a highly weathered soil (Harrington et al. Reference HARRINGTON, FOWNES and VITOUSEK2001, Herbert & Fownes Reference HERBERT and FOWNES1995). N addition increased stem diameter growth in a mixed-species stand in Jamaica on an organic soil of indeterminate age (Tanner et al. Reference TANNER, KAPOS, FRESKOS, HEALEY and THEOBALD1990). Thus, other species-rich tropical forests showed a wider range of possible responses. Additionally, there is a deficiency in spatially and temporally concurrent data sets on the main components of above-ground net primary production of tropical forests (Shoo & VanDerWal Reference SHOO and VANDERWAL2008).
Our study was conducted in a tropical lower montane rain forest on an Alic Hapludand soil, which is less developed compared with highly weathered soils (e.g. Ultisol and Oxisol). We hypothesized that net primary productivity of this montane forest is primarily N-limited. Our objectives were (1) to assess changes in different components of above-ground net primary production (i.e. litterfall and stem diameter growth) under increased N availability, and (2) to identify differences among tree diameter classes and tree species in the response of different components of above-ground net primary production of this mixed-species stand. Our results contribute to the scarce knowledge on N limitation to tropical montane forests productivity.
METHODS
Study area
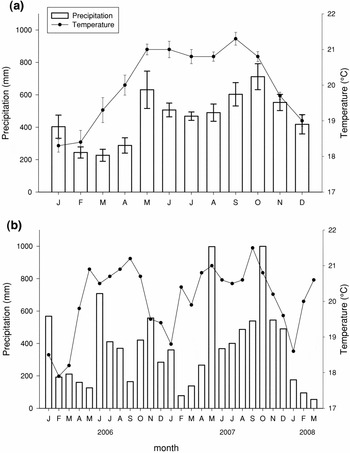
The study area is situated in the western Panamanian province of Chiriquí. It lies within the Fortuna Forest Reserve which forms part of the La Amistad Biosphere Reserve. The Fortuna watershed forms a high valley in the Talamanca range with the mountains surrounding our study site rising up to 2200 m asl. The study site is located at 1200–1300 m asl in the Quebrada Honda area (8°45ʹN, 82°15ʹW). The vegetation is a mature forest that can be classified as lower montane rain forest (sensu Grubb Reference GRUBB1977, Holdridge et al. Reference HOLDRIDGE, GRENKE, HATHEWAY, LIANG and TOSI1971). The stand has a mean stem density of 1039 trees ha−1 and a mean basal area of 46.05 m2 ha−1 (both for trees with ≥ 10 cm diameter at breast height (dbh)); trees over 10 cm dbh account for only 14% of all trees ≥ 1 cm dbh, but they make up for 86% of the total basal area. The mean canopy height is around 20 m; single trees (mostly individuals of Oreomunnea mexicana) can reach up to 40 m. The estimated number of tree species from two 1-ha plots in the Quebrada Honda area is approximately 90 (J. Dalling, pers. comm.). The most abundant species are: Oreomunnea mexicana (Standl.) Leroy (Juglandaceae), Eschweilera panamensis Pittier (Lecythidaceae), Vochysia guatemalensis Donn. Sm. (Vochysiaceae), Cassipourea elliptica (Sw.) Poir. (Rhizophoraceae), Hedyosmum bonplandianum Mart. (Chloranthaceae) and Guarea glabra Vahl (Meliaceae). Also common is the palm Colpothrinax aphanopetala R. Evans. Annual mean precipitation is 5545 ± 308 mm (1997–2007) without a clear dry season (no month < 100 mm precipitation); annual mean temperature is 20°C ± 0.1°C (1999–2007) (Figure 1a). Monthly precipitation and temperature for the period from January 2006–March 2008 are shown in Figure 1b. Ambient N deposition from rainfall was 5 kg N ha−1 y−1, measured every other week from 2006 to 2007 from a clearing near the study site; the rainfall chemical analyses are described in detail by Koehler et al. (Reference KOEHLER, CORRE, VELDKAMP, WULLAERT and WRIGHT2009).
Climate data from the Smithsonian Tropical Research Institute station (Casa Verde) 3.5 km from the study site, located at Quebrada Honda (Fortuna Forest Reserve), Chiriquí, Panama. Mean annual precipitation (1997–2007) and mean annual temperature (1999–2007) (a), monthly precipitation and monthly temperature during the study period (January 2006–March 2008) (b).

Experimental design and soil characteristics
The experiment was set up in a paired-plots design with four replicate plots. Each plot is 40 × 40 m, and plots are separated by at least 40 m. Plots lack gaps, swampy areas, streams or slopes steeper than 15°. Measurements of side lengths were corrected for inclination (Condit Reference CONDIT1998). Each plot was divided into sixteen 10 × 10-m subplots. Control and N-fertilized treatments were randomly assigned to each pair of plots. The N-fertilized plots received 125 kg urea-N (CO(NH2)2) ha−1 y−1 divided into four applications per year (February 2006, May 2006, July 2006, October 2006, February 2007, June 2007, August 2007, November 2007, March 2008). We chose urea for a practical reason: NH4NO3 is not sold in Panama due to security concerns. Urea was applied manually, walking back and forth across each subplot and changing directions (east-to-west and north-to-south) in subsequent applications.
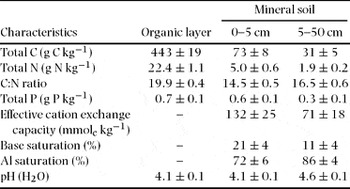
Soil characteristics were determined in January 2006 prior to treatment application (for methodology see Koehler et al. Reference KOEHLER, CORRE, VELDKAMP, WULLAERT and WRIGHT2009). These characteristics (Table 1) did not differ between plots which were later randomly assigned as control and N-fertilized. The soil is derived from volcanic ash deposits, has a sandy loam texture, and is classified as Aluandic Andosol (FAO classification) or Alic Hapludand (USDA) (Table 1).
Soil characteristics of the lower montane rain forest in Quebrada Honda (Fortuna Forest Reserve), Chiriquí, Panama (mean ± SE; n = 8 plots).

Stem diameter increment
To monitor stem diameter increment rates, dendrometer bands made of astralon (D1, UMS, Munich, Germany) with an accuracy of 0.1 mm were attached to 40 trees with dbh ≥ 10 cm per replicate plot; dendrometer bands were installed at breast height (1.3 m) or at 0.5 m above buttresses on the few trees where they occurred at breast height (Condit Reference CONDIT1998). Trees were categorized in three dbh classes: 10–30 cm, 30–50 cm and > 50 cm with an average number of stems of 28, 10 and 2 trees per plot, respectively. This diameter distribution of trees monitored for stem diameter increment (hereafter dendrometer trees) was chosen because it represents the percentage diameter distribution of trees ≥ 10 cm dbh into these three dbh classes in the study area (J. Dalling, unpubl. data). Dendrometer trees in the 30–50-cm and > 50-cm dbh classes often represented the only individuals of their class in a plot; trees in the 10–30-cm class were chosen by selecting at least two individuals in the inner subplots (inside 20 × 20-m area) and approximately one individual in the outer subplots (outside 20 × 20-m area), but all trees were chosen within the inner 30 × 30-m area of each plot so that a 5-m border zone remained. Among the dendrometer trees, the growth rates of the 10–30-cm and 30–50-cm dbh classes were additionally analysed for the three most abundant species (O. mexicana, E. panamensis and V. guatemalensis), as in these dbh classes they were present in at least two replicate plots per treatment. Oreomunnea mexicana accounted for an average of 19% of dendrometer trees per plot, Eschweilera panamensis for 8% and Vochysia guatemalensis for 7%.
Dendrometer bands were installed in January 2006 and were allowed to stabilize for 2 mo before measurements began. Monthly stem diameter growth was monitored for 2 y (February 2006 to March 2008) from the start of N manipulation. Readings were carried out always at the same time of day and in the same sequence to avoid bias from daily stem diameter fluctuations (Sheil Reference SHEIL2003). Growth rates were calculated as the differences between consecutive monthly growth measurements for each tree, and monthly growth rates of the trees were averaged to represent each replicate plot; the monthly mean and standard error of the control and N-fertilized treatments were based on the four replicate plots per treatment.
Litter production
Fine litterfall was collected every other week beginning March 2006 using four 0.5-m2 litter traps per plot. Litter traps were made of a PVC frame and a plastic mesh and were installed in the inner 20 × 20-m area of the plots to avoid litter from outside the plot falling into the traps. The fine litter of every trap was separated into seven categories: leaves, twigs ≤ 2 cm in diameter, bark, flowers, fruits, epiphytes and unidentifiable material (rest). Dry mass of each category was determined by drying at 65°C for 72 h. For each litterfall category, dry mass was calculated as a mean of the four traps per plot, and the mean and SE were based on the four replicate plots per treatment.
Due to shortage of workforce from November 2006 to January 2007 and from April to June 2007, litter separation was only done every second litter collection for these periods. The amount of leaves during the collection dates when litter was not separated was calculated from the mean amount of leaves of the previous and following collection dates.
Hemispherical photographs
With the aim of comparing canopy closure and plant area index (PAI) between control and N-fertilized plots over a period of 1 y, hemispherical photographs of the canopy were taken in January and February 2006 and again in February 2007. Cover fraction was used as a measure of canopy closure. Photos were taken under overcast sky conditions from 11h00 to 14h00. We used a Minolta Dimage Xt digital camera equipped with a 185° fisheye lens. The camera was mounted on a self-levelling device (HemiView, Delta-T, Cambridge, UK) and installed on a tripod 1.3 m above the ground facing skyward. Photographs in 2006 and 2007 were taken from the same sample points which were located at the fixed central points of the 10 × 10-m subplots of each plot, totalling to 16 photographs per plot. The photographs were analysed with CAN_EYE Version 5 (INRA, Avignon, France). CAN_EYE includes all plant parts (stems, branches, leaves) into the analysis; thus, the calculated index is a PAI. As the increment in woody plant parts during the measurement period is assumed to be not detectable by the program, changes in PAI are attributed solely to changes in leaf area.
Estimation of above-ground net primary production (ANPP)
Above-ground woody biomass production (AWBP) was estimated based on the growth rates of the dendrometer trees. The difference in above-ground woody biomass between succeeding years is reported here as the annual AWBP. The annual AWBP for each replicate plot was calculated by weighing the mean AWBP of the different dbh classes with the number of trees belonging to the respective dbh classes in each plot. Woody biomass was calculated based on the equation for wet forest stands given by Chave et al. (Reference CHAVE, ANDALO, BROWN, CAIRNS, CHAMBERS, EAMUS, FÖLSTER, FROMARD, HIGUCHI, KIRA, LESCURE, NELSON, OGAWA, PUIG, RIÉRA and YAMAKURA2005):

where ρ is the wood density (or wood specific gravity defined as oven-dry wood mass over green volume), D is the diameter at breast height, and H is the height of the tree. We chose their formula because formulae that include three parameters (i.e. dbh, tree height and wood density) are usually considered more accurate than formulae that require a smaller set of parameters.
We measured the height of the 320 dendrometer trees at the beginning of the study using a Vertex III Ultrasonic Hypsometer with Transponder T3 (Haglöf, Sweden). Wood density was determined based on wood cores of the most important species. Wood cores were sampled by driving an increment borer (Haglöf, Sweden) with an inner diameter of 5.1 mm into the wood towards the centre of the trunk to a maximum depth of 30 cm. Wood density was calculated by dividing the oven-dry mass (65°C, 72 h) of a bark-free wood core with its fresh volume. Fresh volume was measured by sinking a wood core into a water-filled cylinder that was placed on a balance and the measured weight of displaced water gave the volume of the wood core (http://www.edb.ups-tlse.fr/equipe1/chave/wood-density-protocol.pdf). A total of 96 trees from 16 species were sampled for wood-density measurements with a higher number of samples (13–18 trees) in the five most abundant species. For species for which wood density was not measured, a weighted-mean wood density was calculated per plot based on the measured wood densities. ANPP was calculated for each plot as the sum of annual AWBP and annual total fine litterfall.
Statistical analyses
Tests for normality using Kolmogorov–Smirnov D statistic and for equality of variance using Levene statistic (Sokal & Rohlf Reference SOKAL and ROHLF1981) were conducted for each parameter. Non-normally distributed data sets were transformed (square root) before analysis. Independent t-test was used to test significant differences in annual stem growth rates and biomass production (litter, above-ground woody biomass and net primary production) between control and N-fertilized treatments. Mean and SE, determined from four replicate plots, are reported as measures of central tendency and dispersion. Statistical differences in canopy closure were tested using paired t-test for photo-by-photo comparison between years at each plot and independent t-test to compare the changes in canopy closure between treatments. The response of stem growth to N fertilization across time was assessed using linear mixed-effects models in which treatment is considered as fixed effect and spatial replication (experimental plots) nested in time (monthly sampling) as random effect (Crawley Reference CRAWLEY2002). P ≤ 0.05 indicates significant difference.
RESULTS
Stem diameter increment
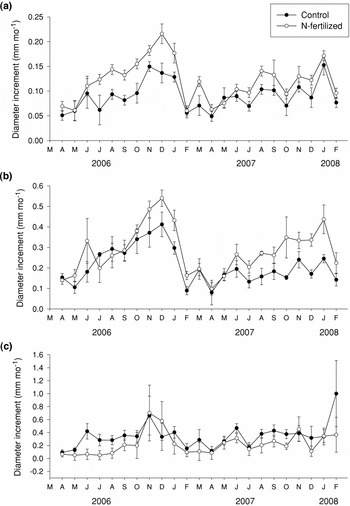
Monthly stem diameter increment rates in the first year of N addition followed a seasonal pattern. In the 10–30-cm and 30–50-cm dbh classes, low increment rates were observed from March to May 2006, increasing from June to December 2006 and starting to decline in January 2007 (Figures 2a, b). In the > 50-cm dbh class, stem diameter increment rates increased from June to November 2006 in the control plots and from September to November 2006 in the N-fertilized plots (Figure 2c). This pattern was correlated with monthly rainfall for trees with 10–30-cm dbh from the control plots (r2 = 0.43, P = 0.020), for trees with 30–50-cm dbh from the N-fertilized plots (r2 = 0.35, P = 0.041), and for trees with > 50 cm dbh from the control (r2 = 0.69, P = 0.000) and N-fertilized plots (r2 = 0.35, P = 0.044). Neither of these patterns was correlated with mean monthly temperature. Although in the second year of N addition monthly stem diameter increment rates showed a less seasonal pattern, trees in the 10–30-cm and 30–50-cm dbh classes had higher diameter increment rates from August 2007 to Janauary 2008. Stem diameter increment rates in the second year were neither correlated with monthly rainfall nor with mean monthly temperature.
Monthly stem diameter increment rates (mm mo−1) of trees 10–30 cm dbh (a), trees 30–50 cm dbh (b), and trees > 50 cm dbh (c). Each replicate plot was represented on average by 28 trees for 10–30 cm dbh, 10 trees for 30–50 cm dbh and 2 trees for > 50 cm dbh. N-fertilized plots received 125 kg urea-N ha−1 y−1 split in four applications (February, May, July and October 2006; February, June, August and November 2007; March 2008). Stem diameter increment rates were higher in N-fertilized than control plots for trees 10–30 cm dbh from June–December 2006 and for trees 30–50 cm dbh from August 2007–January 2008 (linear mixed-effects model at P ≤ 0.05).

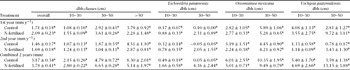
Trees in the 10–30-cm dbh class responded quickly to N addition; higher diameter increment rates in N-fertilized than the control plots were observed in the high-growth period of the first year (June–December 2006; Figure 2a). Trees in the 30–50-cm dbh class responded to N addition after 17 mo (August 2007–January 2008; Figure 2b). Trees in the > 50-cm dbh class generally did not respond to N addition during the 2 y of study (Figure 2c). Annual diameter increment of the overall dbh class and of the > 50-cm dbh class did not differ between treatments during the 2-y measurement, while annual diameter increments of trees in the 10–30-cm and in the 30–50-cm dbh classes were higher under N fertilization in the first year and in the second year, respectively (Table 2). Annual diameter increment of the three most abundant species did not respond to N addition during the 2-y measurement (Table 2).
Stem diameter growth for different diameter at breast height (dbh) classes and species. Within each column, mean ± SE (n = 4 plots) followed by a different letter indicate significant differences between treatments within years (independent t-test at P ≤ 0.05).

Litter production and hemispherical photographs
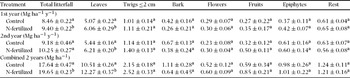
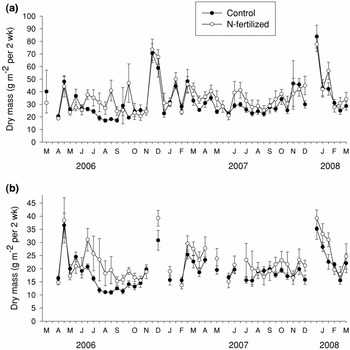
Total litterfall showed a seasonal pattern: low amounts from May to August, and high amounts from November to February (Figure 3a). Leaves dominated the total litterfall (Table 3) and followed a similar seasonal pattern as total litterfall (Figure 3b). Total litterfall and leaf litter started to increase in the N-fertilized plots in June 2006 (Figures 3a, b) and remained higher than in the control plots throughout the low-litterfall period (until October 2006). There was no difference between treatments during the high-litterfall period, indicating that litterfall was at its maximum during this time and was not increased further by N fertilization.
Amounts of fine litterfall. Within each column, mean ± SE (n = 4 plots) followed by a different letter indicate significant differences between treatments within years (Independent t-test at P ≤ 0.05).

Total fine litterfall (a) and leaves (b) (g m−2 per 2 wk) collected every other week. Each replicate plot was represented by four litter traps of 0.5 m2 area each. N-fertilized plots received 125 kg urea-N ha−1 y−1 split in four applications (February, May, July and October 2006; February, June, August and November 2007; March 2008). During November 2006 to January 2007 and April to June 2007, litter was separated only every second collection.

In the first year of N addition, annual total fine litterfall was higher in the N-fertilized than in the control plots. In the first and second year, leaf litterfall was higher under N fertilization. For the 2-y measurement period, total litterfall and leaf litter were higher in the N-fertilized than in the control plots (Table 3). The amounts in other litterfall categories (twigs ≤ 2 cm, bark, flowers, fruits, epiphytes, rest) did not differ between treatments.
The comparison of canopy closure and PAI at the beginning of N fertilization and after 1 y showed no difference between control and N-fertilized plots. Canopy closure was 87% and 83% in 2006 and 85% and 83% in 2007 in control and N-fertilized plots, respectively. PAI was 5.02 m−2 and 5.16 m−2 in 2006, and 4.68 m−2 and 4.82 m−2 in 2007 in control and N-fertilized plots, respectively.
Above-ground net primary production (ANPP)
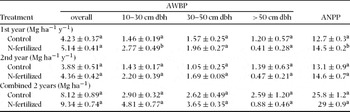
Above-ground woody biomass prior to treatment application was 346 ± 17 and 386 ± 32 Mg ha−1 in the plots that were later assigned as control and N-fertilized, respectively. AWBP did not differ between treatments, with the only exception being AWBP in the 10–30-cm dbh class in the first year (Table 4). ANPP (AWBP + total litterfall) in the N-fertilized plots exceeded ANPP in the control plots by 14.6% in the first year (Table 4), while there was no difference in the second year. Total litterfall contributed 69% and 68% to ANPP in the control and N-fertilized plots, respectively.
Above-ground woody biomass production (AWBP) and above-ground net primary production (ANPP). Within each column, mean ± SE (n = 4 plots) followed by a different letter indicate significant differences between treatments within years (Mann–Whitney U-test at P ≤ 0.05).

DISCUSSION
Stem diameter growth response to nitrogen addition
Despite the annual rainfall of 5500 mm in our site with no clear dry season, we observed correlations between stem growth rates and monthly rainfall. These correlations are due to similarity in seasonal patterns of rainfall and stem growth rates, but rainfall per se may not be a main cause of increased tree growth. However, there are conflicting indications of which meteorological factors might influence stem diameter growth periodicity. On the one hand, Clark et al. (Reference CLARK, CLARK and OBERBAUER2009) demonstrated that dry-season rainfall constrains stem growth at rainfall levels above the ones previously known to be limiting for very wet tropical forests. On the other hand, in a review article, Baker et al. (Reference BAKER, SWAINE and BURSLEM2003) highlighted irradiance as the most important factor influencing temporal growth patterns in aseasonal tropical forests, having a clear, positive effect on tree growth. Inter-annual variation of tree growth rates in a tropical wet forest at La Selva, Costa Rica was also attributed to variation in irradiance (Clark & Clark Reference CLARK and CLARK1994). As there are no irradiance data for our study area available it remains unknown which, if any, meteorological factor(s) drive(s) the intra-annual pattern and inter-annual differences in stem growth rates.
In our study site, the varied responses of different dbh classes to N fertilization influenced the overall stem growth response. Trees 10–30-cm dbh and 30–50-cm dbh responded to N fertilization in the first and second year, respectively. The amount of rainfall was considerably lower in 2006 (4174 mm) compared to 2007 (5669 mm). We can infer that this lower rainfall total in the first year implies less cloudy conditions and hence higher irradiance. It can be assumed that trees in the 10–30-cm dbh class were able to use the added N to increase stem diameter growth only under these favourable light conditions (in the first year). Trees in the 30–50-cm dbh class increased stem diameter growth in the second year as their position in the canopy gives them a competitive advantage to use the added N even under less favourable light conditions. Fertilization experiments in tropical montane forests have shown that stem growth is often co-limited by N and P. Fertilization with N and P separately resulted in an increase in stem growth in a montane forest in Jamaica (Tanner et al. Reference TANNER, KAPOS, FRESKOS, HEALEY and THEOBALD1990), while only a combined fertilization of N and P increased stem growth in an elfin forest in Colombia (Cavelier et al. Reference CAVELIER, TANNER and SANTAMARIA2000). In our N-fertilization experiment, we cannot test whether stem diameter growth is only limited by N or co-limited by P or other nutrients. Overall stem growth did not significantly change with N addition because the positive growth response of trees in the 10–30-cm dbh class was only expressed under favourable light conditions while trees in the 30–50-cm dbh class constituted only 19% of dendrometer trees in N-fertilized plots.
Response in fine-litter production and plant area index (PAI) to nitrogen addition
The observed seasonal pattern of fine litterfall did not correspond with the seasonal pattern of rainfall or temperature. Most authors related the litterfall maximum of a year to the drier time of the year (Brasell et al. Reference BRASELL, UNWIN and STOCKER1980, Kunkel-Westphal & Kunkel Reference KUNKEL-WESTPHAL and KUNKEL1979, Röderstein et al. Reference RÖDERSTEIN, HERTEL and LEUSCHNER2005, Tanner et al. Reference TANNER, KAPOS and FRANCO1992), but premontane and montane rain forests may also have a second litterfall peak in the wet season (Nadkarni & Matelson Reference NADKARNI and MATELSON1991, Priess et al. Reference PRIESS, THEN and FÖLSTER1999, Röderstein et al. Reference RÖDERSTEIN, HERTEL and LEUSCHNER2005). The latter authors suggested that this second maximum may be due to strong winds occurring during this time. At our site, strong winds occur from November to February and during this windy period higher fine litterfall was observed.
Total fine litterfall lies within the range reported for neotropical montane rain forests: 3.1–12.9 Mg ha−1 y−1 (Köhler et al. Reference KÖHLER, HÖLSCHER and LEUSCHNER2008, Vitousek Reference VITOUSEK1984). The proportion of leaves in total fine litterfall was similar to the average of 70% calculated by Vitousek (Reference VITOUSEK1984) for 62 tropical forests. From Hawaiian N-fertilization experiments, Herbert & Fownes (Reference HERBERT and FOWNES1995) measured a higher total litterfall and leaf litter after 1.5 y of N addition and Vitousek et al. (Reference VITOUSEK, WALKER, WHITEAKER and MATSON1993) reported an N fertilization effect on total litterfall in the second year of their study. The investigated forest stands in Hawaii are nearly exclusively composed of Metrosideros polymorpha, a species that seems to be responsive to N fertilization. From a mixed-species stand in Venezuela, Tanner et al. (Reference TANNER, KAPOS and FRANCO1992) found no effect of N addition on fine litterfall during 4 y of N fertilization. In our study, we found increased total fine litterfall and leaf litterfall in the first year of N fertilization. Despite increased leaf production, PAI was not increased in N-fertilized plots, indicating that leaf turnover increased through decreased leaf life span under N addition. Similar results were found in Hawaiian N-fertilization experiments (Herbert & Fownes Reference HERBERT and FOWNES1995, Vitousek et al. Reference VITOUSEK, WALKER, WHITEAKER and MATSON1993). In ecosystems with a low N availability, e.g. tropical montane forests, build-up costs for leaf material are very high and thus leaves are maintained in the canopy over a long time (Chapin Reference CHAPIN1980, Cordell et al. Reference CORDELL, GOLDSTEIN, MEINZER and VITOUSEK2001, Reich et al. Reference REICH, WALTERS and ELLSWORTH1992). As N limitation to leaf production is reduced under N addition, leaves may be shed faster and leaf turnover times may become shorter.
Response of above-ground net primary production (ANPP) to nitrogen addition
AWBP at our study site is within the range reported for tropical montane forests: 3.5–9.1 Mg ha−1 y−1 (Harrington et al. Reference HARRINGTON, FOWNES and VITOUSEK2001, Herbert & Fownes Reference HERBERT and FOWNES1995, Tanner Reference TANNER1980a, Reference TANNERb). Trees ≥ 50 cm dbh had the highest stem growth rates of the three dbh classes (in control plots; in N-fertilized plots this order is changed due to the N fertilization effect; Table 2), a finding consistent with the studies of Clark & Clark (Reference CLARK and CLARK1999) and da Silva et al. (Reference DA SILVA, DOS SANTOS, SIZA TRIBUZY, CHAMBERS, NAKAMURA and HIGUCHI2002). Nevertheless, they contributed a minor proportion to the overall AWBP (Table 4) because they only account for 3% of the stem density and 21% of the basal area of trees ≥ 10 cm dbh.
ANPP at our site is at the upper end of the range reported for tropical montane forests: 5.8–13.9 Mg ha−1 y−1 (Harrington et al. Reference HARRINGTON, FOWNES and VITOUSEK2001, Herbert & Fownes Reference HERBERT and FOWNES1995, Raich Reference RAICH1998, Tanner Reference TANNER1980a, Reference TANNERb; Weaver & Murphy Reference WEAVER and MURPHY1990). ANPP in the N-fertilized plots increased only in the first year due to a higher litter production (Table 3). As in other neotropical forests (Clark et al. Reference CLARK, BROWN, KICKLIGHTER, CHAMBERS, THOMLINSON and NI2001, Malhi et al. Reference MALHI, BAKER, PHILLIPS, ALMEIDA, ALVAREZ, ARROYO, CHAVE, CZIMCZIK, DIFIORE, HIGUCHI, KILLEEN, LAURANCE, LAURENCE, LEWIS, MERCADO MONTOYA, MONTEAGUDO, NEILL, NÚNEZ VARGAS, PATIÑO, PITMAN, QUESADA, SALOMAO, MACEDO SILVA, TORRES LEZAMA, VÁSQUEZ MARTÍNEZ, TERBORGH, VINCETI and LLOYD2004), litterfall dominated ANPP in our site. Neotropical forests differ from the mature lowland forest in Kalimantan, Indonesia, where ANPP was strongly related to AWBP of large trees (> 60 cm dbh; Paoli & Curran Reference PAOLI and CURRAN2007). As maximum net photosynthesis and above-ground production efficiency (ANPP/foliar biomass) decrease with increasing leaf life span (Reich et al. Reference REICH, WALTERS and ELLSWORTH1992), the production of short-lived leaves due to higher N availability should result in an increased ANPP. Since leaves are the primary assimilatory organs of plants that enable all other life processes, leaf production (resulting in higher leaf litter) should have a higher priority than stem growth (Malhi et al. Reference MALHI, BAKER, PHILLIPS, ALMEIDA, ALVAREZ, ARROYO, CHAVE, CZIMCZIK, DIFIORE, HIGUCHI, KILLEEN, LAURANCE, LAURENCE, LEWIS, MERCADO MONTOYA, MONTEAGUDO, NEILL, NÚNEZ VARGAS, PATIÑO, PITMAN, QUESADA, SALOMAO, MACEDO SILVA, TORRES LEZAMA, VÁSQUEZ MARTÍNEZ, TERBORGH, VINCETI and LLOYD2004, Tanner et al. Reference TANNER, VITOUSEK and CUEVAS1998). In our study, litter production not only contributes a higher proportion to ANPP but also reacts more strongly to N fertilization than stem diameter growth (and therefore AWBP), and is the most important component driving the response of ANPP to N fertilization.
In conclusion, N fertilization did not affect overall stem diameter growth and AWBP but increased leaf litterfall and total litterfall, thereby causing an increase in ANPP in the first year. Our results suggest that these components of above-ground productivity are not uniformly limited by N availability.
ACKNOWLEDGEMENTS
We thank two anonymous reviewers for the thorough and helpful reviews. The Smithsonian Tropical Research Institute provided administrative and technical support. We highly appreciate the help of the research assistants Arturo Morris, Rodolfo Rojas, Evidelio Garcia and Ignacio Delcid. We are grateful to Inga Krämer for the introduction into the CAN_EYE program. Dr James Dalling provided background information and assisted in the site selection. This study is under the NITROF project funded by the Robert Bosch Foundation (Germany) and awarded to M. D. Corre as independent research group leader.