I. INTRODUCTION
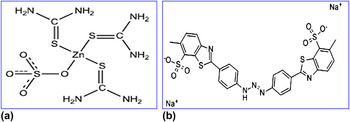
Dye doped polymers and glasses have been used to fabricate solid state photonic devices. We believe that the growth of nonlinear optical (NLO) single crystals with dye doping may possess higher thermal conductivity, reduced scattering and intrinsic polarization. To match the demand of functional materials different kinds of materials have been developed and functionalized with exceptional optical and NLO properties. NLO materials are of pronounced importance due to their applications in various modern electronic and photonic devices. Reference Saleh1–Reference Badan, Hierle, Perigaud, Zyss and Williams7 Currently the grown single crystals of NLO materials are used in devices like: data transformation, data retrieving, high data storage capacity, frequency doubling, frequency conversion, fast processing, and fusion research. Reference Badan, Hierle, Perigaud, Zyss and Williams7–Reference Shkir, Muhammad and AlFaify10 Semiorganic materials have the capability for enhancing the optical nonlinearity and chemical flexibility of organics with the physical supremacy of inorganics. Reference Newman, Warren, Cunningham, Chang, Cooper, Burdge, Polak-Dingels and Lowe-Ma11,Reference Cunningham, Warren, Marcy and Rosker12 These materials also have the benefit of easy growth in aqueous solution to form bulk single crystals. Zinc(tris) thiourea sulphate, (Zn[CS(NH2)2]3·SO4) (ZTS) is a good semiorganic material which displays good NLO properties and is useful in high-power lasers as frequency convertor and also it may be a superior alternative to potassium dihydrogen orthophosphate single crystals. Reference Dhumane, Hussaini, Dongre and Shirsat13 The chemical structure of ZTS is shown below (a) (Scheme 1).
Chemical structure of (a) ZTS and (b) titan yellow (TY) dye.

The enhancement in the numerous crucial properties such as crystal growth rate, morphology, crystalline precision, optical transparency, band gap, second harmonic generation efficiency, laser damage threshold has been achieved due to some additives or dopants in ZTS. Reference Williams14–Reference Sinha, Goel, Singh, Gupta and Kumar20 The rod-like pure and doped single crystals can be used in high-power lasers, in materials processing, including cutting, welding, drilling, and marking the metals and they can give 50 times more output power than the conventional doped silica fiber Reference Li, Johnson, Nie, Harrington and Shori21,Reference Didierjean, Castaing, Balembois, Georges, Perrodin, Fourmigué, Lebbou, Brenier and Tillement22 [single-crystal fibers for higher-power lasers, doi: 10.1117/2.1201401.005298].
Many researchers and scientists have been involved in growth of dye doped single crystals due to their potential uses in solid state lasers as well as many other optoelectronic applications. Reference Bhandari, Sinha, Ray and Kumar19,Reference Enculescu23–Reference Benedict, Wallace, Reid, Jang and Kahr30 The dyeing processes in single crystals have been studied by Benedict et al., recently, and simple sulfate, phosphate, and carboxylate single crystals salts have been grown by a solution method. Reference Poborchii, Tada and Kanayama31 Single crystals grown with luminescent dyes may be cast in lasers devices. Reference Yang and Ozin32,Reference Wanke, Lehmann, Müller, Wen and Stuke33 In the current work, the authors have grown TY organic laser dye [chemical structure is shown above (b)] doped rod-like ZTS single crystals. It is shown that TY has a clear effect on crystal morphology, optical transparency, fluorescence, and dielectric properties of ZTS crystals.
II. EXPERIMENTAL METHODOLOGY
A. Synthesis
Single crystals of pure and dye doped ZTS were synthesized by using zinc sulphate heptahydrate [ZnSO4·7H2O] and thiourea [CS(NH2)2] in a stoichiometric ratio of 1:3 and with 0.1 mol% TY dye to prepare TY dye doped ZTS (TYZTS). In the first step, the calculated amount of each salt was dissolved in double distilled water at room temperature. After preparing all the solutions they were mixed very slowly and continuously stirred at 700 rpm for more than 24 h using a temperature controlled magnetic stirrer. During synthesis we maintained the temperature below 50 °C to avoid decomposition and for chemical reaction to produce a uniform mixture of ZTS.
 $$\eqalign{ & {\rm{ZnS}}{{\rm{O}}_4} \cdot 7{{\rm{H}}_2}{\rm{O + }}3{\left[ {{\rm{CS}}\left( {{\rm{N}}{{\rm{H}}_2}} \right)} \right]_2} \to {\rm{Zn}}{\left[ {{\rm{CS}}{{\left( {{\rm{N}}{{\rm{H}}_2}} \right)}_2}} \right]_3} \cdot {\rm{S}}{{\rm{O}}_4} \cr & {\rm{Zinc\ sulphate\ heptahydrate}}\quad \quad {\rm{thiourea}}\quad \quad {\rm{Zinc(tris)\ thiourea\ sulphate}}\left( {{\rm{ZTS}}} \right) \cr}$$
All the prepared solutions were transferred to a Petri dish to evaporate the solvent and obtain the highly crystalline powders of ZTS and TYZTS. The ph value was measured before transferring the solution and found to be 5.8 for pure ZTS and 5.5 for dye doped solution, respectively. The low value of ph for dye doped solution indicates that the solution is less acidic and gives good quality crystals.
B. Crystal growth
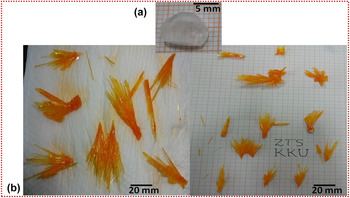
To grow high quality single crystals of ZTS and TYZTS, the synthesized materials were dissolved in double distilled water above room temperature and recrystallized many times to get highly pure material. After preparing all the solutions, we filtered them using good quality filter paper in a highly cleaned different beaker, covered with a perforated lid and housed in a highly stable constant temperature bath at 27 °C. After about 15 days the pure ZTS crystal of ∼10 mm length and after 60 days TYZTS rod-like single crystals of ∼60 mm length were harvested from the pure and doped mother solutions, respectively, as shown in Figs. 1(a) and 1(b), respectively. From Figs. 1(a) and 1(b) it is clear that the faces such as: (100), (001), (101), (011), (011), (010) present in pure ZTS crystal Reference Ushasree, Jayavel, Subramanian and Ramasamy34 [Fig. 1(a)] are suppressed due to dye doping and the growth is taking place along (110) direction. The pure ZTS single crystal.
As grown (a) pure ZTS and (b) rod-like single crystals of TYZTS.

C. Characterization methods
ZTS and TYZTS crystals were characterized using a Shimadzu X-600 Japan powder x-ray diffractometer (PXRD; Shimadzu Corp., Tokyo, Japan) having CuKα radiation (40 kV, 30 mA, λ = 0.1543 nm) at the scan rate of 0.02°/m over the angular range of 5–70° at ambient temperature. FT-Raman spectroscopy measurement was carried out on both the crystals using a DXR FT-RAMAN spectrometer (ThermoFisher Scientific, Waltham, Massachusetts) with laser power 10 mW, at excitation wave length 532 nm, at estimated resolution 5.1 to 8.3 cm−1 and size of the aperture was 50 μm. The grown crystals were observed by scanning electron microscope (SEM; JSM 6360 LA, JEOL Ltd., Tokyo, Japan) equipped with energy dispersive analytical x-ray unit (EDXS) to study the surface topography and quantitative (elemental composition) analysis. A Shimadzu UV-vis-NIR spectrophotometer model (UV-3600; Shimadzu Corp.) was used to record the diffuse reflectance (DR) in the wide wave length range. Photoluminescence (PL) spectra of the pure and TY doped ZTS crystals were recorded using a Lumina fluorescence spectrometer (ThermoFisher Scientific) in the wave length range of 380–700 nm at room temperature. The grown single crystals were cut in rectangular shape and polished to make their surface flat with similar thickness for dielectric study. Before subjecting these crystals for measurement, we sputter coated both sides with 10 nm of platinum. Using a KEITHLEY 4200-SCS system (Keithley Instruments, Beaverton, Oregon), the dielectric constant, loss, and ac conductivity were measured in higher frequency range of 1 kHz to 10 MHz at room temperature.
III. RESULTS AND DISCUSSION
A. Structural studies
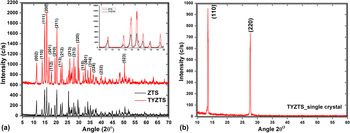
X-ray diffraction (XRD) pattern of pure and dye doped ZTS powdered specimens are shown in Fig. 2. For the confirmation of growth direction, the XRD pattern was also recorded for the main face of as grown dye doped ZTS single crystal [Fig. 2(b)]. In Fig. 2(b), TYZTS single crystal shows only two peaks at 13.56° and 27.66° which correspond to (110) and (220) diffraction planes. From Fig. 2(b), it is clear that the rod-like single crystals have been grown along (110) direction. The enhancement in the peak intensities was observed due to dye doping which means that the quality of the grown crystals may also be enriched with TY. The recorded diffraction data was used as input in POWDERX and CHECKCELL software to determine the crystal system and lattice parameters.
PXRD patterns of (a) ZTS and TYZTS powdered crystals and (b) as grown rod-like TYZTS crystal.

The obtained lattice parameters for pure and dyed ZTS are a = 11.123 Å, b = 7.770 Å, c = 15.491 Å, V = 1538.821 Å3, 11.124, 7.771, and 15.492 Å, V = 1340.515 Å3, respectively, obtained from POWDERX refinement. The lattice parameters obtained from refinement confirms that the grown crystals are orthorhombic with space group Pca21 and point group mm2 which is in good agreement with earlier report. Reference Andreetti, Cavalca and Musatti35 No phase change was found due to dye doping apart from the small variation in the lattice parameters and shift of peak positions towards the higher angle [see inset Fig. 2(a)]. The shift in angular position of the peaks confirms the presence/adsorption of dye in ZTS crystal.
B. Vibrational studies
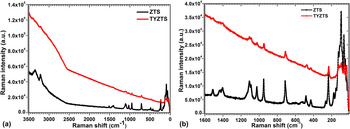
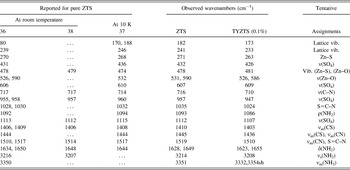
Figure 3(a) shows the recorded FT-Raman spectra of ZTS and TYZTS in the wave number range from 1600 to 5 cm−1. The vibrational modes are presented in Table I with their corresponding assignments that are described based on the literature. Reference Bhandari, Sinha, Ray and Kumar19,Reference Venkataramanan, Srinivasan and Bhat36–Reference Samuel, Krishnamurthy and Rajasekaran38 Vibrational bands observed in the higher wave number region (i.e., 3000–3500 cm−1) are due to symmetric and asymmetric NH stretching vibration of several N–H—O bonds in the ZTS crystals structure. The band due to asymmetric and symmetric stretching vibrations of NH was observed at 3351, 3216 cm−1 in ZTS, and at 3354, 3208 cm−1 in TYZTS. It can be seen in Fig. 3(b) and Table 1 that the vibrational bands are due to asymmetric stretching of C–N and stretching vibrations of C=S respectively Reference Venkataramanan, Srinivasan and Bhat36 at ∼1519, 1445, and 1410 cm−1 in ZTS and at 1510, 1436, 1403 cm−1 in TYZTS. The C=S stretching vibration of thiourea 1412 and 730 are shifted to 1410, 716 in ZTS and 1403 and 710 cm−1 in TYZTS crystals which are expected in metal–sulphur complexes and also may be due to dye incorporation, as these bands are reported at 1406 (1409) and 717 cm−1 for pure ZTS. Reference Venkataramanan, Srinivasan and Bhat36 Vibration bands observed at ∼1112 and 1093 cm−1 in pure ZTS are due to stretching vibration of SO4 and rocking of NH2, respectively, while these bands in TYZTS crystals are observed at 1107 and 1086 cm−1 and are shifted to lower frequency. The vibration bands observed at ∼1035 and 957 cm−1 in ZTS while at ∼1024 and 947 cm−1 in TYZTS are due to S=C–N and SO4 vibrations, respectively. The vibrational bands observed at ∼716 and 478 cm−1 in ZTS and 710 and 481 cm−1 in TYZTS are due to symmetric stretching, and rocking vibrations of C–N and at ∼607 and 432 cm−1 in ZTS and at ∼609 and 426 cm−1 in TYZTS are due to SO4 vibration, respectively. The vibrational band observed at 271 cm−1 in ZTS, while at 263 cm−1 in TYZTS is due to stretching vibration of Zn–S, this band for pure ZTS was reported at 270 cm−1. Reference Venkataramanan, Srinivasan and Bhat36 The vibrational peaks at 241 and 182 cm−1 in ZTS while at 233 and 173 cm−1 in TYZTS are due to lattice vibration. All peak positions and intensities were shifted and enhanced which is due to dye incorporation in the ZTS matrix which may also enhance the luminescence properties of ZTS crystals.
FT-Raman spectra of ZTS and TYZTS crystals in the wave number range of (a) 3500–0 cm−1 and (b) 1600–0 cm−1.

Vibrational frequencies and their corresponding assignments of ZTS and TYZTS crystals.

C. Quantitative and qualitative analysis by SEM/EDXS
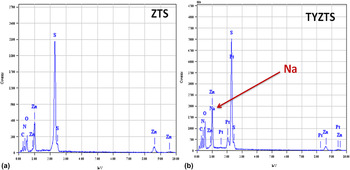
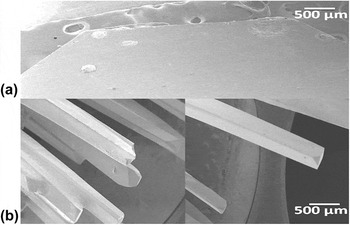
The measured EDXS patterns of ZTS and TYZTS crystals are shown in Fig. 4. The % amount of all elements present in ZTS as well as in TYZTS such as C, N, O, S, Zn, and Na are found to be 8.55, 18.84, 16.20, 28.69, 17.31%, and 9.36, 18.88, 16.31, 28.84, 17.02, and 2.02%, respectively obtained experimentally and fond in good agreement with theoretically calculated values of Zn, S, C, N, O and H for ZTS which are 9.36, 21.58, 16.43, 32.84, 16.80, 3.11%, respectively. The EDXS result shows that the grown crystals of ZTS have good stoichiometry as also determined by XRD and the values of elements have been minutely varied for TYZTS due to dye doping. The presence of Na (i.e., 2.02 by mass% or 1.77 by at.%) confirms the presence of TY dye. The values of other elements were also found to vary due to dye doping in ZTS crystals in comparison to pure ZTS at the theoretical composition. For qualitative and morphological analysis of ZTS and TYZTS crystals SEM micrographs were captured from different places and resolutions as shown in Figs. 5(a) and (b). From Fig. 5(b), it is clear that the TYZTS have rod-like morphology. The rod-like crystals of TYZTS of average size about 2000 µm were measured from SEM micrograph. The SEM micrographs show that the grown crystals are having good crystalline perfection which was confirmed with optical and dielectric studies below.
EDXS patterns of (a) ZTS and (b) rod-like TYZTS single crystals.

SEM micrographs of (a) ZTS and (b) rod-like TYZTS single crystals.

D. Optical studies
1. DR analysis
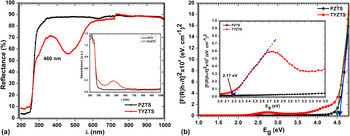
To study the electronic structure of bulk as well as nano materials the DR spectroscopy technique is found to be superior and more precise than generally used UV-vis absorption spectroscopy. Reference Morales, Mora and Pal39–Reference Kubelka and Munk41 DR spectroscopy is a destructive technique for surface analysis using a mirror like reflection from the subjected specimen by an integrating sphere attachment. In this technique, the ratio of the light scattered from a thick layer (about 2 mm) and from an ideal non/weak-absorbing reference specimen is recorded as a function of wave length. Incident radiation on the specimen leads to diffuse illumination and the incident light is partially absorbed and scattered. The scattered radiation from the specimen is collected by an integration sphere and detected. Reference Weckhuysen and Schoonheydt42 The Kubelka–Munk theory Reference Kubelka and Munk41 has been applied for this analysis from the faintly absorbing specimens. Therefore, we have subjected all the grown single crystals after crushing them by mortar into a fine and homogeneous powder and loaded into a deep (∼2 mm) sample holder for DR spectrum measurement. The recorded DR spectrum of ZTS along with rod-like TYZTS crystals is shown in Fig. 6(a). Cut off wave length in both the grown crystals is at nearly 294 ± 4 nm. It is clear from Fig. 6 that there is one broad and strong absorption band at 460 nm which may be due to presence of TY dye in the crystalline matrix of ZTS. In previous reports, several researchers have detected an absorption band due to dye in other ZTS crystals. Reference Bhandari, Sinha, Ray and Kumar19,Reference Sinha, Goel, Singh, Gupta and Kumar20 Non-uniformity of dye doping in crystalline ZTS has been reported. Reference Bhandari, Sinha, Ray and Kumar19 However, in the current work the dye was homogeneously doped into ZTS [see Fig. 1].
(a) DR and (b) band gap plots of ZTS and rod-like TYZTS crystals.

To determine its suitability for applications in opto-electronic devices the optical band gap TYZTS was calculated using reflectance data. The optical band gap was evaluated for both ZTS and TYZTS crystals as follows:
The Kubelka–Munk Reference Kubelka and Munk41 relation is stated as follows:
 $$F\left( R \right) = {{{{\left( {1 - R} \right)}^2}} \over {2R}}\quad ,$$
where F(R) is known to be Kubelka–Munk function and R is the absolute reflectance.
The absorption coefficient can be written in terms of F(R):
 $${\rm{\alpha }} = {{{\rm{absorbance}}} \over s} = {{F\left( R \right)} \over s}\quad ,$$
where s is the diameter of sample (i.e., 2 mm).
In case of DR, to calculate the optical band gap the equation is:
 $$\left( {\alpha h\nu } \right){)^{{1 \over n}}} = {\left( {{{F\left( R \right)h\nu } \over s}} \right)^{{1 \over n}}} = A\left( {h\nu - {E_{\rm{g}}}} \right)\quad ,$$
where, n is an index value that differentiates the process of optical absorption and its value for direct allowed transitions is 1/2, for direct forbidden transitions is 3/2, for indirect allowed transitions is 2, and for indirect forbidden transitions is 3. Reference Urbach43 The constants such as A, h, ν are known as the characteristic parameter for the transitions, Planck's constant, and frequency of light, respectively. We have calculated the band gap of ZTS and rod-like TYZTS crystals at all the transition values of n and the best fitted curve was recognized at n = 1/2. The variation of (αhν)2 versus hν, plots are shown in Fig. 6(b). The band gap value was obtained from the point of interception on x(hν) axis, (αhν)2 = 0, for both the grown crystals. The value of the band gap was 4.6 eV for pure ZTS and 4.5 eV for TYZTS crystals. It is clear from figure that the value of band gap was slightly decreased due to TY doping as suggested by the coloration of the crystal. Similar doping effect on the band gap of ZTS and other crystals was also observed by others. Reference Bhandari, Sinha, Ray and Kumar19,Reference Shkir, Riscob, Ganesh, Vijayan, Gupta, Plaza, Dieguez and Bhagavannarayana44 Due to TY dye doping in ZTS matrix, a new band gap has been observed i.e. ∼2.17 eV [the inset of Fig. 7]. The titled material possess high optical energy band gap which makes it favorable for optoelectronic device applications Reference Shkir, Abbas, Kumar, Bhagavannarayana and AlFaify5,Reference Shkir, Muhammad, AlFaify, Irfan and Yahia9,Reference Shakir, Kushwaha, Maurya, Bhagavannarayana and Wahab45–Reference Shkir, Riscob, Hasmuddin, Singh, Ganesh, Wahab, Dieguez and Bhagavannarayana48 .
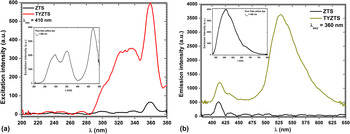
PL (a) excitation and (b) emission spectra for ZTS and rod-like TYZTS single crystals.

E. PL analysis
The recorded PL excitation and emission spectra recorded for ZTS as well as TYZTS single crystals at ambient temperature shown in Figs. 7(a) and 7(b), respectively. The same excitation wave length (i.e., 360 nm) to record the emission spectra of both the crystals is used and similar process was applied for recording the excitation spectra (λem = 412 nm). The PL spectra of ZTS and TYZTS single crystals show a violet-blue emission band at 412 and 414 nm, respectively, which may be attributed to unavoidable intrinsic or crystal defect levels which develop during the growth process of the crystals. Reference Xu, Li, Chua, Wang and Wang49,Reference Kushwaha, Maurya, Vijayan, Gupta, Haranath, Kumar, Kanjilal and Bhagavannarayana50 There is one blue emission in pure ZTS at 434 nm and blue and green intense emission in TYZTS crystals at 433 and 528 nm. The band at 434 in ZTS and 433 in TYZTS may be attributed to increased S2− vacancies Reference Bol, Ferwerda, Bergwerff and Meijerink51 or zinc interstitials Reference Pal, Bera, Sarkar and Jana52 as a result an increase in vacancy related defects. Recently, for pure and doped or irradiated ZTS crystals, it was reported at 348 and 416 nm (when λexc= 310 nm), at 423 nm (when λexc= 358 nm), at 406 (λexc= 249 nm) and such broad emission band between 370 and 500 nm. Reference Bhandari, Sinha, Ray and Kumar19,Reference Kushwaha, Maurya, Vijayan, Gupta, Haranath, Kumar, Kanjilal and Bhagavannarayana50,Reference Kushwaha, Maurya, Haranath and Bhagavannarayana53 Further, the PL excitation and emission spectra for pure TY dye solution prepared in double distilled water was also recorded (λexc = 465 nm and λem = 560 nm) and shown in the inset of Figs. 7(a) and 7(b). An intense emission band has been observed at 560 nm for pure TY dye. When we compared the observed emission band in TYZTS crystal at 528 nm with pure dye, it is clear that the band has been shifted to lower wave length which shows the interaction of dye with ZTS crystalline matrix.
F. Dielectric studies
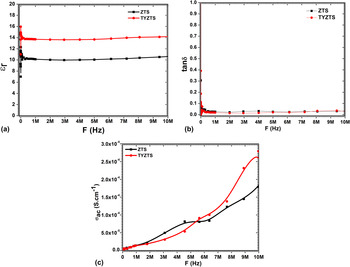
Dielectric measurements were carried out on ZTS and rod-like TYZTS crystals and the plots of variation of dielectric constant (εr), dielectric loss (tan δ) over wide range of frequency are shown in Figs. 8(a) and 8(b). The dielectric constant is higher in the lower-frequency region and then it decreases and becomes stable at higher frequencies [Fig. 8(a)]. The high dielectric constant in the low frequency range may be due to four charges i.e., electronic, ionic, dipolar, and space charge polarizations contribution as it is depend on the frequencies. Reference Xue and Kitamura54
Plots of (a) dielectric constant, (b) dielectric loss and (c) ac conductivity for ZTS and TYZTS crystals.

Generally, the value of εr tends to decrease with increase of frequency and reaches a constant value, depending on the fact that the electric field and dipole does not follow the alternating field beyond a certain frequency.
Reference Hill55
The dielectric constant of TYZTS was ∼14 due to doping, which is also higher than previous reports on dye doped ZTS crystals.
Reference Bhandari, Sinha, Ray and Kumar19
The reason behind the enhancement of these values may be the formation of additional hydrogen bonds in creating additional dipoles oriented in random directions. Figure 8(b) shows that the dielectric loss also depends on the frequency as that of dielectric constant. In the low frequency range, the dielectric loss depends on numerous factors such as crystal size, defects, etc. and can be controlled as well.
Reference Przeslawski, Iglesias and Gonzalo56,Reference Shakir, Kushawaha, Maurya, Kumar, Wahab and Bhagavannarayana57
The low value of dielectric loss in the grown crystals confirms that they contain very low defect concentrations. The ac conductivity (σac) was also calculated using the following relation: σac = 2πfε0εrtanδ, where ε0 is the dielectric constant of free space
 $\left( {{\varepsilon _0} = 8.854 \times {{10}^{ - 12}}{F \over m}} \right)$
, εr relative dielectric constant and f is the frequency of applied ac field, tan δ is dielectric loss, and the value of π = 3.14. The value of ac conductivity (σac) [Fig. 8(c)] is found to be increased with frequency and follows the frequency power law.
IV. CONCLUSION
The rod-like TY dye doped (0.1%) ZTS single crystals of size ∼60 mm were grown successfully using simple and low cost slow evaporation solution technique in aqueous solution at room temperature. A remarkable effect of TY dye on the crystal morphology of ZTS was observed. The homogeneous doping of TY dye in the crystalline matrix of ZTS was confirmed by visible change in the color and morphology of the crystal. The crystal system and lattice parameters were evaluated and no effect on the crystal phase was observed due to doping which was further confirmed by FT-Raman spectroscopic study. The minute shifting in the vibrational modes was observed which confirms the doping in ZTS crystalline matrix. Further, the quantitative, qualitative and morphological analyses were done by SEM/EDXS study. The presence of dye was confirmed by determining the elemental composition. The SEM study shows that the grown crystals are of good quality and rod-like crystal morphology was observed for dye doped ZTS crystals. A new broad and strong absorption band was observed at 460 nm in DR spectrum which may be due to presence of TY dye in the crystalline matrix of ZTS. The optical band gap was calculated for ZTS as well as TYZTS crystals and found to be 4.6 and 4.5 eV and also a new band gap was observed in ZTS crystal by dye doping i.e., 2.17 eV. The high band gap suggests that the grown crystals can be used in optoelectronic devices. The intensity of PL emission was found to be enhanced in dye doped ZTS crystals which may be due to the formation of vacancies or F-centers. The dielectric constant, loss, and ac conductivity measurements were carried out and shown that the value of dielectric constant was enhanced due to dye doping. The low loss values suggest that the grown crystals contain least defects. All the results shows clear enhancement in the properties of ZTS due to dye doping. Therefore the grown crystals with dye doping are may be more appropriate than the pure ZTS crystals in electro-optic device applications.
ACKNOWLEDGMENT
The author is highly thankful to King Khalid University, Abha, Saudi Arabia for providing all necessary facilities for current research.