Implications
A precise knowledge of manure characteristics in pig farms will contribute to improve economic and environmental impacts of manure management. The prediction of pig excretion is of prime importance when modelling manure composition. Moreover, pigs are also emitting CH4, which is a harmful greenhouse gas. This paper presents a model predicting the effects of feeding and animal performances on N, P, K, Cu, Zn, C, dry matter and water excretion, and CH4 emissions, by pigs at different physiological stages. The model has been developed and validated from numerous literature data.
Introduction
Livestock production, particularly pig production, is pointed out as a major contributor to the main environmental issues, either at a global (greenhouse effect) or a local level (eutrophisation, acidification…) (Basset-Mens and Van der Werf, Reference Basset-Mens and Van der Werf2005; Food and Agriculture Organization of the United Nations (FAO), 2006). Direct impacts are associated to water pollution by nitrates, P, organic matter (OM), micro-organisms or trace elements, air pollution by ammonia (acidification and aerosols), N2O and CH4 (global warming effect) emissions and soil pollution by excessive accumulation of P or trace elements (Cu and Zn). These releases to the environment are an important threat to biodiversity, ecosystem stability (and their use by human activities such as fishery or tourism) or human or animal health. Their reduction would therefore significantly contribute to sustainable development. Such a reduction is also of prime importance for the own sustainability of pig production systems, as are the economical efficiency or the improvement of meat quality. Indeed, the environmental impact affects the perception of pork production by citizens, and to some extent of pork meat by consumers, thus participating to the overall product quality. Moreover, ecosystem degradation might reduce the agricultural production potential in the medium term. In fact, the negative environmental effects of swine-production systems are often the result of inadequate collection, storage and utilisation of manure as fertiliser. That is why a precise evaluation of the amount and composition of manure produced by pig farms is required. This can be reached through sampling and analysis, but this approach is expensive and difficult to achieve in commercial conditions. Although rapid analysis procedures are available for N, they remain imprecise (Levasseur et al., Reference Levasseur, Charles, Le Bris, Boulestreau, Landrain and Athanase2007). Another alternative is the utilisation of mathematical models that can predict these environmental hazards from the available on-farm information.
Characteristics of excreta are of prime importance when modelling manure composition. Indeed, the amount of most of the compounds found in manure (P, K, Cu and Zn) only depends on their amount in the feed and their retention by pigs. Moreover, many of the processes involved in manure maturation and gaseous emissions, and also the efficiency of manure treatments, are affected by faeces and urine composition. In addition to excretion in faeces and urine, pigs are also emitting CH4 from the intestinal tract, which is a harmful greenhouse gas. Emission of CO2 through respiration is generally not taken into account in farm greenhouse gases inventories, because it is involved in carbon short-cycle, but its assessment could be of interest for a precise investigation of carbon cycle in farms.
Thus, the objective of this paper is to describe the basis for a mathematical model to precisely predict the volume and composition of urine and faeces excreted by pigs at all physiological stages, as well as the production of greenhouse gases, according to diet characteristics and animal performance. In this paper, validation, simulations and discussion focus on manure volume and nutrient excretion.
Model description
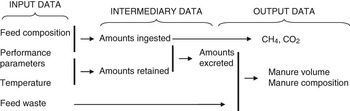
Model inputs are feed composition, animal performances and ambient temperature. The outputs are manure (urine and faeces) volume, N, P, K, Cu, Zn and C amounts, dry and OM amounts, and deduced composition (concentrations). Intermediary variables are ingested, retained and excreted amounts (Figure 1). The amounts of water, dry and OM and minerals excreted are calculated by a mass balance approach, that is, as the difference between intake (feed and drink water) and retention, corrected by other inputs (endogenous excretion) and outputs (water evaporation). The prediction of manure also includes feed waste, which is another input of the model. Gaseous emissions are estimated as a function of heat production (CO2) or fibre consumption (CH4). Intermediate and output variables are calculated with relationship derived from literature surveys.
Schematic representation of the model.

Animal intake
The prediction of the composition of pig’s excreta requires intakes and digestibilities of minerals, dry and OM and energy, as well as those of crude protein, fat, crude fibre, starch, sugars and lignin (to predict OM composition and carbon excretion). Composition of the feed can be obtained by chemical analysis or calculated from the tabulated compositional values of the ingredients in the diet (Institut National de Recherche Agronomique, Association Française de Zootechnie et Institut National Agronomique Paris-Grignon (INRA-AFZ-INAPG), 2004). Feed intake (kg) can be directly entered as an input of the model, or estimated from feed conversion ratio and weight gain. Dietary nutrient amounts and digestibility values can be calculated from the ingredient’s nutrient digestibility, assuming that the nutrient supply by each ingredient is independent of the other ingredients (Noblet and Shi, Reference Noblet and Shi1994). In the case of P digestibility, however, it is required to take into account the natural phytase activity of some dietary ingredients (wheat, barley, etc.) or the addition of microbial phytase, (INRA-AFZ-INAPG, 2004). Precision of the feed composition must be considered in the interpretation of the model simulations.
CH4 and carbon dioxide emitted by the animal
The energy associated with CH4 production (E(CH4), MJ) constitutes part of the difference between digestible energy (DE) and metabolisable energy (ME), the other part corresponding to energy in the urine. CH4 production (CH4 Emitted, kg) is calculated from E(CH4), considering CH4 calorific value equal to 56.65 MJ/kg (equation (1)) (Intergovernmental Panel on Climate Change (IPCC), 2006).

E(CH4) varies according to physiological status of the animal and the amount of digested fibre ingested (ResD). ResD is estimated as the difference between digested OM and digested protein, fat, starch and sugar, as proposed in INRA-AFZ-INAPG tables (2004). The loss of energy as CH4 is then obtained by multiplying ResD by 670 or 1340 J/g for growing pigs and sows, respectively (Noblet et al., Reference Noblet, Seve and Jondreville2004).
The amount of CO2 produced by animal respiration (CO2 Emitted, kg/day) is determined from heat production (HeatProd, kJ/day) on the basis of 0.163 l/h CO2 per Watt of heat (International Commission of Agricultural and Biosystems Engineering (CIGR), 1984), corrected by CO2 density (22.4 l/mol) and molecular mass (44 g/mol) (equation (2)).

At thermoneutrality, heat production (kJ/day) corresponds to the sum of the energy used for maintenance and the fraction of the ingested ME (MJ/kg), which is not retained in the body or excreted in milk (Noblet et al., Reference Noblet, Dourmad, Le Dividich and Dubois1989; Noblet et al., Reference Noblet, Dourmad and Etienne1990). This last fraction can be determined from the ME and net energy (MJ/kg) contents of the feed and feed amount (feed, kg). Specific equations are used for growing pigs (Noblet et al., Reference Noblet, Dourmad, Le Dividich and Dubois1989, equation
(3)) and reproductive sows (Noblet et al., Reference Noblet, Dourmad and Etienne1990, equation
(4)) considering their body weight (BW, kg), as well as for piglets, considering their average daily gain (ADGLitter, kg/day) (Noblet and Etienne, Reference Noblet and Etienne1987, equation
(5)). Below thermoneutrality, the ME required for thermoregulation has to be added (Noblet et al., Reference Noblet, Dourmad, Le Dividich and Dubois1989; Quiniou et al., Reference Quiniou, Noblet, Van Milgen and Dubois2001).


Amount and volume of manure excreted (urine and faeces)
The total weight of the produced manure is obtained by adding the amounts of excreted water and dry matter (DM). Manure volume (l) is calculated from its weight and its density (g/l), the later being obtained from effluent DM concentration (in g/kg slurry), as proposed by Bertrand and Arroyo, Reference Bertrand and Arroyo1983, equation
(6).

Water excretion
Inputs in water balance (WaterBalance, kg/day) are drinking and feed water and metabolic water, and outputs are water retention in animals and water evaporation (equation (7)).

The amount of water in the feed is calculated from its DM content. Drinking water can be entered as an input or calculated from feed consumption and water/feed ratio.
To evaluate the amount of water generated by the oxidative metabolism (WaterMetabolic, kg/day) it is assumed that one molecule of H2O (18 g/mol) is produced for each molecule of CO2 (Oliveira, Reference Oliveira1999) equation
(8).

Water retention (WaterRetained, kg/day) is calculated from water in animal’s body (WaterBody, kg), which is determined from body protein content (ProtBody, kg) (De Greef and Verstegen, Reference De Greef and Verstegen1995, equation
(9)).

For sows, the amount of water retained in uterine contents (WatertUterus, kg) during gestation or in suckling piglets (WaterPiglets, kg) during lactation is also considered. Total weight of uterine contents is determined from litter weight at farrowing (Dourmad et al., Reference Dourmad, Etienne, Noblet and Causeur1997) and its water content is assumed to be 84.3% (Noblet et al., Reference Noblet, Dourmad and Etienne1990, equation
(10)). During lactation, water content of litter weight gain is fixed to 68% (Noblet and Etienne, Reference Noblet and Etienne1987, equation
(11)):


Water evaporated (kg/day) is determined from latent heat production (HeatLatent, kJ/day; equation (12)) assuming that on average 680.6 W are required to evaporate 1 kg of water/h (CIGR, 1984).

The equation proposed by CIGR (1984, equation
(13)) is used for the partitioning of total heat production between latent and sensible heat (W), according to ambient temperature (T°, °C).

Dry matter and OM excretion
The amounts of DM and OM in the excreta are calculated as the sum of the amounts in faeces and urine. The amounts of DM and OM excreted in faeces (kg) are calculated from feed intake (feed, kg) and feed DM and OM digestibility coefficients (dCdmand dCom, %; equations
(14)and
(15)).


When these coefficients are not available, they can be estimated from DE (MJ/kg), minerals (MM, g/kg) and fibre (NDF, g/kg) contents of the diet using specific equations for growing pigs (equations
(16)and
(18)) and reproductive sows (equations
(17)and
(19)) (Le Goff and Noblet, Reference Le Goff and Noblet2001; Le Goff G, personal communication).


Proteins, lipids, polysaccharides and lignin excretion
The amount of proteins, lipids, polysaccharides and lignin excreted by pigs can be estimated from the faecal digestibility of the respective dietary components. Protein excretion in faeces is estimated from faecal N, considering that all faecal N is in the form of protein (i.e. by multiplying it by 6.25).
The amount of lipids in faeces is estimated as the difference between total and digestible dietary lipids (equation (20)). This last value is, however, often imprecise for ingredients having less 5% fat. In this case, it is advised to calculate digestible lipids with the relationship proposed by Le Goff and Noblet (Reference Le Goff and Noblet2001) for both, growing pigs and sows (equation (21)).


Dietary lignin is supposed to be excreted in the faeces, whereas simple sugars and starch digestibility is assumed to be 100% (INRA-AFZ-INAPG, 2004). Polysaccharides (cellulose and hemicellulose) are then calculated as the difference between the excreted OM and protein, lipids and lignin (equation (22)), considering that amounts of other components are negligible.

N, P, K, Cu, Zn and C excretion
The calculation of N, P, K, Cu and Zn excretion by a mass balance approach has already been proposed in similar mathematical models (Aarnink et al., Reference Aarnink, Ouwerkerk and Verstegen1992; Dourmad et al., Reference Dourmad, Guillou and Noblet1992). For growing animals, retention is the difference between mineral body content at the beginning and at the end of a given period. For reproductive sows, the amounts of minerals retained in uterine contents during gestation and in the body of suckling piglets during lactation are also accounted for.
The amount of N in body tissues is determined from empty body weight (EBW = 0.96 × BW), according to an allometric relationship (Dourmad et al., Reference Dourmad, Guillou and Noblet1992) relating carcass N and lean meat content at usual slaughter weight (equation (23)).

Data from the literature were used to estimate the amount of body P with non-limiting supplies of dietary minerals (Rymarz et al., Reference Rymarz, Fandrejewsky and Kielanowski1982; Rymarz, Reference Rymarz1986; Jongbloed, Reference Jongbloed1987; Hendriks and Moughan, Reference Hendriks and Moughan1993; Mahan and Newton, Reference Mahan and Newton1995; Mahan and Shields, Reference Mahan and Shields1998; Jondreville et al., Reference Jondreville, Revy, Dourmad, Nys, Hillion, Pontrucher, Gonzalez, Soler, Lizardo and Tibau2004; C. Pomar, unpublished data, equation (24)) and Ca (Rymarz et al., Reference Rymarz, Fandrejewsky and Kielanowski1982; Rymarz, Reference Rymarz1986; Jongbloed, Reference Jongbloed1987; Hendriks and Moughan, Reference Hendriks and Moughan1993; Mahan and Newton, Reference Mahan and Newton1995; Mahan and Shields, Reference Mahan and Shields1998; Jondreville et al., Reference Jondreville, Revy, Dourmad, Nys, Hillion, Pontrucher, Gonzalez, Soler, Lizardo and Tibau2004; C Pomar, unpublished data, equation (25)). When digestible P supply is lower than the requirement for maximal retention, P retention is reduced (Pomar et al., Reference Pomar, Jondreville, Dourmad and Bernier2006). In this case, it is assumed that P retention corresponds to the supply of digestible P minus the endogenous losses (7 mg/kg BW, Jongbloed et al., Reference Jongbloed, Everts, Kemme and Mroz1999).
Similar relationships were estimated for K (Manners and McCrea, Reference Manners and McCrea1963; Mudd et al., Reference Mudd, Smith and Armstrong1969; Rymarz et al., Reference Rymarz, Fandrejewsky and Kielanowski1982; Rymarz, Reference Rymarz1986; Hendriks and Moughan, Reference Hendriks and Moughan1993; Mahan and Newton, Reference Mahan and Newton1995; Mahan and Shields, Reference Mahan and Shields1998, equation
(26)), Cu (Kirchgessner et al., Reference Kirchgessner, Kreuzer and Roth1994; Mahan and Newton, Reference Mahan and Newton1995; P.S. Revy et al., unpublished data; C. Pomar, unpublished data, equation
(27)) and Zn (Manners and McCrea, Reference Manners and McCrea1963; Kirchgessner et al., Reference Kirchgessner, Kreuzer and Roth1994; Mahan and Newton, Reference Mahan and Newton1995; Mahan and Shields, Reference Mahan and Shields1998; P.S. Revy, unpublished data, equation
(28)).

where n = 89, R 2 = 0.97.

where n = 89, R 2 = 0.95.

where n = 72, R 2 = 0.91.

where n = 54, R 2 = 0.91.

where n = 52, R 2 = 0.95.
The amounts of each nutrient excreted in faeces are calculated from their digestibility coefficients (dCX; equation
(29). Urinary excretion is then calculated as the difference between total and faecal excretion.

When N digestibility coefficient is not available, it can be estimated from DE, CP and DM contents of the diet. Specific equations are used for growing pigs (equation (30)) and reproductive sows (equation (31)), taking into account their specific digestive efficiencies (Le Goff and Noblet, Reference Le Goff and Noblet2001 and G. Le Goff, personal communication).


Proportions in urine are known to be high for K, and low for Ca, Cu and Zn, because for the later minerals absorption is regulated according to the requirements. However, few studies propose digestibility coefficients. For K, digestibilities of 90% to 95% and 97% have been measured for maize and soybean meal, respectively (Myer et al., Reference Myer, Barnett, Cornell and Combs1989). For Ca and Cu and Zn, urinary excretion corresponding to between 1% and 2% of total amount excreted are mentioned (Besançon and Gueguen, Reference Besançon and Gueguen1969; Jondreville et al., Reference Jondreville, Revy and Dourmad2003).
The amount of carbon excreted in urine and faeces is calculated from the amounts of protein (C5H7O2N)n, lipids (C57H104O6)n, polysaccharides (cellulose (C6H10O5)n and hemicelluloses (C5H8O4)n), lignin (C9H10O2, C10H12O3, C11H14O4) and urea (CON2H4) in urine and faeces. Non-organic carbon is neglected (equation (32)).

Finally, manure composition (concentrations) is easily deduced from manure volume or weight and excreted amounts.
Validation
A validation with experimental data was performed for effluent volume and N, P and DM amounts and concentrations. Internal validation was assumed for other outputs, considering they are derived from nutritional models already validated with experimental data. Validations of volume, N, P and DM excretion also constitute a more general assessment of the mass balance approach.
Volume
The model was validated by comparing its results to those available in literature. Only the studies including measurements of the volume of slurry produced and the required data to run the model were used in this section (Chosson et al., Reference Chosson, Granier, Maigne, Bouby and Mongin1988; Latimier and Chatelier, Reference Latimier and Chatelier1992; Granier and Texier, Reference Granier and Texier1993; Latimier and Pointillart, Reference Latimier and Pointillart1993; Latimier et al., Reference Latimier, Dourmad and Corlouër1993; Quiniou et al., Reference Quiniou, Noblet and Dourmad1993; Chauvel and Granier, Reference Chauvel and Granier1994; Henrich, Reference Henrich1994; Latimier et al., Reference Latimier, Pointillart, Corlouër and Lacroix1994; Albar and Granier, Reference Albar and Granier1996; Chauvel and Granier, Reference Chauvel and Granier1996; Latimier et al., Reference Latimier, Gallard and Corlouër1996; Castaing et al., Reference Castaing, Cazaux, Coudure and Tucou1997; Chauvel et al., Reference Chauvel, Granier, Jondreville and Williate1997; Valaja and Siljander-Rasi, Reference Valaja and Siljander-Rasi1998; Oliveira, Reference Oliveira1999; Paboeuf et al., Reference Paboeuf, Nys and Corlouër2000; Guingand and Granier, Reference Guingand and Granier2001; Levasseur and Texier, Reference Levasseur and Texier2001). Most of these studies concerned fattening pigs (55 experimental groups from 19 publications) and only two publications were found for each of the other production stages (post-weaning, gestation and lactation).
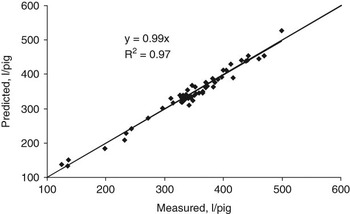
For the fattening period, model predictions of manure volume were precise and robust (Figure 2) as shown by the fact that the slope of the linear relationship between predicted and observed values was close to one and that determination coefficient (R 2) reached 0.99. The s.e. was of 12.5 l, which represents 3.6% of the observed average slurry volume (344 l/pig). For the post-weaning period, the predicted values for the two available studies (51.8 and 47.0 l/piglet) are also in agreement with the measured values (52 and 46 l/piglet). Similar results were observed for lactating sows although the volume of the produced slurry differed widely between the two studies (predicted: 1490 and 508 l/sow v. measured: 1420 and 520 l/sow). For gestating sows, the predicted volume of slurry tended to be slightly higher than measured volumes, especially in the study of Levasseur and Texier (Reference Levasseur and Texier2001) in which water consumption was extremely high.
Relationship between volume of slurry predicted by the model and measured in experimental studies (19 publications for fattening pigs, two for post-weaning, two for gestating and two for lactating sows).

Amount and concentration of N in manure
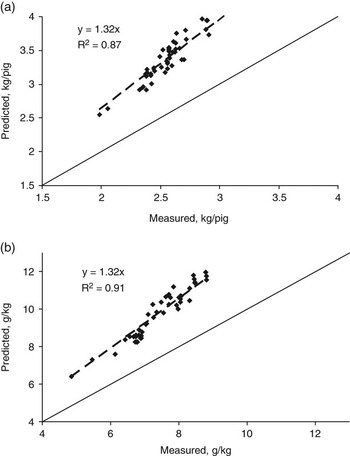
The same literature data used in the previous section were used to validate the prediction of N content in the slurry. All predicted total amounts of N in the slurry (average value 3.38 ± 0.35 kg/pig) during the fattening period were higher than the measured amounts (average value 2.56 ± 0.22 kg/pig) (Figure 3a). Such an overestimation is not surprising, because measured values in the literature were obtained from mature slurry, for which volatilisation of N compounds has already happened. The slope of the regression between predicted and measured values (1.32) enables an estimation of the proportion of N volatilised (24% of N excreted). When correcting predicted values with this coefficient, the slope of regression becomes very close to one, and the determination coefficient is high (R 2 = 0.97). The s.e. becomes 0.09 kg N/pig that represents 3.7% of the average observed value. For the same reasons, N concentration of slurry is obviously also underestimated by the model (Figure 3b). Average calculated and measured values of this parameter are of 9.41 ± 1.89, and 7.16 ± 1.33 g N/kg, respectively. When correcting estimated values with the volatilisation coefficient (24%), the slope of the regression is 0.99, R 2 is 0.95 and the s.e. 0.30 g N/kg, the later representing 4.2% of the observed average value. This good estimation indicates that the volatilisation coefficient seems relevant. However, volatilisation can vary according to several variation factors, which are discussed in the companion paper (Rigolot et al., Reference Rigolot, Espagnol, Robin, Hassouna, Beline, Paillat and Dourmad2010).
(a) Relationship between total amounts of N in the slurry predicted by the model and measured in 55 experimental groups from 19 publications concerning fattening pigs and two publications for each of the other production stages (post-weaning, gestation and lactation). (b) Relationship between concentrations of N in the slurry predicted by the model and measured in 55 experimental groups from 19 publications concerning fattening pigs and two publications for each of the other production stages (post-weaning, gestation and lactation).

Amount and concentration of P in manure
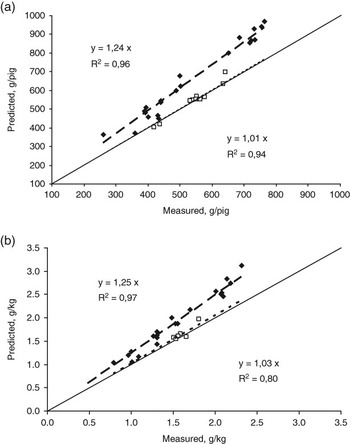
The relationships between predicted and measured values of total P excretion and concentration in the slurry are presented in Figure 4a and b. On average, predicted values are higher than observed values, in both cases by about 13% (618 ± 182 g/pig v. 537 ± 137 g/pig and 1.86 ± 0.57 g/l v. 1.46 ± 0.42 g/l, respectively). However, the correlation between predicted and observed values remains high for both the total amount of P excreted (slope = 1.16; R 2 = 0.86) and for P concentration (slope = 1.20; R 2 = 0.89). The model overestimation of P excretion cannot be explained by an underestimation of P retention in the pig’s body because this would be equivalent to 30% reduction in P retention. Moreover, values of P retention in the body are in good agreement with literature (Jongbloed, Reference Jongbloed1987; Jondreville et al., Reference Jondreville, Revy, Dourmad, Nys, Hillion, Pontrucher, Gonzalez, Soler, Lizardo and Tibau2004). Furthermore, in all studies the dietary P content was chemically determined and, therefore, the discrepancy between predicted and observed values cannot originate from an overestimation of dietary P content. Therefore, the more factual explanation of this difference between predicted and observed values is related to an underestimation of the observed amount of P in the slurry. This underestimation might result from the difficulties normally encountered for the representative sampling of pig’s manure. In fact, if only the trials in which slurry was sampled after mixing or collected in metabolic cages are considered, the predicted and observed values of P excretion are very close (547 and 545 g/pig). Furthermore, the discrepancy increases in the studies in which core sampling (i.e. no mixing) was used (532 v. 631 g/pig). Indeed, during storage, P deposits in the bottom layers of the pit and the core sampling technique would underestimate their contribution.
(a) Relationship between amounts of P in the slurry predicted by the model and measured in experimental studies (including fattening pigs, post-weaning, gestating and lactating sows). Two slurry-sampling methods are distinguished: ▪, core sampling (i.e. without mixing); □, sampling after mixing. (b) Relationship between concentrations of phosphorus in the slurry predicted by the model and measured in experimental studies (including fattening pigs, post-weaning, gestating and lactating sows). Two slurry-sampling methods are distinguished: ▪, core sampling (i.e. without mixing); □, sampling after mixing.

Amount and concentration of DM in manure
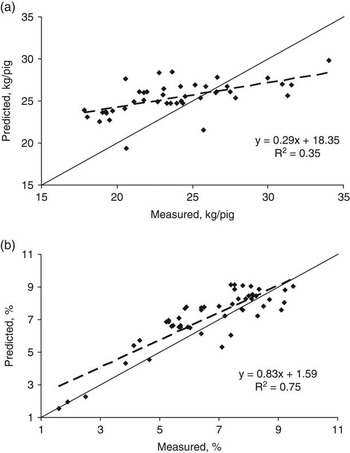
The relationship between predicted and observed values of DM amount in the slurry is presented in Figure 5a. On average, predicted total DM amount (25.4 ± 1.9 kg/pig) is higher than observed value (23.9 ± 3.8 kg/pig), and the correlation is poor (slope = 0.29, R 2 = 0.35). For the concentration of DM in slurry (Figure 5b), average predicted value is also slightly higher than the average observed value (7.51 ± 1.07 g/kg and 6.96 ± 1.42 g/kg, respectively) but the R 2 coefficient is higher than that obtained for total amount of DM, because of the good prediction of water content of the slurry (slope = 0.83, R 2 = 0.75).
(a) Relationship between amounts of dry matter in the slurry predicted by the model and measured in experimental studies (19 publications for fattening pigs, two for post-weaning, two for gestating and two for lactating sows). (b) Relationship between concentrations of dry matter in the slurry predicted by the model and measured in experimental studies (19 publications for fattening pigs, two for post-weaning, two for gestating and two for lactating sows).

The model slightly overestimates DM amount and concentration and the coefficient of determination appears lower for this prediction than those of water, N or P. A first reason for this is the conversion of OM to biogas during storage, which is not taken into account in this model, hence overestimating predicted values, and which could be quite variable, hence reducing model accuracy. Another reason could be the sampling technique, which could be not appropriate for a precise estimation of the amount of DM contained in the slurry. Considering that the approaches used for predicting P and DM are completely independent, the relationship existing between discrepancies on P and DM (R 2 = 0.37) suggests that measurements of these two parameters could be affected in the same way. Indeed, as P, DM tends to deposit in the bottom layers of the pit, which contribution would be underestimate by the core sampling technique, as previously mentioned. Thus, DM is better estimated in trials in which slurry was sampled after mixing. Furthermore, DM in the slurry is predicted from DM digestibility, which might not be precise in the simulations. However, this information is seldom available.
Simulations
In this paper, simulations focus on manure volume, nutrient concentration and to a lesser extent CH4 emission. First, the differences between physiological stages are pointed out and quantified with standard animal performances and feed characteristics (i.e. average or in accordance with current European Union regulations). Then, the sensitivity of the model outputs to animal intake, animal performances and temperature is quantified, and illustrated with the comparison of the effects of three feeding strategies on the excretion of growing pigs.
Effects of physiological status on manure volume and composition
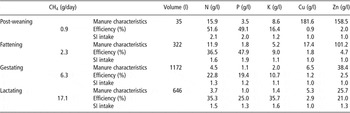
Nutrient excretion and CH4 emission by post-weaning and fattening pigs is calculated for 8 to 30 kg and for 30 to 110 kg body weight ranges, respectively. For gestating sows, the simulation is performed over 114 days, considering a net BW gain equal to 36 kg and litter weight at birth equal to 20 kg. Excretion and CH4 emission by lactating sows is estimated for a 26-day period, with a litter average daily gain of 2.3 kg and a net BW loss equal to 21 kg. Feed intake and nutrient concentration in the feed corresponds to standard values (Table 1) and ambient temperature is fixed at 25°C. CH4 emission (expressed in g/day), manure volume and composition and nutrient efficiencies (defined as the ratio retained: intake) are presented in Table 2.
Typical feed nutrient content used for the simulations (average values or in accordance with current European Union regulations)

ResD = digestible fibre.
CH4 emission and manure characteristics (calculated by the model for each physiological status with typical feed), nutrient efficiencies and sensitivity index (SI) to nutrient intake

With average parameter values, a fattening pig produces 322 l of excreta containing initially 11.9 g N/l, 1.8 g P/l and 5.2 g K/l. Slurry from post-weaning piglets is more concentrated than from fattening pigs (15.9 g N/l, 3.5 g P/l and 8.6 g K/l). However, the volume produced is much smaller (equivalent to 10.8% of the volume excreted by fattening pigs). On the contrary, excreta from gestating (4.5 g N/l 1.1 g P/l 2.0 g K/l) and lactating (3.7 g N/l, 1.0 g P/l, 1.4 g K/l) sows are much more diluted, but the volumes are greater (3.6 and 2.0 folds higher than for fattening pigs, respectively).
Nutrient efficiency is higher for post-weaning piglets than for fattening pigs and for lactating sows than for gestating sows. Compared to N, P efficiency for fattening pig is higher, whereas K efficiency is much lower, as well as heavy metal efficiency. These results are consistent with literature results (Jongbloed, Reference Jongbloed1991; Levasseur, Reference Levasseur1998; Ferket et al., Reference Ferket, Van Heugten, van Kempen and Angel2002).
Sensitivity of excreted amounts to ingested amounts, animal performance and ambient temperature
A generic approach is used to quantify the sensitivity of nutrient excretion to nutrient intake. Indeed, the model assumes that retained amounts are constant for given animal performance (when supply is non-limiting). Sensitivity analyses using a one-at-a-time approach consist in the test of one parameter at a time (the others being kept constant). A sensitivity index (SI) is defined as following:

Where Iave, I1, I2 are average, overloaded and lowered parameter values (inputs), and Oave, O1, O2 are the corresponding outputs.
The SI gives the variation of an output as a function of the variation of a related parameter. A SI = 1 indicates that the variation of a given parameter induces a variation of the output in the same proportion. For the nutrient for which a constant retention is assumed, if only animal intake vary, O2−O1 = I2−I1. If we define average nutrient efficiency (NutrientEfficiencyave) as the reference data obtained in the previous section, then comes:

For example, average N efficiency for fatteners is 36.5% (Table 2), hence SI = 1.57. This means that a variation of 10% of N intake (compared to the standard value, Table 1) results in a 15.7% variation of N excretion. SI to nutrient intake is given in Table 2. They can also be interpreted as SI to feed conversion ratio and nutrient concentration in the feed (the two components of nutrient intake), or to the precision of the knowledge of theses characteristics.
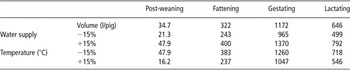
Sensitivity analysis have also been carried out for animal performance related parameters and ambient temperature. Particularly, manure volume is especially sensitive of to water intake and temperature, as reported in Table 3. This indicates that the most important information required for a precise prediction of effluent volume is the precise measurement of drinking water and the measurement of ambient temperature.
Sensitivity of manure volume to water supply and temperature

Volume is calculated by the model with typical water supplies and parameter temperature set at 25°C, and the sensitivity for both parameters is tested with overloaded and lowered values (15%).
Comparison of the effects of feeding strategies on manure volume and composition
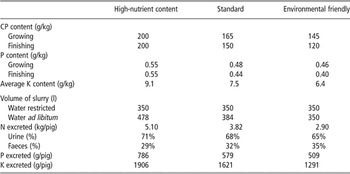
The effects of three feeding strategies, which are high nutrient content (HNC), standard (S) and environmental friendly (EF) on N and P excretion by fattening pig are compared. The HNC feeding programme corresponds to a single diet for the whole fattening period, with CP, K and P amounts corresponding to 200, 9.1 and 5.5 g/kg feed, respectively. The reduction of CP and P supplies in the S and EF diets is achieved with two-phase feeding (40% growing feed and 60% finishing feed), and the incorporation of phytase and free amino-acids. The effect of the feeding strategy on the volume and composition of the effluent is presented in Table 4. For this simulation two hypotheses of water supply are considered, because many studies have shown that water intake, when available ad libitum, increases with dietary protein concentration (Pfeiffer et al., Reference Pfeiffer, Henkel, Verstegen and Philipczyk1995; Albar and Granier, Reference Albar and Granier1996). Thus, water intake has been supposed to be either restricted (2.50 kg/kg feed) or to increase with protein supply (water/feed ratio varying from 2.50 for ⩽14% CP to 3.25 for ⩾20% CP in diet). For a controlled water supply, the amount of slurry is not affected by CP content of the diet, whereas it increases from 350 to 478 kg/pig when water is available ad libitum. Decreasing the average CP content of the diet from 20.0% to 14.0% results in a drastic decrease of the total amount of N in the slurry (43.1%), whereas N concentration is only affected (in the same proportion) when water supply is restricted. The proportion of N excreted in urine decreases from 71% to 68% and to 65% when CP supplies decreases. Compared to the HNC strategy, S and EF strategies resulted in 25% and 35% reduction of P contents in the slurry, respectively. This is in agreement with Simons et al., Reference Simons, Versteegh, Jongbloed, Kemme, Slump, Bos, Wolters, Beudeker and Verschoor1990.
Effect of three-feeding scenarios with decreasing nutrient content (single diet, two-phase feeding and two-phase feeding and the incorporation of phytase and free amino-acids) on volume and composition of slurry excreted per pig per fattening period (30 to 110 kg)

Two hypotheses of water supply are considered: restricted or ad libitum.
Discussion
This work provides original equations to predict the excretion and emissions of most compounds by pigs, taking into account the main feeding and performance related parameters. Contrary to most published models of pig excretion, this model deals with several physiological status and numerous characteristics of excreta. Indeed, the model developed by Aarnink et al. (Reference Aarnink, Ouwerkerk and Verstegen1992) allows comparable predictions as the present one, but only for fattening herds. The model proposed by Dourmad et al. (Reference Dourmad, Guillou and Noblet1992) considers all stages of production but predicts only the N flow. A more integrated model was described by Goss et al. (Reference Goss, Ogilvie and Stonehouse1999) for the prediction of liquid or solid manure produced by dairy or pig farms, but this model being less mechanistic, many important effects were not considered.
To predict nutrient excretion, the model has been constructed with a mass-balance approach. This method is a good compromise between simple and more mechanistic models, because it can be easily performed on commercial conditions, while taking the specificities of each farm into account. The partition between urine and faeces is calculated from nutrient digestibility. In order to take the specificities of animal physiological status, growing pigs and sows have been distinguished. For CH4 estimations, equations have been proposed to calculate amounts emitted as a function of energy use by the animal. Energy use also determines metabolic and evaporated water in the water balance. As for nutrient excretion, the estimations of CH4 emissions can be precisely fitted with parameters corresponding to real practices in individual farms, contrary to standard emission factors (IPCC, 2006). The model results (Table 2) could be extrapolated to estimate the annual CH4 production of sows and growing pigs (3.04 kg/year and 0.69 kg/year, respectively, with the standard parameters used in this paper).
Good predictions can be obtained for amount and volume of manure. Amounts of different components excreted by the animal are also satisfactorily addressed, the most critical being dry and probably OM. Particularly, N is quite satisfactory assessed, when corrected by a coefficient corresponding to N volatilisation. However, such a coefficient also corrects any potential proportional bias in the model. P and DM estimation seems biased, which could in fact be partly explained by inadequate sampling techniques. This demonstrates that models could be more precise than sampling and analysis, and the need to develop accurate models. However, some parts of the model (e.g. C100 excretion) have not been properly validated yet, and should be used with care. Moreover, the precision of the model outputs (excretion) not only depends on the equation’s precision, but also the precision of input parameters, such as feed characteristics.
Manure produced is contrasted between the various physiological stages, sows manure being much more abundant and diluted compared to growing pigs manure. Moreover, adult animals (sows) emit much more CH4 per day and they are less efficient for nutrient use (N, P and K).
At the farm scale, manure produced will strongly depend on the contribution of each physiological stage, and therefore on the farm type.
Sensitivity analyses help to identity key parameters to control some outputs. For example, manure volume strongly depends on temperature and water intake. Sensitivity indexes indicate that relative improvement for a nutrient (as a percentage of excreted amounts) could be proportionally easier, when average efficiency for this nutrient is low.
In the simulations proposed in this paper, three diets have been evaluated, in which nutrient reduction has been obtained by phase feeding and addition of phytase and synthetic amino acids. Phytase enzyme hydrolyses phytate P into inorganic P, thus enhancing its bioavaibility, but also Cu, Zn and Ca bioavaibility (Jondreville et al., Reference Jondreville, Revy and Dourmad2003). As illustrated by the EF feeding strategy used for the simulations, this may significantly contribute to the decrease of P intake and, consequently, of P excretion. The use of synthetic amino acids may improve N balance, which results in an important reduction of oxidation of amino acids in excess. Phase feeding consists in the introduction of one or more additional feed in order to better adapt the amounts of amino acids and digestible P in the diet to the requirements of the pigs (Pomar et al., Reference Pomar, Jondreville, Dourmad and Bernier2006).
Moreover, nutrient input reductions can be achieved by other diet manipulations (Lange et al., Reference Lange, Nyachoti and Birkett1999). Feed efficiency may also be improved by minimising feed wastage or improving feed processing (reducing particle size) (Nahm, Reference Nahm2002). Another way is to improve nutrient avaibility in the feed, by using highly digestible feed ingredients. For trace elements, a first way is to reduce safety margins, which could be still very high (Poulsen, Reference Poulsen1998). Finally, feeding management techniques, as well as genetic potential and health of animals are important to consider.
The simulations described in this paper only present a limited aspect of the numerous potentialities of the model. For example, the equations could be integrated in feed formulation by adding an environmental objective to the traditional algorithm, as proposed by Pomar et al. (Reference Pomar, Dubeau, Létourneau-Montminy, Boucher and Julien2007). Moreover, the model could be used in comprehensive approaches. For example, the relative proportions of nutrients excreted (N, P and K) could be manipulated to produce manure matching with crop requirements. Moreover, the prediction and manipulation of OM content and composition could be very useful when aerobic or anaerobic digestion is performed on the farm. Particularly, these parameters determine effluent biodegrability and CH4 production potential. Some of these examples will be integrated in a model including manure evolution (from excretion to late storage before spreading) and related NH3, N2O and CH4 emissions. Such a comprehensive model could help for precise and multi-criterion manure and nutrient management at farm level. This is described in a companion paper (part II).