

INTRODUCTION
Emotional competence includes a range of emotion-related capacities and abilities that enable an individual to deal with a changing environment such that he or she emerges as better adapted and confident. This emotional competence requires skills such as awareness of one's own emotional state, the ability to discern the emotions of others, the capacity for empathic involvement in the emotional states of others and the ability to cope adaptively with aversive or distressing emotions (Saarni, Reference Saarni1999). To adjust successfully to social life children develop this set of emotional abilities at a very early age (Denham et al., Reference Denham, Blair, DeMulder, Levitas, Sawyer, Auerbach-Major and Queenan2003). A particularly important skill is the ability to use the vocabulary of emotion, because it serves at least two purposes. First, it enables the communication of emotional experience to others, through talk about inner feelings and mental states; second, given that language is a representational system used to symbolically encode and communicate emotions, it facilitates an increased awareness and elaboration of emotional experience. Therefore, emotion language is not just a component of emotional competence; it is also a manifestation of ‘theory of mind’ (ToM), the child's growing awareness of the existence of internal states in itself and in others (Harris, Reference Harris1989; Reference Harris, Lewis, Haviland-Jones and Feldman Barrett2008).
Both cross-sectional (Dunn, Brown & Beardsale, Reference Dunn, Brown and Beardsale1991; Astington & Jenkins, Reference Astington and Jenkins1999; de Villiers & de Villiers, Reference de Villiers, de Villiers, Mitchell and Riggs2000; Adriàn, Clemente, Villanueva & Rieffe, Reference Adriàn, Clemente, Villanueva and Rieffe2005; Astington & Baird, Reference Astington and Baird2005) and training (Lohmann & Tomasello, Reference Lohmann and Tomasello2003; Hale & Tager-Flusberg, Reference Hale and Tager-Flusberg2003; Grazzani Gavazzi & Ornaghi, Reference Grazzani, Ornaghi, Arcuri, Boscolo and Peressotti2008) studies have shown that language plays a crucial role in fostering children's understanding of the mind (Milligan, Astington & Dack, Reference Milligan, Astington and Dack2007). Recent findings support the hypothesis of a bi-directional relationship between theory of mind and language (Slade & Ruffman, Reference Slade and Ruffman2005) although the effect of language on theory of mind seems to be stronger than the other way round. In addition, different aspects of language (semantic, syntactic and pragmatic) all seem to be related to theory of mind, although each of them plays a specific role (Astington & Jenkins, Reference Astington and Jenkins1999).
The relationship between language and theory of mind is well embedded in the specific type of lexicon known as mental state talk, or metacognitive language (Astington & Olson, Reference Astington and Olson1990), held to be a precursor of children's theory-of-mind development. Mental state talk includes perceptive, volitional, emotional (positive and negative), cognitive and moral terms referring to the mental states of the self and others. These different types of mental lexicon vary in terms of complexity and the stage at which they appear in children's language and in their development of a theory of mind (Bretherton & Beegley, Reference Bretherton and Beegley1982; Bartsch & Wellman, Reference Bartsch and Wellman1995). ToM requires not only an understanding of mental states such as beliefs, opinions and desires, but also an appreciation of the meaning of emotions, affect and feelings, because this is essential for effective interaction in the social world. For example, children know that an angry adult will punish or reprimand them; similarly they know how to scareoff a younger sibling or a playmate when they do not wish to share their current play activity. This conscious awareness of emotions, labelled ‘emotional theory of mind’ (Harris, Reference Harris1989; Reference Harris, Lewis, Haviland-Jones and Feldman Barrett2008; Saarni & Harris, Reference Saarni and Harris1989) is one of the principal components of the emotional competence construct. Our intervention study focused especially on the language of emotional theory of mind, and was stimulated by the findings reported in Peskin and Astington's (Reference Peskin and Astington2004) research, which investigated the role of language in the conceptual understanding of mental states.
First, the current study was carried out following a pragmatic and conversational perspective. The conversational hypothesis (Siegal, Reference Siegal2008; Hutto, Reference Hutto and Hutto2007) postulates that conversation promotes theory-of-mind development. Specifically, mental states such as desires, emotions and beliefs must be discussed and explained during interaction and conversation with other people to facilitate children's understanding of the mind. This hypothesis has been corroborated by numerous studies (e.g. Siegal, Reference Siegal1999; Reference Siegal2008; Garfield, Peterson & Perry, Reference Garfield, Peterson and Perry2001; Lohmann & Tomasello, Reference Lohmann and Tomasello2003; de Rosnay & Hughes, Reference de Rosnay and Hughes2006; Hughes, Lecce & Wilson, Reference Hughes, Lecce and Wilson2007; Tenenbaum, Alfieri, Brooks & Dunne, Reference Tenenbaum, Alfieri, Brooks and Dunne2008) focusing on the active role that children play in co-constructing with adults and peers the meaning of their experiences. Drawing on Wittgenstein's (Reference Wittgenstein1953) concept of meaning as active use, these studies showed that children extract the meanings of words and expressions from their pragmatic use in conversations (Nelson, Reference Nelson2007), namely, from their language games (Grazzani Gavazzi & Ornaghi, Reference Grazzani, Ornaghi, Brockmeier, Wang and Olson2002; Montgomery, Reference Montgomery, Astington and Baird2005).
In addition to the conversational and pragmatic hypothesis, the research design drew on a critical analysis of the interesting findings reported by Peskin and Astington (Reference Peskin and Astington2004 ). They investigated whether exposing four-year-old children to explicit mental terms in story texts led to more advanced conceptual understanding of their own and others' beliefs and/or improved comprehension and production of metacognitive language. Over a four-week training period, the children listened both at home and at school to stories containing dramatically increased numbers of terms referring to mental states (explicit training). The control group (implicit training) received the same books with no enrichment of mental states language but with most stories requiring the children to think about alternative perspectives. Although the children in the experimental group displayed significantly higher metacognitive verb production in story telling, their metacognitive comprehension did not improve significantly, while their performance on a false-belief battery improved, but not significantly more than that of the children in the control-implicit training condition (indeed they were actually outperformed by the control group on the false-belief explanation tasks).
These results prompted us to explore the effect not only of listening to stories enriched with psychological terms, but also that of playing on, and with, these terms. In other words, what happens when children are not simply ‘passively’ exposed to stories containing many words describing internal states, but also have the opportunity to ‘actively’ experiment with, and reflect on, the meaning of such words, together with other children under the guidance of an adult? Our focus, therefore, was on the role of active language games involving the use of metacognitive vocabulary within social interactions. We assumed that the active use of these terms in everyday conversations enhances children's competence in understanding internal states and the mental lexicon. This hypothesis constitutes the theoretical and methodological bases for our study, in which the active use of language was specifically encouraged; therefore the innovative feature of the current study is its use of mental-states language games in the context of group conversations.
RESEARCH AIMS AND PREDICTIONS
The present study had three aims: to examine whether, compared with a control group, training preschool children to use emotional state talk results in increased understanding of it; to investigate whether training preschool children to use emotional state talk improves their performance in an emotion comprehension test; and to analyze the results as a function of age and gender. With regard to age, the preschool period of three to five years is particularly important for the development of mental state talk and theory of mind (Bartsch & Wellman, Reference Bartsch and Wellman1995; Harris, Reference Harris, Lewis, Haviland-Jones and Feldman Barrett2008). With regard to gender, the literature on mental state talk and theory-of-mind development reports contradictory results. While some researchers found that girls were exposed to a greater number (Garner, Jones, Gaddy & Rennie, Reference Garner, Jones, Gaddy and Rennie1997; Cervantes & Callanan, Reference Cervantes and Callanan1998) and greater variety of mental terms (Kuebli & Fivush, Reference Kuebli and Fivush1992), other studies did not confirm these findings (Jenkins, Turrel, Kogushi, Lollis & Ross, Reference Jenkins, Turrel, Kogushi, Lollis and Ross2003).
It was expected that the training group would outperform the control group in the comprehension of inner state talk and in emotion understanding. Since ToM emerges between the ages of three and four, it was expected that the training would be more effective at these ages. No specific predictions were made for gender effects.
METHOD
Participants
The 100 participants (M=52 months; SD=9·9; range: from 35 to 70 months) of the study were preschool children attending three infant schools (kindergartens) located in Milan and its hinterland. Participants belonged to three age groups: 35 three-year-olds (M=41·3 months; SD=3·5; range: 35–47 months), 35 four-year-olds (M=51·3 months; SD=2·9; range: 46–57 months) and 30 five-year-olds (M=64·4 months; SD=3·5; range: 59–70 months). The data reported on the age of participants refers to the pre-test phase. At the post-test, the mean age was 57·4 months (SD=10·5). An average of 5·6 months went by from pre- to post-test.
Participants were all native Italian speakers, came from middle-class socioeconomic backgrounds, and displayed typical linguistic and cognitive development.
The children from the three age groups were randomly assigned to experimental or control conditions to make up a training and a control group of 50 participants each. There were no significant differences between the training and control groups in any of the pre-test measures administered before the training. A series of Anovas was run to compare children's performances at the pre-test as a function of group condition. The tests used are described in the section outlining the research procedure. No significant differences emerged between experimental and control groups: Age (F=0·320; n.s.; ηp2=0·003), TEC 1st level (F=0·009; n.s.; ηp2=0·000), TEC 2nd level (F=0·003; n.s.; ηp2=0·000), TEC 3rd level (F=0·181; n.s.; ηp2=0·002), TEC total score (F=0·220; n.s.; ηp2=0·002), MVT (F=0·028; n.s.; ηp2=0·000), TVL (F=0·737; n.s.; ηp2=0·007) (see section ‘Pre- and post-test measures and scoring’ below for an explanation of ‘TEC’, ‘MVT’ and ‘TVL’).
Participants were also equally divided by gender (50 males and 50 females).
Design and procedure
A training study was carried out. The independent variables were: Time (2 times: pre and post), Age (three-, four- and five-year-old children), Gender (male and female), and Group condition (experimental and control group). The dependent variables were the abilities assessed by the measures presented in the following section.
The study took place in three phases: pre-test, training and post-test. During the pre-test phase of the research, all participants were administered a range of measures assessing their language and emotion comprehension. Children completed these tests at school, in a non-classroom setting.
Between the pre- and post-tests, a 2-month intervention took place. Over this period, twice a week and in small groups of six to seven, all children were read illustrated stories enriched with emotional state talk. At the end of each story, different activities were carried out with each of the research groups. Specifically, the children in the training group took part in language games designed to elicit emotional mental state talk. Following a standard procedure using the ‘word launching’ technique (Ciceri, Reference Ciceri2001), which consists of saying a word and inviting the children to say freely what this word means to them or reminds them of, the adult repeated a sentence from the story which had just been read, and which contained the target term to be focused on in conversation during the training session.
It was explained to the children that the language game consisted of using the selected emotional term, as in the following example:
Nella frase che avete appena sentito, c'è la parola ‘spaventato’. ‘In the sentence I have just read to you, there is the word scared. Ora giocheremo con questa parola; ‘Now we are going to play with this word’; il gioco consiste nell'usare la parola spaventato. ‘the game is about using the word scared’. Se io dico spaventato, che cosa vi viene in mente? ‘If I say scared, what does it remind you of?’ Ricordate che dovete usare questa parola mentre parlate, per esempio con espressioni tipo Io mi spavento quando … ‘Remember, you have to use this word when you speak, for example with expressions like I get scared when ….’
During the conversations the researcher stimulated the children to use the target word as much as possible by means of focused questions or comments. In addition, he/she strove to involve all the participants in the conversation; and effectively all of the children made an active contribution to the conversational exchange. After about 12–15 minutes of conversation, the researcher wound up the session. The aim of the training activity with the experimental group was to give all the children in the group practice in thinking about, and using, the target mental state terms.
The children in the control group, after listening to the same story, were allowed to engage in free play and were provided with toys such as jigsaw puzzles and construction games, deliberately selected to generate as little conversation as possible about the story itself and the experiences of the story characters. Thus, the children in the control group were left free to interact and to speak and play amongst themselves, but their attention was diverted away from the content of the story just listened to.
The story book
An illustrated story book containing twelve stories was created specifically for the study; the story readings were a means of introducing the language games, which focused on the mental terms recurring in the texts. The stories displayed a ‘canonical story structure’ (Rumelhart, Reference Rumelhart, Borrow and Collins1975), that is: an introduction, the story-line (during which the protagonists cope with some problems and encounter other characters, especially antagonists) and, finally, a happy ending. The age-appropriate intelligibility and appeal of the stories were tested with preschool children who did not take part in the study. The story texts were extensively enriched with emotional state language, featuring in particular four selected emotional terms: spaventarsi ‘getting scared’, arrabbiarsi ‘getting angry’, sentirsi felice ‘feeling happy’ and desiderare ‘desiring’. This last term, though not strictly emotional in nature, was included since it is closely related to emotional experience. In fact, most of the emotional experiences of preschoolers are linked to the fulfilment or non-fulfilment of their wishes (Harris, Reference Harris1989) and use of the term ‘desire’ in conversation leads to the spontaneous production of emotional language by children. Each story highlighted one of these four terms, and each term was stressed in three different stories. For example, in the story La palla di Teo ‘Theo's ball’ the target phrase is arrabbiarsi ‘getting angry’ and the language games following the reading of the story also focused on this target phrase. The main characters in this story (as in all twelve tales) are a shark and a dolphin. The dolphin bursts the shark's ball, making the shark angry; the two friends argue and finally make up again. The story text is enriched with numerous anger semantic terms such as: sono arrabbiato ‘I'm angry’; si è infuriato ‘he flew into a rage’; deluso e arrabbiato ‘disappointed and angry’. In the story Un grande pericolo ‘A great danger’, the two friends are playing hide-and-seek when they see a fisherman with a huge fishing net. The dolphin is spaventato ‘scared’, but the shark in turn terrorizza ‘terrifies’ the fisherman who is forced to escape. In this case the story text is enriched with numerous semantic terms relating to fear such as molto spaventato ‘very scared’, egli aveva paura ‘he was afraid’, si è preso un terribile spavento ‘he got a terrible fright’.
Pre- and post-test measures and scoring
The pre- and post-tests consisted of three measures: a measure of general language comprehension, a measure of the understanding of metacognitive vocabulary, and a measure of children's emotion understanding.
Language comprehension
All participants were administered the TVL (Test di Valutazione del Linguaggio ‘Test of Language Evaluation’), an Italian language test standardized by Cianchetti and Sannio Fancello (Reference Cianchetti and Sannio Fancello1997), designed to assess the language abilities of two- to six-year-olds.
This instrument was used to verify that children in the experimental and control groups had similar levels of language competence prior to training as well as the basic language skills required to take part in the research. The TVL evaluates four different abilities: comprehension of words and sentences, repetition of sentences, naming picture cards and spontaneous speech production on a prescribed theme. In the current study, only the section on the comprehension of words and sentences was applied; this part of the test evaluates lexical knowledge and includes vocabulary for parts of the body, objects, actions and qualities. The raw scores were totalled and then converted to weighted scores (maximum score: 10).
Metacognitive verb comprehension
This test (MVT) was designed by Pelletier and Astington (Reference Pelletier and Astington1998) for three- to seven-year-old children. It consists of twelve short stories with illustrations, each followed by a question. Specifically, the child is asked to choose which of two alternative verbs better expresses the mental state of the story's protagonist (e.g. remembering vs. understanding). This study used the Italian version of the MVT (Iannello & Antonietti, Reference Iannello and Antonietti2006), for which the illustrations were re-drawn. A score of 1 was awarded for a correct choice of verb, and a score of 0 for a wrong choice, yielding total scores from 0 to 6.
Emotion comprehension
The TEC (Test of Emotion Comprehension) was administered to all participants. This test, devised by Pons and Harris (Reference Pons and Harris2000), assesses emotion comprehension in three- to eleven-year-olds and has been widely used in research including in non-English-speaking contexts (e.g. Tenenbaum, Visscher, Pons & Harris, Reference Tenenbaum, Visscher, Pons and Harris2004); the current study used the standardized Italian version (Albanese & Molina, Reference Albanese and Molina2008). In all, the child's comprehension of emotion is assessed across nine different components (Pons, Harris & de Rosnay, Reference Pons, Harris and de Rosnay2004). According to the hierarchical model proposed by Pons and Harris (Reference Pons and Harris2005), children with typical development progress through a series of landmarks in developing their emotion understanding of the nine components. The standardized Italian version of the test confirmed this hierarchical structure with few variations. At a first level (conventionally referred to as ‘external’ by Pons & Harris) children from around three to four years of age respond correctly to the group of items testing the following three components: recognition of facial expressions, understanding the impact of situational causes on emotions, and the role of desires in emotions. At a second level (conventionally termed ‘mental’), children from around four to five years of age are correct on the items assessing their understanding of the role of beliefs in emotions, the impact of memory on emotions and the distinction between outwardly expressed and privately felt emotions. Finally, at a third level (labelled as ‘reflective’), children from about eight years of age respond correctly to the items evaluating three further components of emotion understanding, namely the effect of morality on emotions, the awareness that emotions can be regulated through cognitive control strategies, and appreciation of concurrent mixed feelings. With each transition from one level to another, there is an increase in the child's ability to understand the role of the internal states (beliefs, memories and so on) in emotional experience.
The TEC assesses emotion understanding by presenting vignettes in which a gender-matched protagonist encounters simple to complex situations eliciting different emotional responses. After each vignette, the child is asked to indicate how the protagonist feels, by choosing from four illustrations of faces representing different emotional states. For each group of items testing an individual component, a score ranging from 0 to 1 is awarded. These scores are then summed to obtain an overall score for each level and finally a total TEC score, which ranges from 0 to 9. The scoring system was constructed and applied in strict accordance with the guidelines of Pons and Harris (see Pons & Harris, Reference Pons and Harris2000, Reference Pons and Harris2005, for further details).
RESULTS
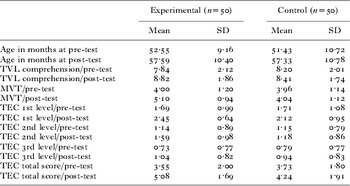
Table 1 shows descriptive statistics for all variables by group condition at both time points (pre and post). There was no significant difference between the experimental and control groups in age or in any of the pre-test measures.
Means and standard deviation of all variables by group condition (N=100)

First, a multivariate analysis of variance (MANOVA) was conducted, in which the dependent variables were the within-subject measures (TVL, MVT and TEC ) at two Time points (1=pre-test and 2=post-test). Group condition (experimental and control group), Age (3, 4 and 5) and Gender (males and females) were the between-subject independent variables. As the analyses did not yield any significant main effect or interactions for gender, this variable was omitted and a new MANOVA was carried out. Effect sizes were calculated using partial eta-squared (ηp2).
The results show significant multivariate main effects for both Age (Wilks' λ=0·512; F=4·22, p=0·001; ηp2=0·255) and Group condition (Wilks' λ=0·694; F=4·68; p=0·001; ηp2=0·306). There was also a significant Age×Group interaction (Wilks' λ=0·719; F=2·0, p=0·02; ηp2=0·150). Subsequently, in order to find out which of the dependent variables this interaction was significant for, we conducted an analysis of variance (ANOVA), with Age and Group as independent variables, for each of the following measures at two Time points: language comprehension (TVL), metacognitive vocabulary comprehension (MVT), and emotion comprehension (TEC).
For language comprehension, as measured by the TVL, the analysis yielded a significant effect of Time (Wilks' λ=0·899; F (1,96)=10·83; p=0·001; ηp2=0·101) and a significant Time×Age interaction (Wilks' λ=0·930; F (1,96)=3·6; p=0·03; ηp2=0·070). Post-hoc comparisons revealed a significant improvement in four- and five-year-olds (Tukey, p=0·01). The Time×Group interaction was not significant.
For metacognitive verb comprehension, as measured by the MVT, there was a significant effect of Time (Wilks' λ=0·839; F (1,89)=18·26; p=0·001; ηp2=0·161) and a significant Time×Group interaction (Wilks' λ=0·870; F (1,89)=14·15; p=0·001; ηp2=0·130), whereby the participants in the training group improved significantly more than those in the control group (the estimated marginal means at Time 1 and Time 2 were 4·01 and 5·09 in the training group, and 3·98 and 4·05 in the control group respectively). Furthermore, a significant Time×Age×Group interaction was found (Wilks' λ=0·939; F (1,89)=3·07; p=0·05; ηp2=0·061). Post-hoc comparisons revealed that four- and five-year-old participants in the experimental condition improved significantly more than three-year-olds (Tukey, p<0·01).
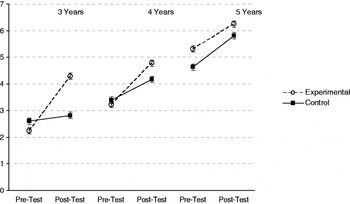
With regard to emotion comprehension, as measured by the TEC, for overall performance a significant effect of Time (Wilks' λ=0·754; F (1,93)=30·35; p=0·001; ηp2=0·246) and a significant Time×Group interaction (Wilks' λ=0·935; F (1,93)=6·44; p=0·01; ηp2=0·065) were found. Specifically, the training group (estimated marginal means: Time 1=3·59, Time 2=5·10) outperformed the control group (estimated marginal means: Time1=3·71, Time 2=4·27) on the total TEC score measure. Moreover, as shown in Figure 1, a significant Time×Age×Group interaction emerged (Wilks' λ=0·924; F (1,93)=3·82; p=0·02; ηp2=0·076); post-hoc comparisons revealed that three- and four-year-old participants in the experimental condition improved significantly more than five-year-olds (Tukey, p<0·01).
Graph showing Time×Age×Group interaction for the total score of the TEC.

In addition to analyzing overall emotion comprehension scores, the three levels of components in the hierarchical model were examined separately.
For the first level, we found a significant effect of Time (Wilks' λ=0·634; F (1,96)=55·36; p=.001; ηp2 =.366), a significant Time×Age interaction (Wilks' λ=0·931; F (1,96)=3·56; p=0·03; ηp2=0·069), a significant Time×Group interaction (Wilks' λ=0·953; F (1,96)=4·78; p=0·03; ηp2=0·047), and a significant Time×Age×Group interaction (Wilks' λ=0·939; F (1,96)=3·12; p=0·05; ηp2=0·061). Post-hoc comparisons showed that three- and four-year-old children in the experimental group improved significantly more than five-year-olds (Tukey, p<0·01).
For the second level, a significant effect of Time (Wilks' λ=0·949; F (1,96)=5·03; p=0·03; ηp2=0·051) and a significant Time×Group interaction (Wilks' λ=0·958; F (1,96)=4·03; p=0·05; ηp2=0·042) emerged. That is, the estimated marginal means at Time 1 and Time 2 were respectively 1·15 and 1·60 in the training group, and 1·15 and 1·18 in the control group.
For the third level, which included components of emotion understanding normally acquired later than age five, there was only an effect of Time (Wilks' λ=0·943; F (1,96)=5·64; p=0·02; ηp2=0·057).
DISCUSSION
Our study primarily examined the effect of a training intervention designed to make three-, four- and five-year-old children engaged in increased reflection on the meaning of inner state terms. To this end, we compared children who were invited to converse with their peers and an adult about the psychological terms featuring in stories presented to them (experimental group) with children who engaged in group play using structured materials without being encouraged to discuss the stories listened to (control group).
We obtained three main findings. First, as predicted, the training had a significant effect on children's performances in the MVT and the TEC. Second, the training effect interacted significantly with the age variable for both MVT and TEC measures. Third, no significant differences emerged as a function of gender.
With regard to the TVL, the children's performance improved as a function of time but not of training, although the experimental group did better than the control group on the post-test (see Table 1 for mean values). This result seems to imply that there is not a strong link between the use of mental states talk and enhanced comprehension of words and sentences in general.
With regard to the training effect on inner state language comprehension (MVT), the results show that four- and five-year-olds improved significantly more than three-year-olds; the MVT may have been too difficult for the latter age group as it is generally recommended for use with children aged four and over.
Finally, with regard to emotion comprehension (TEC), as hypothesized, greater awareness of emotion states language also brings about greater emotion understanding. The positive effect of the training on children's performances in the TEC shows that the conversational use of emotional state talk promotes gains in comprehension of different aspects of emotion (Pons et al., Reference Pons, Harris and de Rosnay2004). In particular, the effect was found to be significant for the components of both the first level (especially at three and four years of age) and the second level (for all age groups) of emotion understanding.
In general, the findings of this study show that the effect of training is strongest at age four. This is in line with the fact that at this age children have the basic conversational skills required to engage in discussions, they recognize the existence of mental states in themselves and others and are in the process of acquiring awareness of internal mental contents including desires, emotions and beliefs (Astington & Pelletier, Reference Astington, Pelletier, Homer and Tamis-Le Monda2005; Nelson, Reference Nelson2007). While in early childhood (between three and four years of age) the child focuses on the public, external and situational determinants of emotion and his conversational abilities are rudimentary; from four years onwards his understanding of emotion becomes increasingly mentalistic in nature (de Rosnay, Pons & Harris, Reference Harris, Lewis, Haviland-Jones and Feldman Barrett2008). This development may be enhanced by participation in language games focusing on the emotional lexicon.
The outcomes of this study could have interesting educational implications in the context of infant schools, where teachers may play a decisive role in improving internal state understanding by involving children in ‘emotion understanding conversations’. The following example of a language game (an extract from the training activity with a group of three-year-olds) illustrates how, once explicitly asked to use the target word by the adult, the children are able to play with the inner state term appropriately.
adult: Ciao bambini … , vi ricordate la storia?
‘Hi guys … , do you remember the story?’
Il delfino Jack era molto arrabbiato.
‘Jack Dolphin was really angry’.
Oggi giocheremo con la parola arrabbiarsi.
‘Today we're going to play with the words getting angry.’
Se dico la parola arrabbiarsi, che cosa vi viene in mente?
‘If I say getting angry, what does it make you think about?’
p: Io non mi arrabbio mai.
‘I never get angry.’
c: Io mi arrabbio quando mia sorella mi picchia.
‘I get angry when my sister hits me.’
v: Mia mamma si arrabbia quando io picchio mia sorella
‘My Mum gets angry when I hit my sister’
p: … quando sono arrabbiato, faccio così. [fa la faccia arrabbiata]
‘When I'm angry, I do this. [makes facial expression of anger]
v: … e quando la mia mamma si arrabbia, lei mi sgrida.
‘… and when my Mum gets angry, she scolds me.’
Broadly speaking, the research outcomes support the theoretical approach which emphasizes the crucial role of conversation about the psychological lexicon in enhancing children's understanding of the language of mind and emotion (Siegal, Reference Siegal2008). In line with the idea that the meaning of words is acquired from use, the participation in language games led the children to make active use of the emotional lexicon, thereby enhancing their understanding of mental state talk (Nelson, Reference Nelson1996). In this perspective, children would appear to acquire comprehension of this kind of language not through being simply taught it by an adult, but by virtue of using mental state terms in conversations with others. In other words, training based on this theoretical approach in which use and comprehension are held to be inextricably intertwined (cf. ‘Introduction’ for a detailed outline) is not seen as a teaching–learning activity. Rather, it is viewed as a context enabling children to extract the meanings of words and expressions from their pragmatic use in conversations (Nelson, Reference Nelson2007), that is from their language games (Brockmeier & Grazzani Gavazzi, Reference Brockmeier and Grazzani Gavazzi1999; Ornaghi, Brockmeier & Grazzani Gavazzi, Reference Ornaghi, Brockmeier and Grazzani Gavazzi2011) .
That said, it may legitimately be asked whether the results of this study were due to the conversation rich in emotional state talk or just to conversation in general. In answer, it may be contended that what sets the two groups apart is not so much, or solely, the fact of conversing per se (in fact both groups engaged in conversation, although a quantitative comparison was not carried out) but the fact of speaking specifically about the mental states of self and others (Nelson, Reference Nelson2007 ). However, to eliminate all doubt on this score, future research should be designed so as to have training and control groups produce a similar amount of conversation with the sole difference that the conversation of the experimental group would focus on emotional state talk while the conversation of the control group would not.
A further question may be raised in relation to the fact that in the experimental condition, children receive considerable attention from the adult whereas in the control condition they do not. Therefore, it could arguably be something about the attention rather than the content of what the adults say which is an important factor in enhancing theory of mind. In order to control for such an effect, the children in the control group would also need to get particular attention from the adult, who would need to act as facilitator and moderator of the children's interaction and conversations in the same way as in the experimental condition. The design would require three groups, with a system in place for taking a quantitative measure of the conversation: a training group engaging in language games, a control group with children engaging in spontaneous conversation amongst themselves, and a second control group with children engaging in general conversation under the guidance of, and receiving attention from, an adult.
To conclude, a limitation of this work is the lack of a follow-up assessment to evaluate the effects of the training over a longer time period. It is possible that the effect of the training may not be long-lasting if the adults interacting daily with the children do not continue to engage them in the active use of psychological language. In this perspective, future research could also use supplementary data from naturalistic observation of the participants to verify if there is a correlation between the improved abilities measured by the tests and the socio-emotional competences used in real-life interactions.