Introduction
Major depression is one of the leading causes of disability worldwide and a major contributor to the global burden of disease (Mathers & Loncar, Reference Mathers and Loncar2006). Depression has a particular impact on social functioning and interpersonal relationships (Papakostas et al. Reference Papakostas, Petersen, Mahal, Mischoulon, Nierenberg and Fava2004), is associated with significant social impairment (Kessler et al. Reference Kessler, Berglund, Demler, Jin, Koretz, Merikangas, Rush, Walters and Wang2003) and accounts for a 2–3-fold increased risk of onset of social disability (Ormel et al. Reference Ormel, Vonkorff, Oldehinkel, Simon, Tiemens and Ustun1999). Compared to healthy people, depressed individuals report poor intimate relationships, less supportive social networks, less active social lives and more negative, disharmonious and unsatisfactory social interactions (Brugha et al. Reference Brugha, Conroy, Walsh, Delaney, O'Hanlon, Dondero, Daly, Hickey and Bourke1982; Billings et al. Reference Billings, Cronkite and Moos1983; Fredman et al. Reference Fredman, Weissman, Leaf and Bruce1988; Hirschfeld et al. Reference Hirschfeld, Montgomery, Keller, Kasper, Schatzberg, Moller, Healy, Baldwin, Humble, Versiani, Montenegro and Bourgeois2000; Zlotnick et al. Reference Zlotnick, Kohn, Keitner and Della Grotta2000). This highlights the importance of investigating the neural substrates of social information processing in depression.
Most neuroimaging studies of social cognition in depression have examined the neural correlates of facial emotional perception (Cusi et al. Reference Cusi, Nazarov, Holshausen, Macqueen and McKinnon2012). Although these tasks involve emotion recognition, they do not involve interactive scenarios such as occur in social exchanges. In the past few years, economics, psychology and neuroscience have converged into a new discipline referred to as neuroeconomics (Glimcher & Rustichini, Reference Glimcher and Rustichini2004). The aim of neuroeconomics is to provide a theory of human behaviour revealing the neurobiological substrates that mediate decision making (Glimcher & Rustichini, Reference Glimcher and Rustichini2004). Within neuroeconomics, social interactions have begun to be examined with a combination of methods: for example, neuroimaging and game theory. Game theory consists of quantitative modelling of the behaviour of interacting ‘agents’ (Lee, Reference Lee2008). Several popular neuroeconomics tasks have been studied in healthy humans, allowing the systematic, controlled examination of social concepts, such as fairness, cooperation, trust and punishment (Fehr & Schmidt, Reference Fehr and Schmidt1999). Importantly, neuroeconomic approaches have been proposed as a promising framework for studying interpersonal functioning in psychiatric disorders (King-Casas & Chiu, Reference King-Casas and Chiu2012).
One of the most extensively studied game theory paradigms is the Ultimatum Game (UG; Guth et al. Reference Guth, Schmittberger and Schwarze1982). The UG allows investigation of behavioural and neural responses to fair and unfair social situations. In the UG, the participant (‘responder’) receives offers from other players (‘proposers’) on how to split a sum of money. In the ‘single-shot’ UG, on every trial the proposer is a different person. The participant's task is to accept or reject the offer. If the participant accepts the offer, the money is split between the two players as proposed. If the participant rejects the offer, both participant and proposer keep zero from that trial. The optimal economic solution to the UG is for the responder to accept any offer, on the grounds that any monetary amount is preferable to none. However, it is well replicated in healthy subjects that low offers (less than 20–30% of the total amount) tend to be rejected (Fehr & Schmidt, Reference Fehr and Schmidt1999). This is thought to relate to participants objecting to ‘unfairness’ (Sanfey et al. Reference Sanfey, Rilling, Aronson, Nystrom and Cohen2003). Imaging studies on healthy subjects have reported that brain regions related to processing aversive emotional information (anterior insula), cognitive conflict (dorsal anterior cingulate cortex) and cognitive control (dorsolateral prefrontal cortex) activate in response to unfair offers (Sanfey et al. Reference Sanfey, Rilling, Aronson, Nystrom and Cohen2003). By contrast, fair offers have been shown to activate reward-linked brain regions such as the striatum and the ventromedial prefrontal cortex (vmPFC) (Tabibnia et al. Reference Tabibnia, Satpute and Lieberman2008; Crockett et al. Reference Crockett, Apergis-Schoute, Herrmann, Lieberman, Muller, Robbins and Clark2013).
In the current study we used functional magnetic resonance imaging (fMRI) and the UG to investigate neural responses to social fairness and inequality in unmedicated depressed participants and healthy controls. The main hypothesis was that depressed participants would show diminished responses to increasing fairness in reward-linked brain regions such as the striatum. This was based on two lines of evidence. First, it has been shown in healthy subjects that striatal regions respond to social concepts such as fairness and trust (King-Casas et al. Reference King-Casas, Tomlin, Anen, Camerer, Quartz and Montague2005; Tabibnia et al. Reference Tabibnia, Satpute and Lieberman2008; Crockett et al. Reference Crockett, Apergis-Schoute, Herrmann, Lieberman, Muller, Robbins and Clark2013). Second, there are replicated reports that depression is associated with reduced activation in the striatum in response to rewards (Eshel & Roiser, Reference Eshel and Roiser2010; Gradin et al. Reference Gradin, Kumar, Waiter, Ahearn, Stickle, Milders, Reid, Hall and Steele2011; Zhang et al. Reference Zhang, Chang, Guo, Zhang and Wang2013). In addition, we hypothesized that depressed participants may show an increased response to social inequality in the insula and dorsal anterior cingulate, as a study on healthy subjects reported that sad mood induction can potentiate neural responses to unfairness in these regions (Harle et al. Reference Harle, Chang, van ‘t Wout and Sanfey2012).
Method
Participants
The study was approved by the local Research Ethics Committee and written informed consent was obtained from all participants. Data were acquired from a group of 25 participants meeting criteria for an episode of DSM-IV depression and from a group of 25 healthy controls. The study was advertised within the Universities of Dundee and St Andrews, UK. Potential participants were invited to apply for either the depression or the control group. Applicants were invited to a recruitment session (approximately 3–7 days before scanning) where they were screened for depression and other psychiatric symptoms using the Mini International Neuropsychiatric Interview (MINI) Plus version 5.0 and the rating scale for depressive symptoms, the Beck Depression Inventory (BDI; Beck et al. Reference Beck, Ward and Mendelson1961). Inclusion criteria for the depression group were: satisfying DSM-IV criteria for a major depressive disorder plus a score ⩽16 on the BDI and at least 3 weeks of not taking antidepressant medication. The requirement of being medication free was included to avoid a potential medication confound. Eleven depressed participants had never taken antidepressants, eight had discontinued use at least 1 year before and six had stopped at least 3 months before the study. Participants in the control group had no current or past history of depression or any other psychiatric disorder. Exclusion criteria for both groups were any neurological disorder and contraindication for fMRI. Two control data sets were excluded from all analyses, one because of a hardware failure during data acquisition and the other because of failure to believe in the UG ‘cover story’ (see paradigm description).
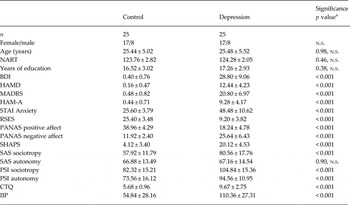
Details of the study participants are presented in Table 1. Participants in the depression and control groups were matched on the basis of gender, age, years of education and estimated pre-morbid IQ according to the National Adult Reading Test (NART; Nelson & Wilson, Reference Nelson and Wilson1991).
Participant details

NART, National Adult Reading Test; BDI, Beck Depression Inventory; HAMD/A, Hamilton Depression/Anxiety Rating Scale; MADRS, Montgomery–Asberg Depression Rating Scale; RSES, Rosenberg Self-Esteem Scale; PANAS, Positive and Negative Affect Schedule; SHAPS, Snaith–Hamilton Pleasure Scale; SAS, Sociotropy-Autonomy Scale; PSI, Personal Style Inventory; CTQ, Childhood Trauma Questionnaire; IIP, Inventory of Interpersonal Problems; n.s., no significant difference between groups.
a p values of the independent-samples t test.
Values are mean±standard deviation.
Clinical ratings
Participants were assessed for symptom severity immediately prior to scanning. All subjects completed the BDI (Beck et al. Reference Beck, Ward and Mendelson1961), the Hamilton Depression/Anxiety Rating Scale (HAMD/A; Hamilton, Reference Hamilton1959, Reference Hamilton1960), the Montgomery–Asberg Depression Rating Scale (MADRS; Montgomery & Asberg, Reference Montgomery and Asberg1979), the Stait-Anxiety scale of the Spielberger State–Trait Anxiety Inventory (STAI Form Y-1; Spielberger, Reference Spielberger1983), the Rosenberg Self-Esteem Scale (RSES; Rosenberg, Reference Rosenberg1965), the Positive and Negative Affect Schedule (PANAS; Watson et al. Reference Watson, Clark and Tellegen1988) and the Snaith–Hamilton Pleasure Scale (SHAPS; Snaith et al. Reference Snaith, Hamilton, Morley, Humayan, Hargreaves and Trigwell1995). Additionally, between the recruitment and scanning sessions, participants completed the Sociotropy Autonomy Scale (SAS; Beck et al. Reference Beck, Epstein, Harrison and Emery1983), the Personal Style Inventory (PSI; Robins et al. Reference Robins, Ladd, Welkowitz, Blaney, Diaz and Kutcher1994), the Childhood Trauma Questionnaire (CTQ; Bernstein et al. Reference Bernstein, Stein, Newcomb, Walker, Pogge, Ahluvalia, Stokes, Handelsman, Medrano, Desmond and Zule2003) and the Inventory of Interpersonal Problems (IIP; Horowitz et al. Reference Horowitz, Rosenberg and Bartholomew1993).
Paradigm
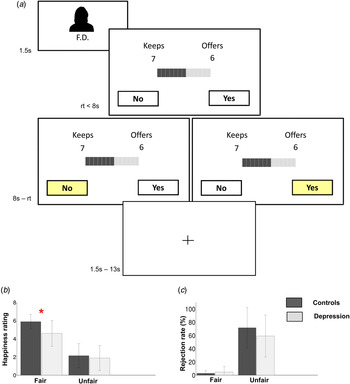
During scanning participants performed the UG task (Fig. 1 a). Before scanning, participants were instructed on how to play the UG in the responder role. Participants were told that during the game they would be presented with offers made by other players (with each player making only one offer) with regard to a split of a given amount of money. Participants had to accept or reject the offers. If they accepted, the money would be divided as proposed. In the case of rejection, both players would receive nothing on that trial. To ensure that participants would experience the game as ‘real’ social interactions, they were told that they would be playing with real people. In reality, the offers were preprogrammed. Participants were told that some of the offers were being made by players connected through a computer network while other offers had been previously made by other proposers and added to the paradigm (it would not have been believable that a large number of participants were involved in the game simultaneously). This deception was necessary to deliver a controlled task to each participant while ensuring the ecological validity of the task. Participants were told that at the end of the game they would be paid a percentage of the money they had accumulated during the game and that the other players would also be paid according to their earnings.
Experimental task, behavioural and emotional results. (a) Experimental task. On each trial participants are presented with the initials of a co-player. Subsequently, participants are presented with the co-player's offer. Participants are given up to 8 s to accept or reject the offer by pressing either the Yes or the No button. The duration of each screen is shown in seconds. rt, reaction time. (b) Happiness rating. For fair offers depressed participants reported significantly lower levels of happiness than controls. Error bars denote standard deviations and the asterisk indicates a significant difference. (c) Rejection rate. Both controls and depressed participants rejected significantly more unfair offers than fair offers with no significant differences between groups. Error bars denote standard deviations.

The set of offers was composed of ‘fair’ and ‘unfair’ offers. Fair offers were defined as a proportion from 0.38 to 0.50 of the endowment whereas unfair offers spanned a proportion range from 0.08 to 0.33 of the endowment (Crockett et al. Reference Crockett, Clark, Tabibnia, Lieberman and Robbins2008; Wright et al. Reference Wright, Symmonds, Fleming and Dolan2011). Importantly, fair and unfair offers were matched for material payoff. This means that the same amount offered to the participant could represent a large percentage of the stake size during a fair offer and a small percentage on an unfair offer. This allows investigation of the brain responses to fairness while controlling for material value (Tabibnia et al. Reference Tabibnia, Satpute and Lieberman2008). Participants played two sessions of the UG in the scanner, each session lasting about 11 min. Each session contained 28 trials of each condition (fair, unfair). The sequence of trial types and inter-trial timing variation (‘jitter’) was determined using the Optseq (http://surfer.nmr.mgh.harvard.edu/optseq/) algorithm, designed to optimize detection of the neural signals of interest.
After scanning, participants rated their emotional reaction to a subset of fair and a subset of unfair offers. The subsets contained four offers each and were matched for material utility (this means that participants were offered the same amounts on each subset of offers). For each offer, participants rated the following feelings on nine-point Likert scales: happy, angry, sad and betrayed.
After the experiment was completed, participants were debriefed regarding the cover story aspect of the task. Only subjects who believed the cover story were included in the analysis (one control participant was excluded). No participants reported negative feelings regarding the deception. After playing the UG, participants played the Prisoner's Dilemma paradigm in the scanner, the results of which will be reported elsewhere. Participants were paid according to their earnings in both games with an average of £17.
Neuroimaging analysis
For blood oxygen-level dependent (BOLD) response imaging, T2*-weighted gradient echo planar images were obtained using a 3-T Siemens Magnetom Tim Trio MRI scanner with a 12-channel head coil. A total of 37 sequential slices of thickness 3.5 mm and slice gap 0.5 mm were obtained for each volume. To minimize the susceptibility artefact, slice orientation was initially orientated parallel to the anterior commissure–posterior commissure (AC–PC) line, then rotated 30° towards the coronal plane for scanning. Two hundred and seventy-five volumes were obtained with a repetition time (TR) of 2.5 s, echo time (TE) 30 ms, flip angle 90°, field of view (FOV) 224 mm and matrix 64 × 64. The first four volumes were discarded to allow for scanner transient effects.
SPM8 (www.fil.ion.ucl.ac.uk/spm) was used for analyses. The first image from each session was aligned to the first scan of the first session. Then the images from each session were aligned to the first image of the session. The average realigned image was used to derive parameters for spatial normalization to the SPM8 Montreal Neurological Institute (MNI) template with the parameters applied to each image in the time series. The resultant time series realigned and spatially normalized images were smoothed with an 8-mm full-width at half-maximum (FWHM) Gaussian kernel.
For the first-level analysis, an event-related design was implemented with the onset of the offer modelled as delta functions as implemented in SPM. This regressor was parametrically modulated by two orthogonalized regressors, the first being the offer ‘magnitude’ and the second the offer ‘fairness’ (i.e. the proportion of the stake that is offered to the participant). This design allowed testing for brain responses to fairness, controlling for offer magnitude. Six head motion realignment parameter estimates were included as covariates of no interest. Regressors of interest were convolved with the SPM8 haemodynamic response function without time or dispersion derivatives. Beta images of regressors of interest were taken to second-level analyses and within- and between-group activations examined using one-sample and two-sample t tests.
We investigated whether brain abnormalities observed in the depression group correlated with the BDI depression severity scores and with core symptoms of depression such as anhedonia, measured using the SHAPS (Snaith et al. Reference Snaith, Hamilton, Morley, Humayan, Hargreaves and Trigwell1995). This analysis was limited to the regions that exhibited abnormalities on between-group comparisons. The dependent variable in this analysis was the mean value of the parameter estimates across voxels within a sphere of diameter 10 mm, centred at the maximum peak coordinates of the regions that showed between-group differences.
Unless stated otherwise, all analysis regions are reported as significant at a whole-brain p < 0.05 cluster level. This was achieved by a simultaneous requirement for a voxel threshold of p < 0.005 and a minimum cluster size of 92 continuous voxels. These parameters were identified using a Monte Carlo method that simulates whole-brain fMRI activation, assumes a type I error voxel activation based on the voxel threshold, smoothes the volume with a Gaussian kernel, then counts the number of voxel clusters of a given size. After running a number of iterations, the algorithm calculates a probability associated with each cluster extent, and the cluster extent threshold that yields the desired correction for multiple comparisons can be chosen (Slotnick et al. Reference Slotnick, Moo, Segal and Hart2003). This algorithm was run assuming a smoothness corresponding to a 9-mm FWHM Gaussian kernel (estimated using code available at www2.bc.edu/~slotnics/scripts.htm for the calculation of spatial autocorrelation) and 1000 iterations.
Results
Clinical ratings
Mean rating scale scores for each group are shown in Table 1. As expected, between-group t tests identified significant group differences, with participants in the depression group scoring higher in depression (BDI, HAMD, MADRS), higher in anxiety (HAMA, STAI Anxiety), lower in self-esteem (RSES), lower in positive affect and higher in negative affect (PANAS), and higher in anhedonia (SHAPS) than controls. Participants in the depression group scored significantly higher in ‘sociotropy’ (interpersonal style characterized by an intense need for positive social interactions) in the SAS and PSI, and higher in ‘autonomy’ (personality style characterized by a strong need to preserve independence) in the PSI, than controls. The CTQ scores indicated significantly higher reporting of child abuse and neglect in the depression group. Importantly, depressed participants scored significantly higher than controls in the IIP. This suggests more salient interpersonal difficulties in the depression group, consistent with the hypothesis of depression being associated with difficulties in social interactions (see Table 1 for details).
Emotional responses
After scanning, participants rated their subjective emotional reaction to fair and unfair offers (Table S1 in the online Supplementary material). For the emotion of happiness, a mixed ANOVA identified a significant main effect of fairness (F 1,46 = 154, p < 0.001), with fair offers eliciting more happiness than unfair offers, and a significant main effect of group (F 1,46 = 9.29, p = 0.004), with depressed participants reporting less happiness than controls. The interaction term was also significant (F 1,46 = 3.94, p = 0.05). Examination of simple effects indicated that this interaction was driven by depressed volunteers reporting less happiness than controls for fair offers (p < 0.001) but not differing from controls for unfair offers (Fig. 1 b). For the other emotions there was a significant main effect of fairness in all cases (anger, F 1,46 = 65.63, p < 0.001; sadness, F 1,46 = 47.69, p < 0.001; betrayal, F 1,46 = 49.95, p < 0.001), with unfair offers eliciting more negative emotions than fair offers, whereas there was no significant effect of group or interaction.
Behavioural analyses
A mixed ANOVA identified a significant effect of fairness (F 1,46 = 190, p < 0.001) on the number of offers rejected, with unfair offers showing a higher rejection rate than fair offers, as expected. There was no significant effect of group or fairness × group interaction (Fig. 1 c, online Supplementary Table S1). Regarding reaction times (online Supplementary Table S1), there was a significant effect of fairness (F 1,46 = 31.89, p < 0.001), with fair offers triggering faster responses than unfair offers, consistent with previous studies of the UG (Crockett et al. Reference Crockett, Apergis-Schoute, Herrmann, Lieberman, Muller, Robbins and Clark2013). There was no significant effect of group or fairness × group interaction on reaction times. Depressed participants and controls did not differ on their earnings during the UG (t 46 = 1.38, p = 0.18).
Neuroimaging analyses
Within- and between-group activations
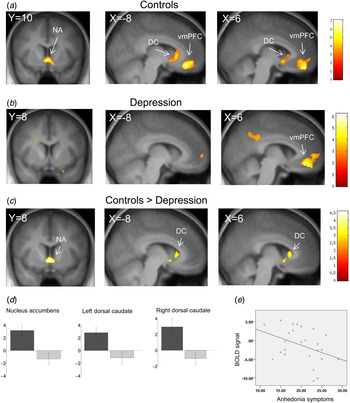
With increasing fairness (decreasing inequality), controls activated the vmPFC and a cluster extending through the nucleus accumbens and dorsal caudate (Fig. 2 a). Participants with depression also activated the vmPFC but failed to activate the striatal cluster (Fig. 2 b). This was the basis of a significant between-group difference in the nucleus accumbens [(−2, 8, −4), t = 4.61] and in the bilateral dorsal caudate [(−6, 18, 4), t = 3.42; (4, 20, 6), t = 3.47], with controls showing stronger activations for increasing fairness of offers than depressed participants in these regions (Fig. 2 c, d) (Supplementary Tables S2–S4).
Neural responses to increasing offer fairness. Neural responses to increasing fairness in (a) controls and (b) the depression group. (c) Controls exhibited greater activation than depressed participants in response to increasing fairness in the nucleus accumbens (NA) and dorsal caudate (DC). (d) Mean value of parameter estimates across voxels within a sphere of diameter 10 mm, centred at peak coordinates (−2, 8, −4) of the NA and (−6, 18, 4)/(4, 20, 6) of the left/right DC regions where depressed participants differed significantly from controls. Error bars denote standard error of the mean. (e) Correlation with anhedonia symptoms for the NA region where depressed participants differed from controls. The dependent variable is the mean value of parameter estimates for increasing fairness across voxels within a sphere of diameter 10 mm, centred at peak coordinates (−2, 8, −4). Images displayed at p < 0.005 with a cluster extent threshold of 92 resampled voxels. vmPFC, ventromedial prefrontal cortex.

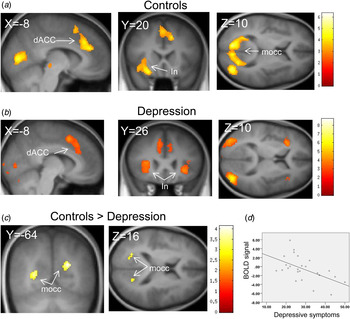
For the opposite contrast, increasing inequality (decreasing fairness), both controls (Fig. 3 a) and depressed participants (Fig. 3 b) activated the dorsal anterior cingulate and the insula, consistent with previous findings (Sanfey et al. Reference Sanfey, Rilling, Aronson, Nystrom and Cohen2003). Controls also showed activation in a bilateral region in the medial occipital cortex whereas the depression group did not. A significant between-group difference was present in the medial occipital cortex bilaterally [(−28, −64, 10), t = 3.65; (22, −64, 24), t = 4.14]. In these regions, controls exhibited stronger activation for increasing inequality than depressed participants (Fig. 3 c).
Neural responses to increasing offer inequality Brain regions active in response to increasing inequality in (a) controls and (b) the depression group. (c) Controls exhibited greater activation than depressed participants in the medial occipital lobe in response to increasing inequality. (d) Correlation with depression symptoms for the left medial occipital lobe region where depressed participants differed from controls. The dependent variable is the mean value of parameter estimates for increasing inequality across voxels within a sphere of diameter 10 mm, centred at peak coordinates (−28, −64, 10). Images displayed at p < 0.005 with a cluster extent threshold of 92 resampled voxels. dACC, dorsal anterior cingulate cortex; In, insula; mocc, medial occipital cortex.

Correlational analysis
In the nucleus accumbens region, where depressed participants differed from controls in the between-group analysis, brain activity in response to increasing fairness correlated negatively with the anhedonia symptoms for the depression group (r 25 = −0.39, p = 0.05) (Fig. 2 e). This means that the more anhedonic the depressed participant was, the lower the nucleus accumbens response to increasing fairness of offers. In the left medial occipital lobe region, where the depression group differed from controls, the response to increasing inequality correlated negatively with the BDI scores for the depression group (r 25 = −0.54, p = 0.005) (Fig. 3 d). This indicates that reduced responses to increasing inequality in the medial occipital lobe were associated with increased severity of depressive symptoms. No other correlations were found to be significant. As depressed participants and controls differed on their happiness ratings for fair offers, using a post-hoc analysis we tested for correlations between brain activity and these ratings. No significant correlation was found.
Discussion
This study investigated how depression modulates brain activity associated with social interactions using the UG. Although controls responded to increasing fairness with increasing activation of the nucleus accumbens in the ventral striatum, depressed participants failed to show this pattern. Several studies have implicated the ventral striatum in the processing of social information. Consistent with our study, two previous imaging studies in healthy subjects using the UG task showed activation in the ventral striatum in response to fairness after controlling for material value (Tabibnia et al. Reference Tabibnia, Satpute and Lieberman2008; Crockett et al. Reference Crockett, Apergis-Schoute, Herrmann, Lieberman, Muller, Robbins and Clark2013). Another study using a different social task (Tricomi et al. Reference Tricomi, Rangel, Camerer and O'Doherty2010) has also shown that the ventral striatum encodes fairness preferences. Therefore, our finding of blunted ventral striatum activation in depression in response to fairness suggests an abnormality in this population in encoding the fairness of other people's decisions.
Participants with depression also differed from controls in brain activation in the dorsal caudate. In this region, controls showed activation in response to increasing fairness while depressed participants did not. Importantly, in addition to the ventral striatum, the dorsal caudate has also been implicated in social information processing (King-Casas et al. Reference King-Casas, Tomlin, Anen, Camerer, Quartz and Montague2005). Using a different game paradigm, the ‘Trust Game’, King-Casas and colleagues found an increased response in the dorsal caudate during ‘benevolent reciprocity’ relative to ‘malevolent reciprocity’. The authors suggested that the dorsal caudate processes information related to the fairness of a social partner's decision. Thus, the findings from King-Casas et al. give further support to the proposal that the dorsal caudate abnormality identified in the present study relates to abnormal processing of social fairness information in depression.
Assuming that increasingly fair offers from a co-player can be seen as a social reward, the ventral and dorsal striatal activation in controls is consistent with studies reporting the involvement of these regions in reward processing (O'Doherty et al. Reference O'Doherty, Dayan, Schultz, Deichmann, Friston and Dolan2004; Tricomi et al. Reference Tricomi, Delgado and Fiez2004; Delgado et al. Reference Delgado, Miller, Inati and Phelps2005; Pizzagalli et al. Reference Pizzagalli, Holmes, Dillon, Goetz, Birk, Bogdan, Dougherty, Iosifescu, Rauch and Fava2009). In turn, the reduced striatal response to fairness in the depression group is consistent with studies reporting reduced striatal activation in response to rewarding events in this population (Eshel & Roiser, Reference Eshel and Roiser2010; Gradin et al. Reference Gradin, Kumar, Waiter, Ahearn, Stickle, Milders, Reid, Hall and Steele2011). The current study therefore contributes to this literature reporting that striatal abnormalities in depression extend to social rewards.
Cognitive models of depression (Beck, Reference Beck1979) posit that depressed thinking is characterized by biases in the processing of information, with depressed individuals selectively attending to and encoding negative events, filtering out positive information (Disner et al. Reference Disner, Beevers, Haigh and Beck2011). This process may decrease experience of positive emotions during a pleasurable event, a phenomenon sometimes referred to as positive blockade (Disner et al. Reference Disner, Beevers, Haigh and Beck2011). In agreement with this view, in the present study depressed participants reported decreased levels of happiness in response to fair offers. The observed abnormal striatal response to fairness in depression may represent a neural mechanism underlying deficient processing of rewarding social information. Consistent with this, in the nucleus accumbens of depressed participants decreased responses to increasing fairness of offers correlated with increased severity of anhedonia symptoms. This suggests that a blunted nucleus accumbens response to positive social interactions may contribute to the typical anhedonia symptoms of depression. It is possible that the striatal abnormality in depressed participants also relates to the low self-report levels of happiness in response to fair offers; however, a correlation was not found.
Brain activity in participants with depression also differed from controls in the medial occipital lobe. In this region, controls showed stronger activation for increasing inequality than depressed participants. In the depression group, this abnormality correlated with increased severity of depressive symptoms suggesting an illness effect. It has recently been reported that patients with schizophrenia show abnormal activation in occipital lobe regions associated with early visual processing of social information, which may contribute to higher-order social cognitive deficits in schizophrenia (Bjorkquist & Herbener, Reference Bjorkquist and Herbener2013). It is therefore possible that the occipital lobe abnormality in the present study may reflect a similar abnormality in depression, with regard to the early stages of processing social information. In particular, it could suggest an effect of attentional disengagement with aversive social cues, although depressed participants showed similar activations in response to unfairness (i.e. activation in the dorsal anterior cingulate and insula) to those reported in previous studies of the UG in non-depressed subjects (Sanfey et al. Reference Sanfey, Rilling, Aronson, Nystrom and Cohen2003). Further work is needed to clarify the implications of the medial occipital lobe finding.
Although the findings in the striatum are in agreement with our predictions, we did not find evidence for an increased response to inequality in depression, in regions such as the insula and dorsal anterior cingulate, which have been reported to have enhanced activation in response to unfairness during the induction of sad mood in healthy subjects (Harle et al. Reference Harle, Chang, van ‘t Wout and Sanfey2012). This may be due to sad mood induction in healthy subjects engaging different brain mechanisms than depressed mood. Alternatively, recruitment of more severely depressed patients might allow identification of inequality linked abnormalities in the insula and dorsal anterior cingulate.
Although the image analyses identified neural differences between depressed participants and controls, the behavioural analyses did not detect between-group differences in rejection rates during the UG. Previous behavioural studies have used the UG to investigate decision making in the context of depression. Overall, results have been inconsistent, with studies reporting increased, decreased or unchanged rejection rates to unfair offers in depressed populations (Harle et al. Reference Harle, Allen and Sanfey2010; Destoop et al. Reference Destoop, Schrijvers, De Grave, Sabbe and De Bruijn2012; Scheele et al. Reference Scheele, Mihov, Schwederski, Maier and Hurlemann2013). One study reported that depressed patients rejected significantly more unfair offers than controls, possibly due to an enhanced negative emotional response to unfairness in depression (Scheele et al. Reference Scheele, Mihov, Schwederski, Maier and Hurlemann2013). By contrast, another study found that whereas depressed participants reported a more negative emotional reaction to unfair offers, they accepted more unfair offers than controls (Harle et al. Reference Harle, Allen and Sanfey2010). Similarly, it has been observed that anxious patients accept significantly more unfair offers than controls (Grecucci et al. Reference Grecucci, Giorgetta, Brambilla, Zuanon, Perini, Balestrieri, Bonini and Sanfey2013). One proposed explanation for this set of results is that a heightened need for positive social interactions, difficulties in the management of interpersonal confrontation and low assertiveness may lead people with depression and/or anxiety to less rejection in the UG paradigm (Grecucci et al. Reference Grecucci, Giorgetta, Brambilla, Zuanon, Perini, Balestrieri, Bonini and Sanfey2013). Finally, one study found no significant difference in rejection rates between depressed patients and healthy controls during the UG (Destoop et al. Reference Destoop, Schrijvers, De Grave, Sabbe and De Bruijn2012), as in our study. Overall, these findings show that the effect of mood on UG decision making can be complex. Future studies could investigate whether depression subtypes show more consistent behaviour patterns during the UG.
Possible limitations of the study include recruitment of a university sample, which may limit the generalizability of the results. However, this recruitment method was chosen to facilitate recruitment of unmedicated participants, avoiding a possible medication confound.
In summary, using a neuroeconomic approach, this study investigated the hypothesis that unmedicated, depressed participants would differ from healthy controls in the neural processing of social interactions. Importantly, depressed participants reported experiencing lower levels of happiness during fair offers and exhibited diminished activation in the nucleus accumbens and dorsal caudate in response to increasing fairness of offers, with the abnormality in the nucleus accumbens correlating with increased levels of anhedonia. These findings suggest that the nucleus accumbens and the dorsal caudate may be linked to impairments in experiencing positive social interactions in depression. This could reflect part of the neural substrates of the social withdrawal and interpersonal difficulties that are characteristic of this population.
Supplementary material
For supplementary material accompanying this paper visit http://dx.doi.org/10.1017/S0033291714002347.
Acknowledgements
We thank C. Matthews, M. Stirling, C. Adams and F. Grant for their support with obtaining ethics approval, the recruitment and data management. We also thank the staff from the Advanced Intervention Service (AIS) for valuable discussions regarding the study design. Finally, we thank all the participants in this study. This study was funded by the University of Dundee, the Scottish Mental Health Research Network, Dr Kathleen White's Clinical Neuroscience Research Endowment Fund and a postdoctoral fellowship from the National Agency for Investigation and Innovation (ANII), Uruguay to V.B.G. The funding sources had no role in the design and conduct of the study; collection, management, analysis, and interpretation of the data; and preparation, review, or approval of the manuscript.
Declaration of Interest
K.M. has chaired advisory boards for studies of deep brain stimulation for obsessive–compulsive disorder sponsored by Medtronic. He has received educational grants from Cyberonics Inc. and Schering-Plough, and research project funding from Merck Serono, Reckitt Benckiser, Lundbeck and St Jude Medical. He has received travel and accommodation support to attend meetings from Medtronic and St Jude Medical. J.D.S. has received research funding through an honorarium associated with a lecture from Wyeth and an unrestricted educational grant from Schering-Plough.