

Introduction
The third wave of democratization reached East Asia around a decade after the second wave in Southern Europe. This wave of democratization has transformed single party authoritarian systems in the region into democracies (Diamond, Reference Diamond, Mietzner and Aspinall2010; Shin, Reference Shin2011). The seven countries include Indonesia, Mongolia, South Korea, Taiwan, Cambodia, the Philippines, and Thailand (Shin, Reference Shin2011). At the institutional level, democratization refers to the extent to which authoritarian structures transform into democratic ones and become accountable to the citizenry (Dahl, Reference Dahl1998). However, at the citizen level, it is the extent to which citizens become convinced that democracy's superiority constitutes democratic change (Shin, Reference Shin2011: 6). While democratic reforms may take place within institutions, what citizens think about democracy and their reactions to its institutions is fundamental to an effective functioning democracy.
Reforms underpinning newly democratizing countries will matter little if citizens do not support their country's democratization (Shin, Reference Shin2011). For this reason, there is a growing literature in third wave democracies that emphasizes that democratization is incomplete unless support for democracy is unqualified among the majority of citizens (Chu et al., Reference Chu, Diamond, Nathan and Shin2008; Norris, Reference Norris1999, Reference Norris2011; Rose et al., Reference Rose, Mishler and Haerpfer1998; Shin, Reference Shin2011). In this article, we conduct a comparative analysis of attitudes towards democracy in Indonesia and Malaysia – two countries with a not dissimilar history and much in common, including ethnic and religious diversity, large Muslim, Hindu, and Christian communities, a shared language, and well-established cross-border migration pathways. In both countries, a significant majority of the population have lived most of their lives under authoritarian rule.
Democracy around the world in both democratic and non-democratic countries has an appealing image among the broader public because of its notions of freedom and independence. However, according to Dalton (Reference Dalton2014), even if citizens see democracy as a positive feature, political elites do not want to yield power. Therefore, elections are often held to give the appearance of democracy without the threatened loss of power to elites. In newly democratizing countries, the public is often supportive of democracy, but often view democracy differently to how it is perceived in established democracies. Norris (Reference Norris2014), for example, argues that citizens in newly democratic countries are often likely to think of democracy in terms of prosperity, peace, and stability.
In the early phases of democracy, citizens place a great deal of hope in democracy to bring about changes. However, the enthusiasm for democracy can turn sour if governments struggle to make real genuine change in terms of elections and accountability, economic stability, and government efficiency. It is suggested that a government's struggle to meet these expectations is one of the main reasons why a democracy may be floundering. According to the 2014 Freedom of the World Report by Freedom House, there have been large setbacks to democratic rights with up to 54 countries, including Indonesia and Malaysia, which showed overall declines in political rights and civil liberties (Freedom House, 2014). In particular, Indonesia's status as a ‘free’ country reverted to ‘partly free’, mainly because of its restrictions on the activities of non-governmental organizations (Freedom House, 2014). This article draws on data from the AsiaBarometer to compare attitudes towards democracy in Indonesia and Malaysia during the first years of the twenty-first century when hopes for democratic progress were high. This article argues that during this period, satisfaction with democratic reforms may not have been as high as is often assumed, thus questioning whether the effect of a recession is over-stated.
Democracy in Indonesia and Malaysia
Before examining attitudes towards democracy among Indonesians and Malaysians, we briefly examine the state of democratic reforms in Indonesia and Malaysia as a background to our analysis. First, it is first important to define what we mean by democracy. There are many different ways to define democracy. Typologies of democratic systems often distinguish types of democracy according to their position on a continuum between different principles of democracy. These principles are often divided into opposing pairs of democratic concepts such as liberty versus equality, small versus big government, pluralism versus the common good, and individualism versus collectivism (Thomassen, Reference Thomassen, Dalton and Klingemann2007). Fuchs and Klingemann (Reference Fuchs and Klingemma2002) observe that people in different parts of the world prefer different types of democracy, located along this continuum. In most cases, differing normative positions are provoked by tensions between the freedom of individuals on the one hand and the demands of the community on the other (Fuchs and Klingemann, Reference Fuchs and Klingemma2002).
Indonesia has witnessed significant political transformation since 1998, triggered by the sudden and unexpected fall of not only Suharto's presidency but also his authoritarian regime. Embracing the spirit of reformasi, Suharto's presidential replacement, B. J. Habibie, lifted constraints on press freedom and on the rights for Indonesians to form political parties (Liddle, Reference Liddle and Liddle2001). In 1999, genuinely democratic elections were held, which were the first democratic elections since 1955. In addition to these significant reforms, Indonesia began to implement one of the world's largest decentralization programs (Mietzner and Aspinall, Reference Mietzner, Aspinall, Mietzner and Aspinall2010). Following the introduction of these major institutional reforms in such a short period of time, Freedom House promptly classified Indonesia as an ‘electoral democracy’.
Over the following decade, Indonesia's democratic progress strengthened and improved on a number of fronts. Indonesia's legislative branch of its political system, the People's Consultative Assembly or the MPR,Footnote 1 approved a number of important constitutional amendments. First, the assembly handed over its right to elect Indonesia's President and Vice President to the people. The new rules stated that candidates must not only win half the popular vote but also at least 20% of the vote in each of the provinces. If this is not possible, a second election is held. Second, in 2004 in the People's Representative Council (Dewan Perwakilan Rakyat DPR), for the first time, all 550 seats were popularly elected (Malley, Reference Malley2003).
During the same period, Indonesia also made significant improvements in party political competition. In the preceding New Order period, only a handful of parties were allowed to compete, including the pro-government Golkar, the Muslim PPP (Partai Persatuan Pembangunan), and the nationalist PDI (Partai Demokrasi Indonesia), the latter which gave birth to a breakaway party, PDI-P (Partai Demokrasi Indonesia – Perjuangan). However, in the 2009 national elections, in the DPR 38 parties contested and nine parties were able to reach the electoral threshold of 2.5% needed to be represented in the DPR (Sukma, Reference Sukma, Mietzner and Aspinall2010). Ultimately, among other things, the emergence of institutional reforms helped curb military power and marginalize the voices of Indonesia's extremist fringe, namely hardline Muslim groups (van Klinken, Reference Van-Klinken2007; Mietzner, Reference Mietzner2009). The gradual decline of military power in Indonesia has also been linked to its loss of legitimacy following revelations of its role in the violence associated with the fall of Suharto, coupled with its closely related inability to secure ongoing Western funding or support. On the other count, hardline Muslim groups have certainly received their fair share of national attention, and have been widely criticized and condemned by Indonesia's secular press and Muslims that are more liberal alike. This trend, it can be argued, is as much a symptom of Indonesia's free press as it is an indication of democratic political reforms.
In contrast to Indonesia, Malaysia has made less progress in democratic reforms. Traditionally, Malaysia is a largely administrative state, which emphasizes political dominance and autonomy from society. The ruling Barisan National (BN) coalition and its most influential party, the United Malays National Organization (UMNO), have dominated Malaysian politics since the 1970s. The fact that UMNO has dominated parliament by continually retaining a majority suggests that UMNO is fully orchestrating the ‘rules of the game’ (Ahmad, Reference Ahmad and Ahmad1987). While Malaysia has made less progress in terms of institutional reforms, over time Malaysia has had more success in social welfare outcomes than Indonesia.
The social indicator of infant mortality is often viewed as a measure of whether a regime is responding to its citizens. In this regard, Indonesia's performance on social indicators lags well behind other countries in the region, including neighbouring Malaysia. In Indonesia, the under-five mortality rate is 39 per 1,000 births. However, in Malaysia, the under-five mortality rate is only six per 1,000 births (see UNDP, 2011). Figure 1 below shows that since the 1970s, Malaysia has witnessed a significant decrease in the percentage of the population living in poverty, declining from 49% in 1970 to only 4% in 2009. Much of this was achieved as a result of the National Economic Policy (NEP), an affirmative action policy for Malays and Indigenous communities launched in 1971. Economic reforms have also helped to reduce poverty among Chinese and Indian citizens. For Indians, poverty declined from 39% in 1970 to 3% in 2009, and for the Chinese, poverty declined from 26% in 1970 to only 1% in 2009.
Incidence of poverty by ethnicity, Malaysia, 1970–2009 Source: Economic Planning Unit and Department of Statistics, Prime Minister's Department, Malaysia, 2011.

While much progress had been made, overall, democratic stability depends not only on institutional reforms, such as those discussed, but also on robust public support for democracy among everyday people (Diamond, Reference Diamond, Mietzner and Aspinall2010). While there are many reforms that take place at the institutional level, ordinary people may experience the current state of politics very differently. Therefore, in the next section, we take a closer look at public attitudes towards democracy and governance in Indonesia and Malaysia. To do a comparative analysis of public attitudes towards democracy in Indonesia and Malaysia, we use three sets of cross-national public opinion surveys that include Indonesia and Malaysia. These include the 2007 AsiaBarometer Survey (ABS), the fifth wave of the World Values Survey (WVS) conducted between 2005 and 2008, and the 2010 Transparency International Global Corruption Barometer. The surveys enabled an exploration of attitudes towards democracy in terms of (a) support for the democratic regime, (b) government performance, and (c) satisfaction with liberal democratic rights.
Support for democracy
This section uses the 2007 AsiaBarometer Survey (ABS) to examine public support for democracy. The ABS is a respected international survey, highly valued by social scientists in political science. The survey contains a range of items, which measure mass political attitudes towards democratization and governance. The sample sizes include 1,000 respondents from Indonesia and 1,000 respondents from Malaysia, which allows for a cross section of respondents from diverse cultural and socio-economic backgrounds.
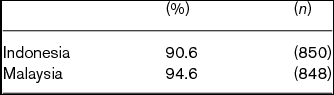
The underlying basis of the following analysis is the premise that it is generally understood that a democratic regime must be based on the consent of the people (see Lipset Reference Lipset1959). This section first explores whether people are generally supportive of the idea of a democratic political system. The AsiaBarometer asks respondents ‘Please tell me how satisfied or dissatisfied you are with the democratic political system?’ Respondents are asked to evaluate democracy on a scale of 1 to 5, where 1 is ‘very dissatisfied’ and 5 ‘is ‘very satisfied’. Table 1 demonstrates that over 90% of respondents in Indonesia and Malaysia indicate that a democratic system would be either ‘good’ or ‘fairly good’ for the country. In this sense, Indonesian and Malaysian citizens are similarly supportive of their system of democracy.
Support for a democratic political system in Indonesia and Malaysia
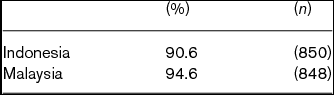
Note: The question was: ‘Please indicate for each system whether you think it would be good, fairly good or bad for this country: (a) governance by a powerful leader without the restriction of parliament or elections; (b) military government; and (c) a democratic political system. Estimates include [good] and [fairly good] for (c) a democratic political system.’
Source: 2007 AsiaBarometer Survey (N=2000).
The belief that democracy is preferable to all of its alternatives is regarded as the most important indicator of democratic political orientations (Linz and Stepan, Reference Linz and Stepan1996). It is often the case that citizens may often embrace democratic and authoritarian political systems concurrently (Shin and Tusalem, Reference Shin and Tusalem2007). Therefore, in order to take this into consideration, it is argued that genuine support for democracy involves not only the acceptance of democracy as a political system but also a rejection of its alternatives (Linz and Stepan, Reference Linz and Stepan1996; Shin and Tusalem, Reference Shin and Tusalem2007). Figure 2 below shows the percentage of respondents who stated that they were supportive of a democratic political system and rejected authoritarian alternatives. The results show that a high proportion of Indonesians still appeared to have some affiliation or respect for non-democratic regime types. Only 24% of Indonesians reported that they both supported a democratic regime and at the same time said that it was bad to have a government run by a powerful leader with no parliament or elections or a military government.
Support for a democratic regime and rejection of alternatives Source: 2007 AsiaBarometer Survey (N = 2000).
In Indonesia, the AsiaBarometer findings show that there is still considerable support for a military government with up to 58% of the population stating that a military government would be ‘good’ or ‘fairly good’. With this in mind, if we remove those who reported in the AsiaBarometer as still having some support for the military, we can see in Figure 3 below that attitudes towards democracy as a political system are relatively similar in Indonesia (51%) and Malaysia (58%).
Support for democratic regime and rejection of alternative (without supporters of military regime) Source: 2007 AsiaBarometer Survey (N=2000).
These findings are unexpected and, in the Indonesian context at least, unprecedented. What may explain these findings? First, it is possible that older Indonesians who were raised and educated under the former non-democratic regime may still have some level of support for the military, even if not necessarily for a ‘military government’. For many older Indonesians at the height of their career during the New Order regime, the economic benefits associated with social and political stability outweighed the negatives of living and working under an authoritarian regime. Older Indonesians have also witnessed substantial economic growth and poverty reduction over time.
Second, post-authoritarian Indonesia, with its ongoing process of democratic consolidation, has experienced a great deal of social and economic turmoil, with high unemployment and political instability. In addition to this, following the fall of Suharto, outbreaks of communal (ethnic and religious) violence resulted in the loss of nearly 10,000 lives (van Klinken, Reference Van-Klinken2007). There are claims that communal violence in West Kalimantan, Maluku (Ambon), Central Sulawesi (Poso), North Maluku, and Central Kalimantan may have claimed more lives than any other type of violence in Indonesia during Indonesia's post-New Order transition (see van Klinken, Reference Van-Klinken2007).
A third explanation is perhaps the long-term influence of the military in Indonesia. In general terms, the military has long been involved in economic activity, the building of national infrastructure, family planning and public health, management of sports, education in rural and remote areas, and disaster relief (Mietzner, Reference Mietzner2009). In a rigid social stratification system, the military has often provided the only way in which the poor may ever be able to climb up the social ladder and is one of the closest ways in which citizens become connected with the state. The military therefore is instrumental in providing emotional ties between citizens and the state. Similar findings have been found in other countries where the military has played an important role in connecting citizens with the state.
While most argue that the military has largely withdrawn from having any influence in politics (Kingsbury, Reference Kingsbury2003; van Klinken, Reference Van-Klinken2007; Mietzner, Reference Mietzner2009), there is still some debate about the extent of the role of the military in Indonesian politics. For instance, Tomsa (Reference Tomsa2008) has argued that the influence of the military in politics or the lack thereof, is difficult to estimate. This is mainly because it is has not been clear to what extent the military have attempted to influence internal decision-making in key political parties, such as Golkar. Meanwhile, in a study of military politics, Honna (Reference Honna2003) concludes that while the relative decline of the military in politics has been one of the most important developments in regime change in Indonesia, the military still appears to play a critical role in influencing the pace and degree of democratic reforms.
Attitudes towards government performance
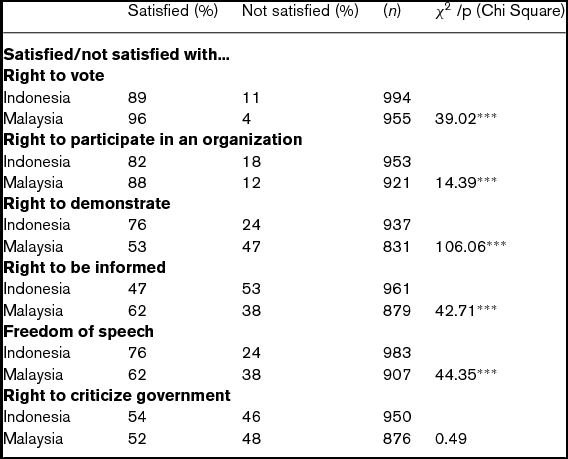
In Democratic Theory Revisited, Satori (Reference Satori1987) argues that positive attitudes towards democracy often depend on leadership and performance. Previously, we demonstrated that institutional attempts have been made to show democratic progress in Indonesia and Malaysia. Notwithstanding these significant institutional reforms, less is known about what everyday citizens think about these reforms, particularly in relation to freedom and the right to criticize government. Table 2 below reports that a much higher percentage of Indonesians compared to Malaysians feel satisfied with the right to demonstrate and the right to freedom of speech.
Satisfaction with liberal democratic rights (%)
Notes: 1: The question was, ‘How satisfied are you with the current scope of the following rights in your country? (a) right to vote, (b) right to participate in any kind of organization, (c) right to gather and demonstrate, (d) right to be informed about the work and functions of government, (e) freedom of speech (f) right to criticize government.’
χ2 = Pearson Chi-Square p < 0.05*, p < 0.01**, p < 0.001***. Estimates for ‘satisfied’ include [very satisfied] and [satisfied]. Estimates for ‘dissatisfied include ‘very dissatisfied’ and ‘dissatisfied’.
Source: 2007 AsiaBarometer Survey (N = 2000).
In Indonesia's case, since the fall of the New Order regime and the crumbling of censorship, Indonesia's media market has expanded exponentially, in ways and directions that the government has often found impossible to control (Tapsell, Reference Tapsell2012). In the decade following Suharto's resignation, Indonesia has experienced a great deal of press freedom and for many working in the media and politics, freedom of expression has been regarded as a fundamental element of democratization. Thus, the right to freedom of speech has been vigorously upheld, explaining Indonesian satisfaction with the right to freedom of speech and the associated freedom to demonstrate. The fact that the government is inclined to ignore criticism perhaps explains why Indonesians are dissatisfied about the right to criticize the government.
Malaysians appear to be as equally dissatisfied as Indonesians regarding their right to criticize government. In Malaysia, the so-called reformasi era since the late-1990s Asian financial crisis has not led to the breakdown of state censorship and the opening-up of the freedom of expression and the right to demonstrate. In terms of the right to criticize government, while Indonesia has made substantial progress it appears that the public are still concerned about this liberal democratic right. Only 54% of Indonesians feel satisfied with the right to criticize government, while only 52% of Malaysians feel satisfied.
Overall, when comparing Indonesia and Malaysia, the findings in Table 2 reveal that while in Indonesia there is still a general level of dissatisfaction with how well the current political system is handling liberal democratic rights, Indonesians report a slightly higher level of satisfaction with democratic rights. These include the right to demonstrate and freedom of speech, which may be a direct consequence of a number of reforms to media censorship that, as we mentioned above, took place shortly after the fall of Suharto. Indonesians are also more satisfied with the right to demonstrate which may have to do with the gradual removal of the military from political affairs. Malaysia's authoritarianism has resulted in just under half the population not satisfied with the right to demonstrate and criticize government. The main findings show that nearly all Indonesians and Malaysians are supportive of democracy in principle, but there is still dissatisfaction with a number of liberal democratic rights.
The legitimacy of democracy also comes into question when the public is dissatisfied with how well institutions are performing (Satori, Reference Satori1987). In looking at the findings in Figure 4 below from the World Values Survey, it can be seen that Indonesians have a lower level of confidence than Malaysians in their national institutions. Only 31% of Indonesia's public has confidence in political parties and 39% have confidence in the parliament.
Confidence in state institutions (%) Note: The question was, ‘I am going to name a number of organizations. For each one, could you tell me how much confidence you have in them: is it a great deal of confidence, quite a lot of confidence, not very much confidence, or none at all?’ Source: 2005–2008 wave World Values Survey. Estimates include: ‘A great deal’ or ‘Quite a lot’.
Research shows that political parties in Indonesia lack organizational coherency and continually involve themselves in illicit fundraising activities (Tomsa, Reference Tomsa2010). New reforms have meant that state funding has declined and there is now more involvement of big businesses and what is often referred to as ‘money politics’. The downside to this is that illicit fundraising activities undermine support for political parties in Indonesia, which cannot fall back on any stable institutional bases of support. For example, religion, region, and social class do not appear to have any effects on party identification. Instead, voters rely heavily on party leadership (Mujani and Liddle, Reference Mujani, Liddle, Mietzner and Aspinall2010). The combination of the increasing ‘personalization’ of Indonesian politics, with its almost obsessive focus on leaders, coupled with weak party identification may have a number of negative implications for democracy (Mujani and Liddle, Reference Mujani, Liddle, Mietzner and Aspinall2010).
When comparing Indonesia and Malaysia on perceptions of government, it is important to remember that in authoritarian countries, citizens are not used to openly criticizing government institutions. For this reason, this comparison needs to be interpreted with caution. Indonesians for example had high expectations of democracy after the fall of Suharto and thus low confidence may have more to do with new demands and unmet expectations (see Norris, Reference Norris2011). It is this general dissatisfaction with democracy that generally constitutes a challenge to representative democracy, a trend not unique to Indonesia.
In terms of government performance and the quality of democracy, one of the biggest concerns for Indonesia and Malaysia is the persistence of corruption in political parties and in institutions. Corruption is defined as the ‘misuse of public power for private gain’ (Rose-Ackerman, Reference Rose-Ackerman1999). The problem with corruption is that it impinges on democratic progress and political development. Under Sukarno's Guided Democracy (1955‒1965) and Suharto's New Order regime (1966‒1998), there was widespread official mogul corruption. Patronage characterized the Guided Democracy and corrupt practices generated profitable levels under the New Order regime. In addition to this, this latter period was characterized by a growth in military-run businesses (Mietzner, Reference Mietzner2009). After such a long period of systemic corruption, the results may simply reflect a sense of disappointment or frustration.
There is no doubt that corruption is ubiquitous in Indonesia. On world indicators, Indonesia is in the bottom third when it comes to controlling corruption (Diamond, Reference Diamond, Mietzner and Aspinall2010). In Figure 5 below, results from Transparency International show that over 50% of Indonesians perceive widespread corruption in political parties, parliament, and in the police force.Footnote 2 The Indonesian mass media features regular and in-depth accounts of new corruption scandals involving parliamentarians, police officers, and senior officials (Diamond, Reference Diamond, Mietzner and Aspinall2010). Not surprisingly, therefore, just under half the population in Indonesia believe that civil servants and the judiciary are corrupt.
Perceptions of corruption within national institutions (%) Source: 2010 Transparency International Global Corruption Barometer. Estimates include 4 and 5 in a scale of 1–5 where 1 is not at all corrupt and 5 is ‘extremely corrupt’.
In Malaysia, the perception of corruption is very high for political parties (67%) and the police force (74%). In Malaysia, one of the reasons the ruling BN coalition suffered significant losses in the 2008 election was due to widespread perceptions of corruption. In response to persistent perceptions of corruption and the failure to guarantee human rights, the rule of law and an independent judiciary, Malaysia's opposition parties have gained significant strength in the last few years. While the ruling BN is a formal coalition, the Pakatan Rakyat is an informal coalition of opposition parties comprising the Pan-Malaysian Islamic Party or Parti Islam Se-Malaysia (PAS), Parti Keadilan Rakyat (PKR), and the Democratic Action Party (DAP). The most successful of the coalition, the Parti Keadilan Rakyat (PKR), promised to bring to Malaysia a ‘truly’ constitutional state guaranteeing basic human rights, rule of law, and an independent judiciary to help eliminate corruption, discriminatory policies, and introduce affirmative action policies to help the poor.
In general, Malaysia's combined opposition – the Pakatan Rakyat – argue that there is an extensive rot in national institutions, particularly in relation to the independence of the judiciary. Several well-publicized cases have revealed that the government has been meddling in judicial proceedings (Pakatan Rakyat, Reference Rakyat, Sekarang and Malaysia!2011). Overall, it cannot be denied that corruption in national institutions is a serious problem in Malaysia, if, for instance, the Pakatan Rakyat (Reference Rakyat, Sekarang and Malaysia!2011) report that RM28 billion is lost each year to leakage, financial improprieties, and continuing corruption can be believed. In the 2010 Transparency International Poll, 46% of Malaysians reported that corruption is worsening in 2010 compared with 2009. Therefore, one of the aims of the Pakatan Rakyat is to free some of the nation's institutions from political interference, through sustained campaigns and initiatives (Pakatan Rakyat, Reference Rakyat, Sekarang and Malaysia!2011). It is possible that democracy reforms in neighbouring Indonesia may have had a diffusion effect in Malaysia, which has led to gradually increased popular demands from among the Pakatan Rakyat.
Conclusions
Our findings show that even though Indonesia and Malaysia have very different political systems, public attitudes towards democracy are remarkably similar. Positive attitudes towards democracy in both countries are undermined by systemic corruption and a perception of poor government performance in the upholding of liberal democratic rights. Among other rights, just under half the populations of Indonesia and Malaysia are not yet satisfied that they have a right to criticize the government.
This research has highlighted that while, on the surface, democracy as a principle achieves widespread support in Indonesia and Malaysia, once we start to take a closer look at whether citizens in Indonesia and Malaysia are satisfied with their government's effort to implement the core values of democracy, such as equality, freedom and the rule of law, the picture starts to become less rosy in both countries. In Indonesia, social indicators indicate more attention is needed to lift the most vulnerable out of poverty while at the same time eradicating corruption in national institutions, such as the judiciary, the police force, the civil service, and political parties. In Malaysia, while considerable progress has been made in economic development, there has been less progress in the provision of liberal democratic rights that allow citizens to openly criticize government in public spaces and media forums.
This cross-national comparative research began with an assumption that at the turn of the century support for democracy was high and since then we have only witnessed regression or backsliding. However, these findings show that during this period, Indonesian and Malaysian citizens did not view democracy uncritically. In fact, they had reservations about the extent of liberal democratic rights and corruption within institutions. Furthermore, the military's role across Indonesia still appeared to have a dampening affect on strong support for democracy. Based on these findings alone, it appears that while according to Freedom House there has been a regression in terms of institutional progress, at the citizen level, support for democracy and democratic governance has always been fragile. This is particularly the case within the context of ongoing concerns about freedom, the right to criticize government, and widespread corruption.