Introduction
It is possible that the Universe has been able to support the emergence of intelligent life for the last 5.0 billion years (Lineweaver Reference Lineweaver2001). It is also possible that if humanity is not alone within the Galaxy that the inter-arrival times between emergent intelligences could be enormous (Hair Reference Hair2011). This temporal head start begs the question first posited in a discussion in 1950 by physicist Enrico Fermi who observed that the apparent size and age of the Universe suggest that many technologically advanced extraterrestrial civilizations should exist. However, his hypothesis seems inconsistent with the lack of observational evidence to support it (Wesson Reference Wesson1990). There are many proposed explanations for this paradox (Webb Reference Webb2002). Two such explanations propose that the emigration of a civilization throughout a region of space is such that it takes time measured in geologic epochs to colonize galactic-scale regions (Gros Reference Gros2005), and that within these regions large voids may be left uninhabited by un-named processes (Landis Reference Landis1998). This further suggests that a lack of observational evidence of technological civilizations is likely if the Earth is located within one of these voids or that the nearest such civilization has simply not yet had enough time to reach us due to the extreme difficulty of interstellar travel (Brin Reference Brin1983). Humanity, in this theory, is separated too far in both space and time from extraterrestrial intelligence to expect contact. We develop a three-dimensional model to evaluate this explanation for the Fermi paradox.
This model is based on a mathematical discipline called percolation theory. Percolation theory, originally conceived to solve problems involving the diffusion of liquids through porous materials, has been developed as a tool to solve problems involving the existence of paths between vertices within a randomly connected graph (Broadbent & Hammersley Reference Broadbent and Hammersley1957) and to show that the creation of voids in connected probabilistic graphs are possible (Landis Reference Landis1998). Its original primary question, ‘If a liquid is poured on top of some porous material, will the liquid be able to make its way from hole to hole and reach the bottom?’ is restated here:
‘If a civilization emigrates from a location distant from Earth and continues to travel between stellar systems expanding at an ever-increasing rate, will a colony exist with sufficient proximity to Earth to facilitate contact?’
Assumptions and model
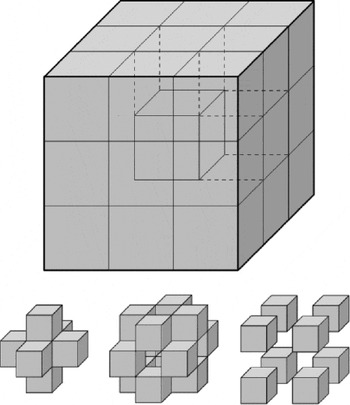
To develop a conservative model, it is assumed that a civilization with limited resources will always be more likely to travel to the nearest stellar systems (Newman & Sagan Reference Newman and Sagan1981) since any such voyage is likely to take centuries (Long Reference Long2011). Thus, the probability of colonization of a system is proportional to the distance between the system and an established colony. It is further assumed that a system is considered desirable only if it is within a region where a population limit has not yet been reached, and that no system is preferred among other desirable systems of equal distance (Fig. 1). These restrictive assumptions will result in a model that will serve as a baseline for interstellar emigration.
A three-by-three array of cubes highlighting the central cube surrounded by the 26 cubes adjacent to it. The vertices (not pictured) are situated in the centre of each cube and represent a star system. The centres of the |N| = 6 closest cubes, which share a common side with the central cube, are defined to be one unit from the centre of the central cube. Likewise the |M| = 12 cubes, which share a common edge with the central cube, are defined by the Pythagorean Theorem to be at a distance of  $\sqrt 2 $ and the |F| = 8 cubes, which share a common corner are defined to be at a distance of
 $\sqrt 3 $.

To create the model, an algorithm is presented which creates a graph of randomly connected vertices. The first attempt at the algorithm defined a cubic grid of vertices, then established connections between the vertices and stored the information in an adjacency matrix. This method proved computationally inefficient since a cubic region of length n − 1 contains n 3 vertices and requires that the connectivity information is stored in a square matrix with n 5 elements. Even with a small region, the memory required to store and update the connectivity matrix often exceeded the available computational resources. However, in further developing the algorithm it became necessary to create two procedures: one which takes the location of a vertex within the cubic region as an input and outputs a number representing the location of a vertex within the adjacency matrix, and another which reverses the conversion. Using these two procedures to create a list of addresses, the completed algorithm, presented below, is computable. The algorithm, for a given seed vertex s, lists the closed vertices which are in the neighbourhood of s, chooses one to be adjacent (henceforth open), and stores the information as a list of adjacency matrix addresses. Lastly, since the number of connected vertices increases exponentially and the algorithm is run iteratively for each connected vertex, the required processing time increases considerably after a few dozen iterations. Although it is possible to run more iterations, in consideration of the amount of time needed to generate these graphs, the iteration maximum was set at t = 250 for presented models. The use of high-speed computing techniques should be used to produce models on larger scales of time. Note that, except for computation of graphs, the value of n is arbitrary. The computational process used to map adjacency matrix addresses to vertex coordinates requires that the coordinates be contained in a predefined cube. The parameter does not require inclusion in the algorithm, which defines the vertices more generally as points in an arbitrarily large cubic region. Therefore, for computation, the chosen value of n must be sufficiently large such that the probability of colonization of a vertex not contained in the cube is close to zero. Fortunately, it is easy to find such an n for any combination of parameters, as will be shown.
Emigration algorithm
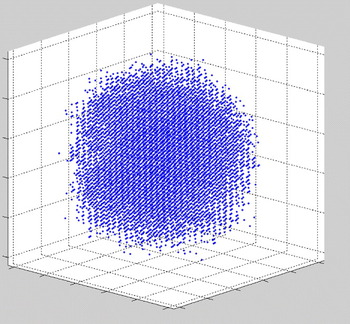
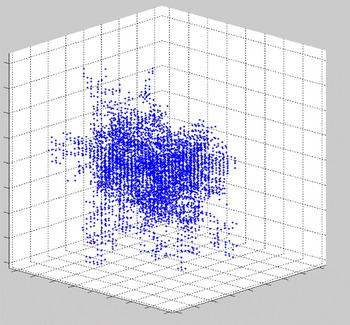
The algorithm initializes with one open seed vertex, and opens any one of the 26 vertices adjacent to the seed vertex with a probability equal to the cardinal value c. The real value of c can be interpreted as a civilization's propensity to emigrate. The process is then repeated for all previously settled vertices with an additional loop until the desired amount of iterations has passed. The additional loop evaluates the number of un-colonized vertices in the neighbourhood of the given colonized vertex and proceeds only if it is below some given value m which can range from 1 to 26 (the 26 vertices surrounding the seed). In doing so, the number of open vertices in a neighbourhood can be limited for the purpose of trying to create voids that might occur as a civilization may choose to ignore some star systems for any number of reasons. The real value of m is indicative of the territorial completeness of a civilization's emigration. After the desired number of iterations has passed, the set of open vertices is plotted to obtain graphs similar to those shown in the Figs. 2 and 3.
A typical output from the algorithm after 250 iterations where the probability of emigration is c = 0.5 and all m = 26 adjacent vertices may be colonized.

A typical output from the algorithm after 250 iterations where the probability of emigration is c = 0.5 and m = 4 adjacent vertices may be colonized.

The following pseudo-code was used to generate the specific MatLab application (available from the authors upon request):
Definitions: Let R be a cubic lattice of uniformly distributed vertices. Let v be any vertex in R. Let O be the set of all open vertices. Let o be any vertex in O. Let U be the set of all closed vertices. Let u be any vertex in U. Assign the temporary value 1 to the iteration counter. Let 0⩽c ⩽ 1 be the cardinal value. Define m to be the maximum number of open adjacent vertices in any neighbourhood. Define |X| to be the number of elements in set X.
Step 1 (Define seed vertex):
Include in U all vertices in R.
Include in O and exclude from U the centremost vertex s in R.
Step 2 (Sort neighbourhood vertices):
untilt equals the desired number of iterations,
Step 2.2 (sort adjacent vertices)
for each o in O do:
Step 2.2a (cardinal value check)
Define r 1 to be a uniformly distributed random variable on [0,1].
ifr 1<c
Step 2.2b (sort adjacent vertices):
Define N to be the set of all u that are 1 unit away from o.
Define M to be the set of all u that are $\sqrt 2 $ units away from o.
Define F to be the set of all u that are $\sqrt 3 $ units away from o.
Step 3 (selection of adjacent neighbour):
if 26 – (|N| + |M| + |F|) < m
Define r 3 to be a uniformly distributed random variable on [0,$\sqrt 3 $]
ifr 3 < 1, remove random member of N from U and add to O.
else ifr 2<$\sqrt 2 $, remove random member of M from U and add to O.
else remove random member of F from U and add to O.
end if
end if
else increase the value of t by 1.
end if
end for
end until
ifv is in O, there exists an open path from s to v.
Results
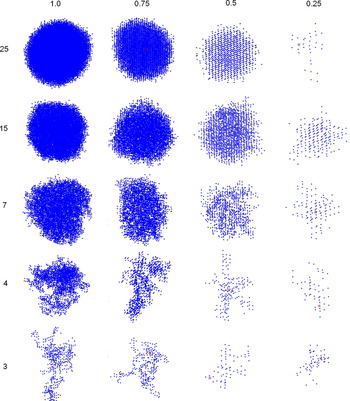
The algorithm creates a three-dimensional graph that is roughly spherical in shape for high values of both the cardinal value c and maximum number of open adjacent colonies m (Fig. 2). At lower values of c and m, both exterior projections and an amorphous shape (Fig. 3) are apparent. Figure 4 provides a summary of these findings for various values of c and m and clearly shows that there is significant distinction between the shape of graphs obtained with high m values and those obtained with low m values. Graphs obtained with lower cardinal values also contain fewer connected vertices than graphs obtained with higher cardinal values and are slower to propagate. The density of colonies within the graph depends on the maximum number of open adjacent colonies.
These three-dimensional graphs were obtained with 250 iterations at critical values decreasing from c = 1.0 on the top left to c = 0.25 on the top right. The maximum number of connections allowable decreases down the figure from m = 25 to 3. It should be noted that the algorithm usually terminates prematurely at m < 4, so the graphs at m = 3 are unusual. The seed vertex is highlighted in red.

Allowing a maximum number of daughter colonies m imposes a population cap, a necessary assumption held in some previous emigration models of interstellar civilizations (Newman & Sagan Reference Newman and Sagan1981), but one which is absent from previous percolation theory evaluations of the Fermi Paradox (Landis Reference Landis1998). This additional assumption creates a bias that favours exterior projections and isolated colonies and generally causes an increase in distance from the seed colony to the most distant colony as the carrying capacity decreases. Graphs produced with low values of m often contain volumes that lack colonies (henceforth voids) in their interior, with the number and size of voids increasing as the carrying capacity decreases (Fig. 5); however, the size of the voids is limited. Specifically, m < 4 causes the graph to assume a finite and permanent configuration in almost all cases because in early iterations it is very likely that all vertices on the edge of the connected graph fail to colonize due to the carrying capacity.
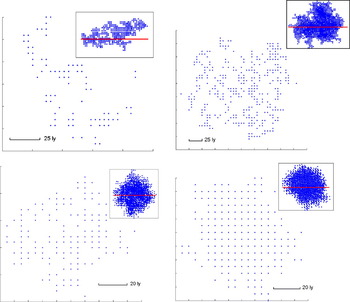
The following four images show horizontal slices through an expanding civilization at values of m = 3, 4, 10 and 20 and c held constant at c = 0.5 to expose voids within the graph. Note that as m increases the voids become smaller.

Note that, while finite permanent configurations are discussed by Landis, the Landis model includes a fixed, global parameter P that describes the probability that any vertex will emigrate or continually fail to emigrate for the remainder of the iterations. It is therefore possible for a Landis model to assume a finite permanent configuration, while there are still desirable systems in the neighbourhood of some colony. The authors find this configuration unlikely for a civilization under realistic circumstances, for obvious reasons. Although the cardinal value parameter c in the model presented is defined similarly to the parameter P in Landis, the algorithm presented (in Step 2.2a) compares a random variable to c for each open vertex iteratively, so such a configuration is unlikely in the model presented, and any such configuration is almost certainly not permanent. The inclusion of this parameter P by Landis also influences the characteristics of the voids found in graphs obtained using that model, since vertices located in a void may in fact be desirable, but surrounded by non-emigrating colonies. For this reason, the size of permanent voids found in Landis’ models may be inflated.
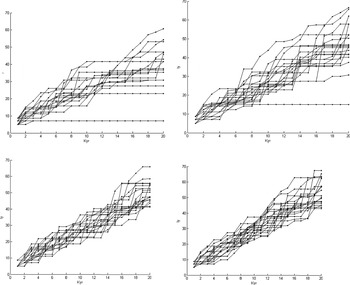
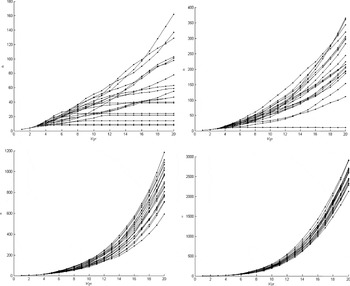
Given a conservative travel speed of 1% of the speed of light, a uniform distribution of habitable systems with an average separation of 5 light years, and a 500 year period to build the infrastructure necessary for subsequent interstellar emigration from a newly colonized system, one iteration of the algorithm is 1000 model years. Figure 6 shows the distance per iteration of the farthest new colony of 20 graphs for 20 iterations each (20 Kyr), using m values of 3, 4, 10 and 20 and c = 1. Note that, not only does the radius of a civilization's maximum extent grow linearly (0.0025 ± 0.0002 light-years per year), but it also grows at the same rate independently of the value of m. It follows that a sufficiently large value of n can easily be estimated to compute a graph for any range of parameters, as stated above. The variance of the maximum radius is lower, i.e. the behaviour more predictable, at higher values of m. Figure 7 shows the dramatic effect an increasing m value can have on the total number of connected vertices, clearly showing the exponential nature of the expanding civilization.
Each of the following graphs show the distance per iteration of the farthest new vertex for 20 clusters. The figures are for m = 3, 4, 10 and 20 with the iteration number t = 20 and c = 1. Note that not only does the radius grow linearly, but it grows at the same rate independent of m. Also, note that the variance is lower, i.e. the behaviour more predictable, at higher m. Flat lines indicate that the model terminated prematurely after several iterations.

Each of the following graphs shows the total number of vertices per iteration for 20 clusters. The figures are for m = 3, 4, 10 and 20 with t = 20 and c = 1. Note the initial exponential nature of the expansion and that the scales vary. Looking at this figure it becomes readily apparent that while the emigration algorithm allows for exponential growth this growth cannot be maintained because the colonization rate is so much slower than the theoretical ability allowed by the exponential growth. y = 0.008x 4 + 0.104x 3 + 0.571x 2 + 1.339x with R 2 = 0.999 for the bottom right figure.

Analysis
It is possible to calculate walk lengths within the model. After t iterations of the model, the longest possible walk has a length of t units. In each iteration, the new edge is added to this walk with probability cp(r), where p(r) is the probability of a new node connecting at a radius of r, so the probability of a walk X t of length t is
 $$\mathop \prod \limits_{i = 1}^t cp\left( {x_i |x_{i - 1}} \right)\leqslant \mathop \prod \limits_{i = 1}^t cp\left( {r_{{\rm max}}} \right) = (cp_{{\rm max}} )^t. $$
The expected displacement of a walk at time t is
 $$E\left( X \right) = tcE\left( r \right),$$
where E(r) is the expected radius given by
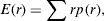 $$E(r) = \sum\nolimits_{} {rp\,(r),} $$
where
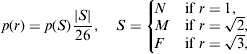 $$p(r) = p(S)\displaystyle{{|S|} \over {26}},\quad S = \left\{\!\! {\matrix{ N \hfill & {{\rm if}\;r = 1,} \hfill \cr M \hfill & {{\rm if}\;r = \sqrt 2,} \hfill \cr F \hfill & {{\rm if}\;r = \sqrt 3,} \hfill \cr}} \right.$$
 $$p\left( N \right) = \; \displaystyle{1 \over {\sqrt 3}}, \; \; p\left( M \right) = \displaystyle{{\sqrt 2 - 1} \over {\sqrt 3}}, \; \; p\left( F \right) = \; \displaystyle{{\sqrt 3 - \sqrt 2} \over {\sqrt 3}}. $$
Note that the factor  $\textstyle{{|S|} \over {26}}$ is necessary since there is not the same number of desirable systems at each possible radius. It follows that this factor depends completely on the lattice used to model habitable systems. In the model presented,
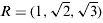 $R = (1,\sqrt 2, \sqrt 3 )$, so
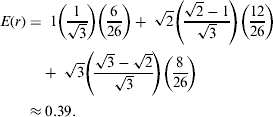 $$E\left( r \right) = \; 1\left( {\displaystyle{1 \over {\sqrt 3}}} \right)\left( {\displaystyle{6 \over {26}}} \right) + \; \sqrt 2 \left( {\displaystyle{{\sqrt 2 - 1} \over {\sqrt 3}}} \right)\left( {\displaystyle{{12} \over {26}}} \right) + \; \sqrt 3 \left( {\displaystyle{{\sqrt 3 - \sqrt 2} \over {\sqrt 3}}} \right)\left( {\displaystyle{8 \over {26}}} \right) \approx 0.39.$$
This value comports very nicely with the results of the algorithm (0.0025 ± 0.0002 light-years per year) in that within the theoretical model
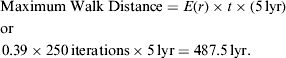 $$\hskip-2pt\eqalign{{\rm Maximum}\;{\rm Walk}\;{\rm Distance} = {\rm} & E\left( r \right) \times t \times (5 \, {\rm lyr})\hfil \cr {\rm or\hskip114pt}\hfil \cr{0.39 \times 250 \,{\rm iterations} \times 5\,{\rm lyr} & = 487.5 \, {\rm lyr}{\rm.}\hskip-46pt} $$
Thus, it is possible to calculate the probability that a walk exists from the seed colony s to a distant colony v in t iterations by taking a sum of probabilities over all possible walks from s to v of length t or less. Symbolically:
 $$\mathop \sum \limits_{i = 1}^t \mathop \sum \limits_{X_t \in O} \mathop \prod \limits_{i = 1}^t cp\left( {x_i |x_{i - 1}} \right) \leqslant \mathop \sum \limits_{i = 1}^t \mathop \sum \limits_{X_t \in O} \mathop \prod \limits_{i = 1}^t (cp_{{\rm max}} )^t, $$
where x 0, x t∈X t satisfiy x 0=s, x t=v. Note that the sum converges as t → ∞ since cp max is strictly less than one. With this formula it is possible to give, for instance, the probability of contact after t years with the source of a non-natural radio transmission detected from some location v within the Milky Way.
Conclusion
In 250 iterations (250 Kyr), a civilization with the highest proclivity to emigrate (c = 1) will travel approximately 500 light years, about half the distance possible, although the results vary somewhat from graph to graph. This rate of expansion is approximately one-fourth of the maximum travel speed of 1% of the speed of light. At this modest rate, a civilization could still span the Milky Way in less than 50 Myr. Higher travel speeds could obviously reduce this number, so the first explanation of Fermi's paradox (Gros Reference Gros2005) is not supported by the model presented. The model shows that in the 5 Gyr the Universe has been able to support intelligent life, the first civilization to emerge could have colonized the Galaxy 100 times over and done it long before the second civilization even evolved (Hair Reference Hair2011).
In addition, while interior voids exist at lower values of c initially, most large interior voids become colonized after long periods regardless of the cardinal value chosen, leaving behind only relatively small voids. In an examination of several 250 Kyr models with a wide range of parameters, the largest interior void encountered was roughly 30 light years in diameter. Since humans have been broadcasting radio since the early 20th century and actively listening to radio signals from space since 1960 (Time 1960), it is highly unlikely that the Earth is located in a void large enough to remain undiscovered to the present day. It follows that the second explanation of Fermi's Paradox (Landis Reference Landis1998) is not supported by the model presented.
What is most interesting about these results is that the explosively exponential nature of one parent colony producing several daughter colonies and then the daughters doing the same ad infinitum is tempered somewhat because the model suggests that competition for new worlds in the expanding wave front of colonization gets very intense while, conversely, there are relatively easy pickings for further colonization within any interior neighbourhood (Jones Reference Jones1981; Gros Reference Gros2005). It is possible to create a more complex model in which, in order to minimize inter-colony competition, the colonies might all periodically emigrate away from the seed node, with older colonies from the interior of the cluster replacing younger ones near the exterior, and colonize newly desirable vertices in previously maximally open neighbourhoods. The majority of the colonies would then continue to move outward, leaving no desirable system untouched. This alternate strategy of emigration would maximize both resource acquisition and minimize inter-colony competition in the case of economically motivated emigration, though the boundary behaviour of such a model is identical to the strategy presented herein. However, this alternate strategy is not necessary for the maximization of exploratory potential in the case of scientific or politically motivated emigration, in which case it is clear that the strategy presented herein is vastly more efficient.
Fermi's back of the envelope calculation, along with science fiction's love affair with self-replicating extra-terrestrial probes (Freitas Reference Freitas1980) and other exponentially driven theories of galactic colonization seem to be valid from an algorithmic perspective. However, the lack of observational evidence of previously extant civilizations suggests that no civilization has yet traversed the Milky Way as described.