Nomenclature
- AIWT
Altitude Icing Wind Tunnel
- BL
Boundary Layer
- BLI
Boundary Layer Ingestion
- CFD
Computational Fluid Dynamics
- NRC
National Research Council of Canada
Symbols
- A
area, m2
- k
turbulent kinetic energy generation, J/kg
-
 $\dot m$
mass flow rate, kg/s
- P
pressure, Pa
- R
gas constant
- T
temperature, K
-
${U_\infty }$
freestream velocity, m/s
- V
velocity, m/s
-
${V^ + }$
non-dimensional cross flow parameter
-
$v$
cross flow velocity, m/s
- X, Y, Z
coordinates, m
- ε
turbulent kinetic energy dissipation rate, J/(kg.s)
- ρ
density, kg/m3
- δ
boundary layer thickness, m


Subscripts
- ave
average
- Aux
auxiliary air supply
- BLgen
boundary layer generator
- max
maximum
- S
static
- t
total
1.0 Introduction
Recent advances in aerospace propulsion seek to minimise emissions and noise of aircraft propulsion systems via electric hybridisation. Unfortunately, aircraft are poorly suited to electrical propulsion as the energy storage requires significant weight increases, making these systems considerably less efficient than liquid hydrocarbon fuel-powered propulsion systems. Benefits due to hybridisation can only be realised if coupled with other energy saving technologies such as distributed propulsion or integrated propulsion-airframe systems. One such energy saving technology getting attention is boundary layer ingestion (BLI), in which the aircraft propulsors ingest the aircraft boundary layer and consequently require less energy to create the same amount of thrust. Preliminary studies on the benefits of boundary layer ingestion predict about a 10% reduction in energy consumption [Reference Seitz, Bijewitz, Kaiser and Wortman1,Reference Hall, Huang, Uranga, Greitzer, Drela and Sato2].
There are several architectures which allow the ingestion of the boundary layer [Reference Smith3–Reference Florea, Matalantis, Hardin, Stucky, Shabbir, Sharma and Arend7]. Theoretical estimations have shown the architecture with the propulsor mounted on the tail of the aircraft and powered by the main engines has a substantial potential improvement in fuel efficiency [Reference Rhodes8,Reference Plas9]. However, a challenge with BLI is that it creates a non-uniform engine inlet flow which may reduce engine performance, create unsteady blade forces and vibrations, combustion instabilities (for gas turbine engines) and reduced engine stall margin.
Limited experimental results evaluating boundary layer performance have been published compared to the considerable number of analytical and numerical studies The National Research Council of Canada (NRC) has therefore developed test rig capability for studying boundary layer ingestion propulsion. The boundary layer rig is unique compared to most known BLI projects in that it is capable of varying the operating pressure levels and Mach numbers, while most other known studies have been performed atmospheric inlet pressure and lower speeds.
The initial purpose of the rig is to demonstrate whether boundary layer ingestion is in fact advantageous in reducing the power required for a given thrust and a secondary purpose will be to validate performance of boundary layer ingestion fan concepts. The first objective is achieved by creating a minimal boundary layer and a thickened boundary layer upstream of the fan and comparing the power required in each case to generate a specified thrust. The second objective is achieved by performing pressure, temperature and flow directional traverses at various axial performance planes through the fan with boundary layer ingestion.
This paper provides details of the boundary layer generator including design, analysis and experimental results.
2.0 Facility
The boundary layer facility comprises an altitude plenum, the boundary layer generator and a fan rig. It is designed to simulate a propulsive fuselage BLI configuration. The facility is modification of the altitude test facility and compressor rig described in Ref. (Reference Currie10).
2.1 Altitude facility
The altitude facility (Fig. 1) is a depressurised steel duct system. The duct comprises a bell mouth inlet, a throttling valve, flow conditioning screens, a plenum with the test section and an exhaust that is connected to the compressors, providing negative pressure to create altitude and flight velocity. The facility is capable of providing pressure equivalent to an altitude up to 12km and maximum mass flow rate of 2.3kg/s. Altitude is simulated by adjusting a throttling valve just after the inlet, which trades off altitude with mass flow for a given exhaust compressor set point.
Test rig schematic: (a) bell mouth, (b) gate valve, (c) flow conditioning and contraction section, (d) test section and centre-body (BL generator), (e) fan, nacelle and bypass, (f) exhaust duct.

2.2 Boundary layer generator
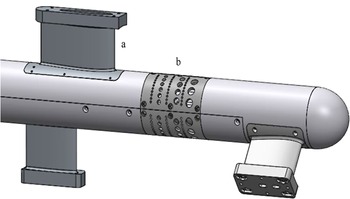
The boundary layer generator that is used to simulate boundary layer development over an aircraft fuselage is shown in Figs 2 and 3. The boundary layer centre-body is mounted within the test section and supported by struts. The struts are positioned to create boundary layer disturbances similar to those seen over a fuselage due to engine pylons and tail structures. The BL (boundary layer) generator can create a natural boundary layer due to skin friction, but also has an array of perforated plates through which pressurised air can be blown to manipulate the boundary layer thickness, as shown in Fig. 3.
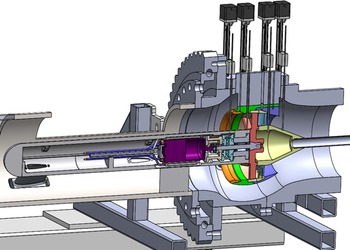
Cut-away view of the plenum: (a) test section, (b) centre-body, (c) nacelle and fan.

BL generator: (a) strut, (b) half-sleeve perforated plate.

2.3 Fan rig and nacelle
The fan is about 1/7 scale and measures 18cm in tip diameter. The initial fan to be tested is designed for a distortion pattern of a fan mounted on the tail cone of an aircraft [Reference Martensson, Lejon, Ghosh, Akerberg, Rasimarzabadi and Neuteboom11,Reference Martensson and Laban12] and is mounted within a scaled nacelle (Fig. 4). A total of five instrumentation traverses (only four shown) pass through the nacelle and take pressure temperature and flow directionality of the fan performance.
Cut-away view showing nacelle, fan system and probe traverses.

Axial locations of the traverses include the inlet to the nacelle, the fan inlet face, between the rotor and stator, immediately downstream of the stator and at the exit of the nozzle. The entire plenum shell and nacelle rotates with the instrumentation so that up to a ± 180° sector can be mapped with the traversed probes in order to get a complete map of the flow. A bypass duct allows airflow to bypass the nacelle so that the boundary layer along the outer wall of the plenum passes the fan without being ingested, as such an effect would not be representative of a fan in free flight.
The fan is powered by a three-phase electrical motor housed within the boundary layer body, capable of up to 15kW electrical power and up to 36,000rpm. Fan power is measured by electrical power as well as through a torque meter and a tip sensor to determine rotor speed. Thrust is measured through a load cell installed on the rotor shaft. Integrating the pressure and temperature traverses provides additional measurement of thermodynamic efficiency and thrust.
3.0 Design and measurement
3.1 Design of the BL generator
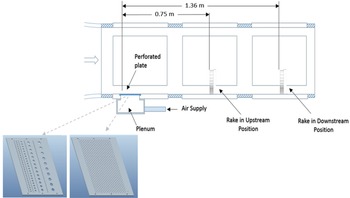
The BL generator is designed to artificially increase the natural boundary layer thickness upstream of the fan blades. A pilot study was conducted within the NRC’s Altitude Icing Wind Tunnel (AIWT), examining the effectiveness of artificially thickening a turbulent boundary layer of a flat plate by applying a blowing cross-flow along the wall of the test section to modify the streamwise development of the boundary layer. Figure 5 shows a schematic of the test setup [Reference Orchard and Clark13]. Two perforated plates, attached to an external air supply, were installed in the upstream access window, and boundary layer measurements were taken at the middle and downstream access window locations at 0.75 and 1.36m respectively.
Schematic of the AIWT full-test section with boundary layer thickening device and plates installed at the first window location.

The results showed that, by applying a blowing cross-flow into the wind tunnel freestream, an increase in boundary layer thickness can be achieved while maintaining an appropriate velocity profile at the wall, which means a typical turbulent boundary layer profile. The increase in boundary layer thickness is shown to extend a significant distance downstream from the region of blowing cross flow. When the cross-flow air is passed through a perforated plate with varying hole diameters, the boundary layer thickness measured downstream increased by 32%. Reducing the porosity of the plate by 60% led to a further increase in boundary layer thickness up to 77% thicker than that of a naturally developed profile [Reference Orchard and Clark13]. A non-dimensional scaling parameter, V+, was defined to enable this method to be scaled for a technology demonstrator of an engine BLI concept. This non-dimensional cross flow parameter is defined as the ratio of the cross-flow velocity to that of the freestream:
 \begin{align} {V^ + } = {v \over {{U_\infty }}} \end{align}
Where v is the velocity of the blowing cross flow provided from,
 \begin{align} v = {\rm{\;}}{{\dot m} \over {{\rho _{Aux}}.{A_{Plate}}}} \end{align}
With the density of the cross-flow air,
 $\rho$
Aux
, calculated from,
 \begin{align} {\rho _{Aux}} = {{{P_{Aux}}} \over {R.{T_{Aux}}}}\end{align}
The
 ${V^ + }$
is compared to the percentage increase of the boundary layer thickness at the downstream location in Fig. 6. This information was used for designing the BL generator and estimating the required BL generator mass flow rate.
Percentage increase in boundary layer thickness with increasing V+ [Reference Orchard and Clark13].

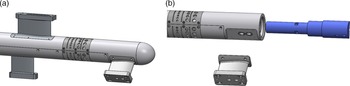
The designed boundary layer generator is shown in Fig. 7. In this design, air pressure fills four cavities inside the centre-body and exits through BL generating holes. Half sleeves are used for the BL generation. The sleeve is perforated with almost the same patterns as in the pilot study but with a reduced number of holes. To design the sleeve, the pressure on the wall was estimated using CFD simulation.
Boundary layer generator design (a) centre-body with half sleeves of the boundary layer generator and (b) arts of the system.

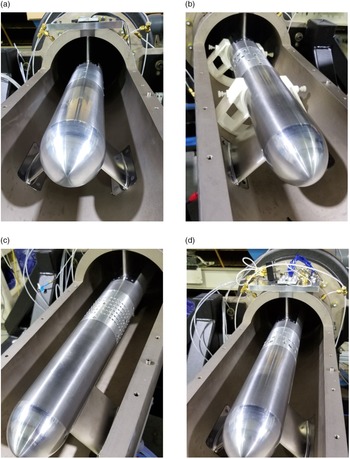
Figure 8 shows a picture of different BL generator configurations, without holes for natural BL generation and with holes for artificial thickening of the BL. The BL thickness is calculated from the boundary layer velocity profile, measured by traversing a Kiel probe across the fan radius and circumference to measure the total pressure data and using a ring of static taps to measure the static pressure. In these tests, the corresponding Reynolds number per characteristic length is between 1.2M and 3.2M.
Different patterns of BL half sleeves (a) no holes, (b) smaller holes upstream, (c) uniform holes and (d) bigger holes upstream.

3.2 Numerical simulation setup
To provide guidance for design choices, the flow field was analysed using ANSYS FLUENT V2021 [14]. The numerical model is steady and density based. The solution method is implicit with flux type of Roe-FDS [Reference Roe15] and uses a k-ε turbulence model with standard wall functions [Reference Launder and Spalding16]. The k-ε model is a well-known two-equation turbulence model and has been extensively validated and applied to a wide range of industrial flows/applications. However, this model carries along some harsh shortcomings that are important to acknowledge [Reference Piquet17]. The assumption of the standard k-ε model is that flow is fully turbulent, and turbulence viscosity is isotropic, which means the ratio between Reynolds stress and mean rate of deformations is the same in all directions. Wall functions are applicable for a suitable range of y+ and by that to the flow’s Reynolds number. Using the standard wall functions is most suitable for high Reynolds flows of which integrating through the viscous sublayer has only a slight impact on the desired outcome. The standard wall functions work reasonably well for a broad range of wall-bounded flows. However, the results should be interpreted carefully as the model used was adapted for the flows inside the range of applicability of constant-shear and local equilibrium assumptions that do not incorporate physical phenomena of interest such as flows involving separation, reattachment and impingement where the mean flow and turbulence are subjected to pressure gradients and rapid changes.
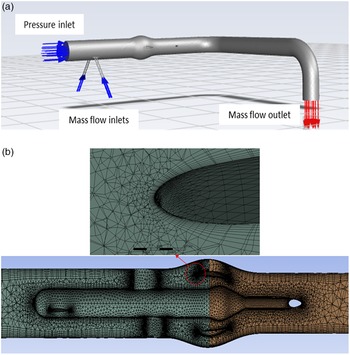
The current study applies this modelling method based on the y+ limit as provided in Table 1 and Reynolds number range of 1.2M to 3.2M per characteristic length. Convergence criterion of 10-6 is defined for all variables. To delineate the complex geometry of the BL generator, the solution domain is discretised using an unstructured grid along with a boundary layer meshing adjacent to the walls. The numerical model with boundary conditions and a cross-section view of the applied mesh are shown in Fig. 9 and the setup parameters are summarised in Table 1. The boundary conditions at the inlet and outlet of the test rig are set as pressure-inlet and mass-flow-outlet, respectively. The four inlets of the BL generator are set as mass-flow-inlet.
CFD setup parameters

CFD model and meshing (a) boundary conditions and (b) a view of the meshing.

3.3 Instrumentation for BL generator calibration tests
The BL generator calibration tests were conducted with the following goals:
-
Develop a relationship between the upstream mass flow/pressure altitude, the BL generator mass flow and the BL thickness upstream of the fan
-
Measure the boundary layer profiles over multiple circumferential points to evaluate uniformity
-
Evaluate profiles generated by BL system against target profiles from aircraft data and CFD predictions [Reference Martensson and Laban12]
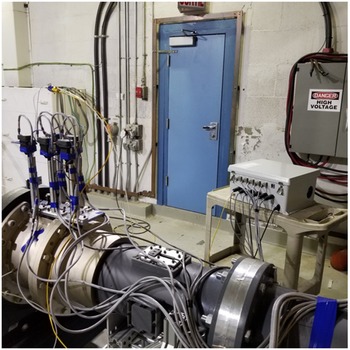
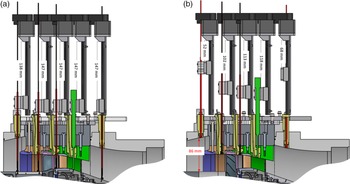
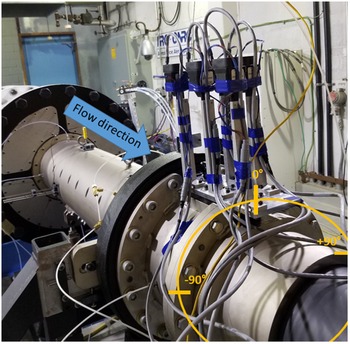
For circumferential traverses, a slewing ring was attached to the flange of the bypass section and the probe linear (radial) traverse systems were installed as shown in Fig. 10. For this phase of testing, only one of the linear traverses was used to hold a Kiel probe (the upstream one shown in Fig. 11). The measurements of total pressure and total temperature were conducted both radially and circumferentially at the location of the nacelle inlet. Note that the nacelle and fan assemblies were not installed for this testing.
Rotary and linear traverse systems.

Linear traversing distance (a) probes fully inserted and (b) probes fully retracted.

The available linear traverse distance is 84mm (Fig. 11). Data were acquired from twenty-two positions, with 2mm intervals for the points closer to the centre-body and 6mm intervals for the points toward the outer surface. The dwell time at each position was set to 15s. To make sure the pressures had reached a steady state, only the last 5s of data was used for analysis. The circumferential positions included 0°, ±60°, ±90°, ±150°, and 180°, considering 0° at the top as shown in Fig. 12. The resolution of linear traverse is 1mm and for the rotary traverse is 1°.
Angular positions of probe data acquisition.

4.0 Results and discussion
The results of applying different half sleeve perforated plates, varying the pressure altitude, and varying the mass flow rate of the BL generator are provided.
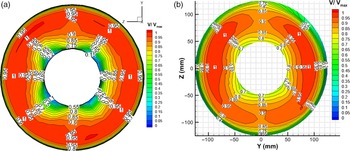
Figure 13 compares the numerical and experimental non-dimensional velocity contours at the measurement plane upstream of the fan. The maximum velocity measured over the entire area is used for non-dimensionalisation. The pattern of BL half sleeves is the smaller holes upstream, and the flow condition is for a pressure altitude of 50kPa with rig mass flow rate of 1.5kg/s. The BL generation mass flow rate is set to 0.04kg/s. There is a good agreement between the numerical and experimental results. The reduction in velocity near the top and bottom of the profiles both in the numerical and experimental results (as opposed to being uniform around the circumference) is likely due to the location of the support struts upstream of the fan inlet face.
Comparison of velocity contours, smaller holes upstream, P
S
= 50kPa,
 ${\dot m_{BLgen}} = 0.04{\rm{\;}}kg/s$
(a) numerical and (b) experimental.

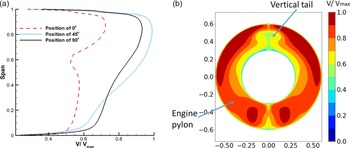
Figure 14 shows velocity profiles at the fan inlet face of the Fokker 100 aircraft at its aerodynamic design point [Reference Martensson, Lejon, Ghosh, Akerberg, Rasimarzabadi and Neuteboom11,Reference Martensson and Laban12]. This data are taken from the CFD analysis of the whole aircraft including the tail-cone thruster [Reference Martensson18]. The effect of engine pylons and tail structures over the fuselage can be seen as reductions in total pressure and the average boundary layer thickness is about 90% of the span. The selection of the pattern of BL half sleeves for this test program is based on creating a BL profile similar to the Fokker 100 profile.
Fan inlet face of the aircraft [Reference Martensson and Laban12] (a) velocity profiles and (b) velocity contour.

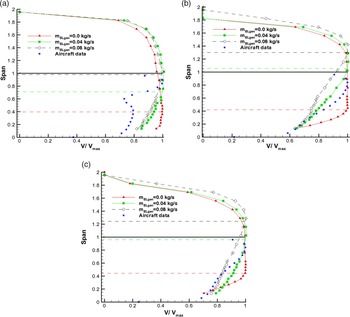
For the pattern with bigger holes upstream (Fig. 8d), the non-dimensional velocity profiles are compared at angular positions of 0°, 45° and 90° in Fig. 15 with varying BL generator mass flow rates. The data from aircraft analysis is also included for comparison. The maximum velocity at each angular position is used for non-dimensionalisation. The static pressure of the rig at the test section is 50kPa, with a corresponding upstream velocity of 55m/s. The y-axis is the radial distance non-dimensionalised based on span of the passage (45mm), where 1 is equal to the location of bypass section wall. For the case of natural boundary layer (no holes), the BL thickness over the centre-body is 40–42% of the span (as indicated by a dash-line). Injecting a mass flow rate of 0.04kg/s through the BL system, the thickness increases to 80% of the span at the 0° sector, and to 100% of the span at the other sectors. By further increasing the mass flow rate to 0.08kg/s, the boundary layer thickness reaches 100% to 130% of the span. Since this is larger than desired for this test program, a maximum BL mass flow rate of 0.04kg/s was used for the remainder of the calibration testing.
Effect of BL generator mass flow rate on velocity profiles, bigger holes upstream, PS = 50kPa (a) position of 0° (a) position of 45° and (b) position of 90°.

For the fan testing, the boundary layer of the test rig goes through a bypass section to minimise its effect on the fan performance. Therefore, the number of traversed points toward the outer wall of the rig is reduced for the remainder of the test program and the rest of the contour plots presented only represent the flow passage through the fan inlet area (inside the nacelle).
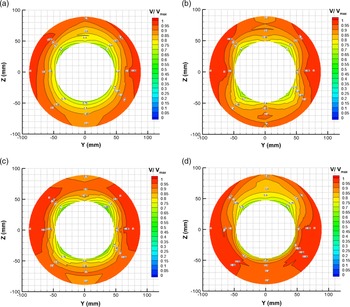
Figure 16 shows the effect of four different BL half sleeve patterns on velocity uniformity. The pressure altitude is 37kPa, and the BL generator mass flow rate is 0.016kg/s for all cases. Since air pressure fills four cavities inside the centre-body and exits through BL generator holes, all of the patterns show that the maximum BL thickness occurs approximately at the centre of the cavity locations. The pattern with small holes upstream simulates the desired aircraft profile (Fig. 14) better than the others and has a more uniform boundary layer around the circumference.
Effect of BL half-sleeves patterns on velocity contour, P
S
= 37kPa,
 ${\dot m_{BLgen}} = 0.016{\rm{kg}}/{\rm{s}}$
(a) smaller holes upstream, (b) bigger holes upstream, (c) uniform and (d) top half sleeve: smaller holes upstream, bottom half sleeve: solid.

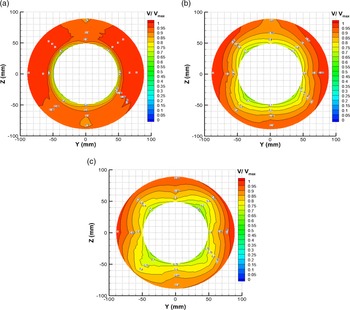
To evaluate the effect of BL generator mass flow rate, non-dimensional velocity contours are plotted in Fig. 17 for the pattern with smaller holes upstream and a static pressure of 50kPa. As expected, increasing the mass flow rate of the BL generator results in increasing the BL thickness over the centre-body, with the same trend as discussed in Fig. 15 for the bigger holes upstream pattern.
Effect of BL generation mass flow rate on velocity contour, smaller holes upstream, P
S
= 50kPa (a) no holes, (b)
 ${\dot m_{BLgen}} = 0.04{\rm{kg}}/{\rm{s}}$
, and (c)
 ${\dot m_{BLgen}} = 0.07{\rm{kg}}/{\rm{s}}$
.

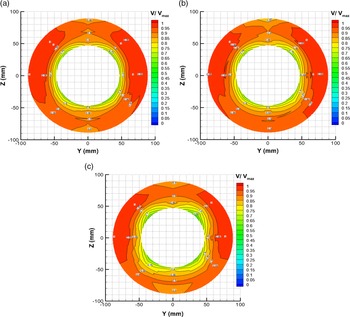
Figure 18 shows the effect of pressure altitude on velocity uniformity for the pattern with uniform holes and a BL generator mass flow rate of 0.016kg/s. It can be seen that as the simulated altitude increases, the BL thickness increases. This is likely because at higher altitude the air is less dense and has a lower pressure, while the air coming in through the BL generator remains at sea level pressure with a higher density, so the ratio of fluid momentum of the boundary layer flow versus freestream increases.
Effect of pressure altitude on velocity contour, uniform holes,
 ${\dot m_{BLgen}} = 0.016{\rm{kg}}/{\rm{s}}$
(a) P
S
= 66kPa, (b) P
S
= 50kPa and (c) P
S
= 37kPa.

The BL thicknesses (defined as the boundary layer thickness at 99% of freestream velocity) as an average of the eight circumferential positions measured are summarised in Figs 19, 20 and 21 for all different half sleeve patterns. The standard deviations of the BL thickness around the circumference for each point is indicated using error bars. The trend of increasing BL thickness with increasing BL generator mass flow rate and increasing altitude (decreasing static pressure) is the same for all the studied patterns. The pressure altitude has minimal effect on the natural boundary layer generation over the solid centre-body surface. The variation in BL thickness circumferentially as indicated by the error bars is smallest for the ‘smaller holes upstream’ configuration of the BL generator. The CFD simulations completed during the BL design also predicted that this configuration would give the most circumferentially uniform boundary layer and the best match to the desired aircraft profile. For the ‘larger holes upstream’ and ‘uniform’ hole configurations large circumferential variations in the boundary layer thickness at the maximum BL mass flow rate the result in a decrease in the average boundary layer.
Comparison of BL thickness, smaller holes upstream.

Comparison of BL thickness, bigger holes upstream.

Comparison of BL thickness, uniform holes.

Based on these results the ‘smaller holes upstream BL generator plates’ look preferable for creating the desired boundary layer effect. It is possible to vary the thickness of the boundary layer by applying reasonable amounts of blowing flow rate thus validating the design of the boundary layer generator.
5.0. Summary
A boundary layer generator for studying BLI propulsion was designed and calibration tests were conducted to establish the relationship between the upstream mass flow and pressure altitude, the boundary layer generator mass flow and the boundary layer thickness upstream of the fan. The boundary layer generator design included the use of CFD as well as preliminary tests over a flat-plate model in a wind tunnel. The boundary layer thickness and distribution was controlled by varying the air mass flow rate passing through an array of different perforated plates, and the results were compared with the natural boundary layer generated with skin friction over the centre-body. The naturally generated boundary layer thickness was approximately 40% of the span, and this thickness could be artificially increased up to the full span (and beyond) by increasing the BL mass flow rate and decreasing the pressure altitude. The BL plate pattern with the smaller holes upstream matched best with the desired aircraft profiles and provided the most uniform circumferential distribution, so it will be used for subsequent testing with the fan installed in the BLI test rig. It should be noted that the relationship between the boundary layer generator mass flow and the increase in boundary layer thickness is only an estimate, as the operation of the fan is another factor that will influence the boundary layer thickness that is not included in these results.
Future work with the fan installed will test a range of operating conditions with varying BL thickness. This work will serve as a test bed, or proof-of-concept, for future full-scale engine BLI studies and help the industry understand the technology gaps that need to be overcome to implement this technology into aircraft.
Acknowledegements
GKN Aerospace is gratefully acknowledged for providing the fan design data, Bombardier Aerospace for consulting role, our colleagues: Pervez Canteenwalla who initiated the project with great enthusiasm, Hugo Breton for his hard work in design, fabrication and setup of the BLI test rig, and Diony Duraes Santos for supporting the instrumentation and tools at NRC.