


1. Introduction
Accurate analysis of the motion of glacier ice in response to gravity and boundary tractions is central to all problems involving the interactions of glaciers and ice sheets with climate. These problems include the interpretation of ice-core paleoclimate records, interpretation of past glacier volume and length changes, and prediction of the contributions of glaciers to sea level arising from current climate changes. Glacier flow is complicated by the fact that glacier ice is a constitutively complex material. Mechanical analyses of the relationship between applied stress and deformation rate in polycrystalline ice assume a non-linear viscous flow law (typically referred to as Glen’s law) of the form

for flow in steady-state creep (Reference GlenGlen, 1955; Reference PatersonPaterson, 1994), where
 is one of six independent components of the strain-rate tensor,
 is the deviatoric-stress tensor and σω
is the second tensor invariant, equal to
 . All second-order tensor indices i and j range in value from 1 to 3. The exponent n is typically taken to be approximately 3, but values ranging from 1 to 4.2 have been suggested (Reference Raymond and ColbeckRaymond, 1980). Uncertainties persist, however, in the range of values of the parameter n, and in the form of the flow law itself (Reference BakerBaker, 1978; Reference Goldsby and KohlstedtGoldsby and Kohlstedt, 1998; Reference PettitPettit and others, 1998). The assumption of steady-state creep may not always be valid, and in conditions colder than the pressure-melting point the parameter A changes as a function of accumulated strain when the polycrystalline aggregate recrystallizes under applied stress. The parameter A is also strongly temperature-dependent, varying over two orders of magnitude between 0° and –30°C (Reference PatersonPaterson, 1994). Most knowledge of the constitutive properties of glacier ice comes from laboratory experiments (e.g. Reference GlenGlen, 1955; Reference BakerBaker, 1978; Reference Budd and JackaBudd and Jacka, 1989) and from field observations of strain rate combined with inferred values of stress (eg. Reference NyeNye, 1953; Reference RaymondRaymond, 1973; Reference Hooke and HansonHooke and Hanson, 1986). Direct measurements of local values of the full stress tensor in combination with in situ measurements of the corresponding strain-rate tensor components are the most complete source of information constraining the flow law for ice. In situ stress measurements in glacier ice have been attempted previously (Reference OuttersOutters, 1995), and partial stress-tensor measurements have been made in sea ice (Reference Cox and JohnsonCox and Johnson, 1983), but the work presented here is the first successful in situ measurement of stress-tensor components in glacier ice.
We present the results of a prototype experiment to measure the full stress tensor at depth in glacier ice. The technique is based on inclusion methods developed for measuring stresses in rocks with viscoelastic behavior such as salt or potash (Reference Amadei and StephanssonAmadei and Stephansson, 1996). For such viscous media under steady or slowly varying conditions, the state of stress in an inclusion initially placed in a stressed viscoelastic material approaches the absolute state of stress of the medium over time. Viscous creep in the immediate neighborhood of the stress-measurement unit allows stress perturbations created by the emplacement of the unit to diffuse, resulting in the elimination of a major source of error encountered in non-viscous materials. Reliance on this relaxation of stress perturbations requires that (1) the stress field being measured is slowly varying relative to the relaxation time, and (2) sufficient time is allowed for relaxation before measurements are taken as representative of the unperturbed state.
2. Study Site
Measurements were conducted on Worthington Glacier, a temperate valley glacier located in the Chugach Mountains, Alaska, U.S.A. Worthington Glacier was chosen for its ease of access, moderate flow (about 80 m a"1) and simple geometry. An extensive field program has been conducted here since 1993, and results have been reported concerning the direct observation of internal deformation (Reference Harper, Humphrey and PfefferHarper and others, 1998b), surface velocity (Reference Harper, Humphrey and PfefferHarper and others, 1998a), internal ice structure (Reference Harper and HumphreyHarper and Humphrey, 1995) and subglacial topography (Reference Welch, Pfeffer, Harper and HumphreyWelch and others, 1998). Worthington Glacier is approximately 8 km long, straight with no tributaries, and divided into three sections by two icefalls. The field studies were all located on a gently inclined (2–3°) reach between the icefalls at an altitude just below the glacier’s equilibrium-line elevation of approximately 365 ma.s.l. The surface velocity field, described in detail in Reference Harper, Humphrey and PfefferHarper and others (1998a), is generally symmetrical about the center line of the glacier, and reflects compression in the upper reach at the base of the upper icefall, and extension below as ice enters the lower icefall. The general pattern and symmetry of stress and deformation in the glacier are reflected in the crevasse patterns (Fig. 1). At the site of the stress measurements (marked with a cross in Fig. 1), the general pattern of deformation is down-glacier compression, cross-glacier extension and vertical extension, compatible with emergent-flow vectors in the ablation zone. This configuration is generally compatible with the location of the measurement site about 200 m down-glacier from the base of an icefall.
Aerial photograph of the central portion of Worthington Glacier where measurements were made. The flow direction is top to bottom (west to east); the upper icefall is out of the picture to the left, and the lower icefall is located in the region of large transverse crevasses to the left of the bifurcated terminus. The region where surface and englacial velocities were measured is depicted by the box, and the location of stress measurements by the cross. The boxed area is approximately 370 m across at its widest extent.

3. Theory of Measurement
The state of stress at a point in three dimensions is described by a tensor with six independent components σij. For glacier ice, only the deviatoric stresses (deviations from a state of hydrostatic pressure) influence the components of the strain-rate tensor. The deviatoric-stress tensor has components
 where summation is assumed over repeated indices. In this paper, deviatoric compression is denoted by negative values of deviatoric stress, and deviatoric tension by positive values. The six tensor components can be deduced from six or more measurements of normal stress (pressure) in the body, oriented in directions which span the three-dimensional space. Tensor components and normal stresses are related through the matrix equation

where [P] is a column vector of N pressure magnitudes Pn, [a] is a column vector of the six independent stress-tensor components, and
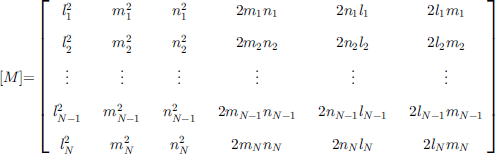
is an N × 6 matrix of geometric coefficients derived from the direction cosines li, mi, 6 ni, of the pressure-sensor orientations. For a unique solution to exist, N must be greater than or equal to 6. When N is greater than 6, a least-squares estimate can be obtained which gives a measure of the error in [a]. Normal-stress orientations 〈li,mi,ni,〉 and tensor components σij are described relative to any global Cartesian coordinate system, defined as 〈x,y,z〉 in this paper. After obtaining the stress tensor σtj in the 〈x,y,z〉 coordinate system, the eigenvalues and eigenvectors of the tensor give the principal-stress magnitudes and principal-stress axis orientations relative to that coordinate system.
4. Instrument Design and Installation
Normal-stress measurements were made at Worthington Glacier by freezing in an array of nine pressure sensors in a borehole drilled to 120 m depth. The array of pressure sensors occupies a cylindrical volume approximately 0.70 m high and 0.08 m in diameter. The pressures measured by the array are combined to form a single determination of the state of stress at the location of the installation, but individual cells are separated by sufficient distances to avoid mechanical interference between cells. Pressure sensors are based on a low-compliance (high-stiffness) design which reduces deflection of the faces to about 0.05 mm at full-scale loading. The pressure sensors were designed, built and tested at the University of Wyoming. Testing prior to field deployment included laboratory calibration of the pressure sensors to hydrostatic pressure and biaxial shear stress, and quantification of the relaxation time under conditions including ice texture, temperature and general state of stress to be encountered at Worthington Glacier. The relaxation time for laboratory runs was 5–7 days. Pressure sensors are 6 cm in diameter and 1 cm thick, and were arranged with varying orientations in a vertical stack approximately 0.7 m in height for installation in the glacier borehole. A borehole of approximately 0.1m diameter was drilled by hot-water methods (Reference Harper, Humphrey and PfefferHarper and others, 1998b) only to the depth of installation to avoid trapping a pocket of liquid water below the stress unit. Freezing of the borehole water and englacial water surrounding the measurement unit was accomplished by circulating a refrigerated fluid in a closed loop surrounding the pressure sensors. Refrigeration was provided by a 50 W thermoelectric cooler and heat exchanger located in the borehole above the pressure-sensor array. After cooler inefficiency and waste heat from pumping were accounted for, heat could be extracted from the vicinity of the pressure-sensor array at a rate of about 15–30 W. During installation, heat was extracted to freeze the water in the 0.1 m diameter borehole over a lm length enclosing the stress unit (about 2400 KJ), freeze liquid-water content in the ice within a 0.5 m radius of the stress unit (about 3300 KJ) and pull down the temperature of the ice within a 0.2 m radius of the stress unit to approximately –5°C (about 1200 KJ). Waste heat was vented into the borehole water approximately 3 m above the pressure-sensor array. At a minimum net heat extraction rate of 15 W, the freezing process can be completed in approximately 5 days. For test runs and final installation the freezer was run for at least 5 days, and freeze-in was monitored by measuring temperature in the ice surrounding the stress unit and by monitoring changing stresses on the sensors. Temperature was monitored during freeze-in, and after freeze-in during data acquisition. Power supply, temperature monitoring and pressure-sensor data acquisition were all handled through power and signal lines to data-acquisition and control devices at the surface.
5. Data
The response of the nine pressure-sensor time series for the 76 day measurement period beginning 6 July and ending 20 September 1998 is shown in Figure 2. Pressures were measured hourly, and the hourly measurements were averaged to produce single daily values shown in Figure 2. Equilibration of the pressures with the far-field stresses can be seen in the declining signals during the first ― 5 days of record. For the calculations which follow, pressure values were selected from the time series at times 18 days or more after the initial installation to ensure equilibration. A small variation in pressure-sensor signals near 30 August is common to six of the nine sensors, and is interpreted to be a real stress event in the glacier. However, two of the sensors (LG-1 and LG-9) showed anomalous behavior and were discarded, leaving seven pressure time series for the determination of the six independent stress-tensor components, with four of the remaining seven showing the 30 August jump. The anomalous pressure sensors may have been improperly coupled to the ice by freezing, or may have experienced internal mechanical problems after installation.
Time series of nine load cells.
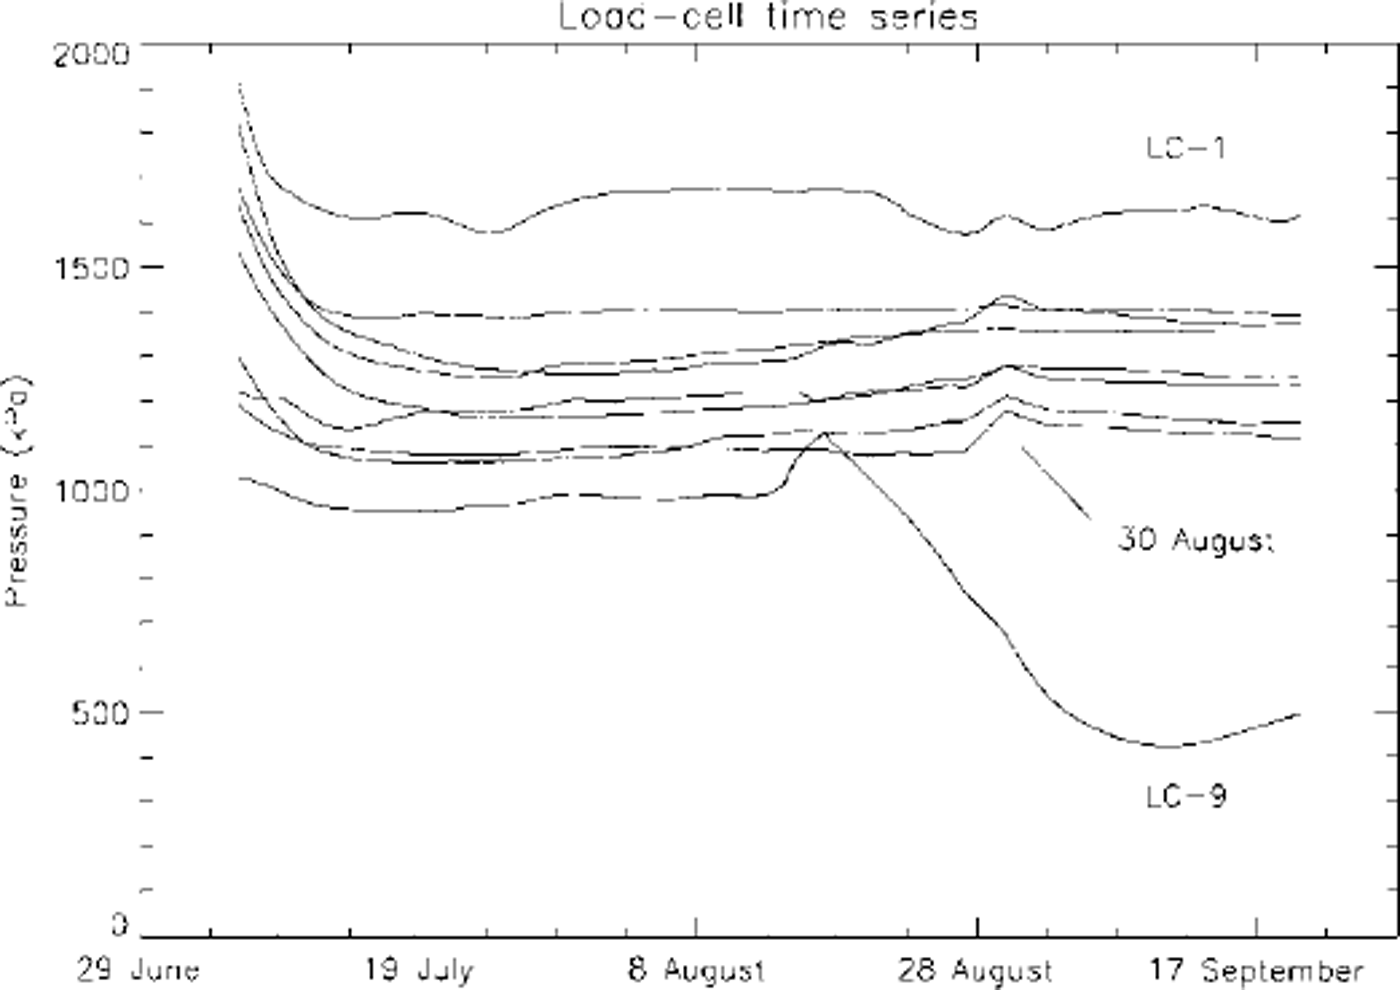
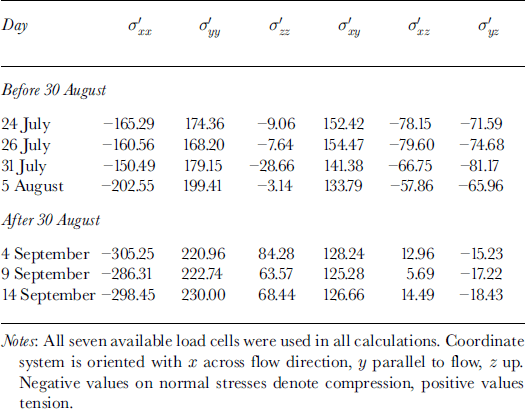
The measured pressures were converted to corresponding stress-tensor components for seven representative days following equilibration: 24, 26 and 31 July 5 August and 4, 9 and 14 September. Pressure values on 24, 26 and 31 July and 5 August were chosen as representative of fairly steady values prior to the 30 August jump in sensor pressures, and 4, 9 and 14 September were chosen as representative of the more stable period after the 30 August jump. Table 1 shows values of the deviatoric-stress tensor components calculated from sensor pressures for the seven days in a global coordinate system 〈x,y,z〉 oriented so that × is oriented to the north (horizontal and perpendicular to the glacier flow direction), y is oriented to the west (horizontal; parallel to and in the opposite direction to flow) and z is oriented vertically upwards.
Deviatoric-stress tensor components (kPa) derived from load-cell measurements
5.1. Evaluation of error in determination of stress-tensor components
Errors in the determination of stress-tensor components from oriented pressure measurements arise from four sources: (1) disturbance of the local stress field by installation of sensors (the local state of stress does not represent the unperturbed state of stress); (2) flawed coupling of sensor surfaces with the ice (pressure sensor is not measuring a simple normal force); (3) error in the measurement of actual load impinging on the sensor (sensor-signal magnitude is inaccurate); and (4) uncertainty in the orientation of the sensor (sensor orientation is inaccurate). The relaxation of the disturbance of the local stress by installation of sensors is seen in the beginning of the record shown in Figure 2 and is discussed above. Flawed coupling of the sensors is detectable when it occurs to a significant degree (as in the case of the discarded records from LC-1 and LC-9), but at less obvious levels may be hard to detect. The best insurance against coupling flaws lies in complete and effective freezing of the sensors in the borehole. Errors arising both from perturbation of the undisturbed stress field and from coupling flaws are being investigated in ongoing laboratory experiments at the University of Wyoming.
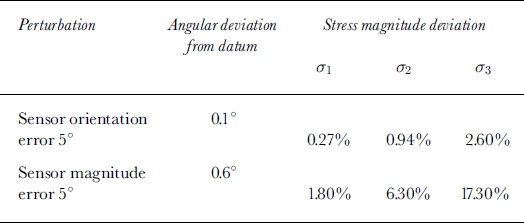
Inaccuracy in sensor-signal magnitude and sensor orientation is largely controllable in the sensor design and construction, and the influence of these errors can also be calculated by adding known errors to synthesized data. This was done by adding errors in pressure magnitude and orientation to one of seven stress sensors in a synthesized dataset, with the error magnitudes representative of the expected error in our current sensor design. The synthesized dataset was created by defining a datum state of stress, in terms of stress-tensor components, and then calculating the resolved normal stress on planes representing sensor orientations. The resolved normal stresses are the datum sensor signals, one of which is then perturbed in magnitude or orientation. The stress-tensor components are then recalculated with the perturbed sensor value included, and the result is compared to the initial datum state of stress. Differences are quantified in terms of angular deviation of principal-stress axis orientations and mean percent deviation of the three principal-stress values from the mean of the initial stress magnitudes. The results of these tests are shown inTable 2. Errors in sensor magnitude are clearly more significant than errors in orientation. The largest errors occur in the σ3 direction because the perturbed sensor is oriented most nearly parallel to the σ3 direction, although the relation between the orientation of sensors experiencing magnitude errors and the orientation of principal stresses with the strongest response is complex. On the basis of this analysis, and the difference noted between the mean sensor stress and the overburden stress expected from the depth of burial, we interpret the measured stress magnitudes with caution, but have good confidence in the reliability of the principal-stress orientations.
Results of introduction of errors into synthesized stress data
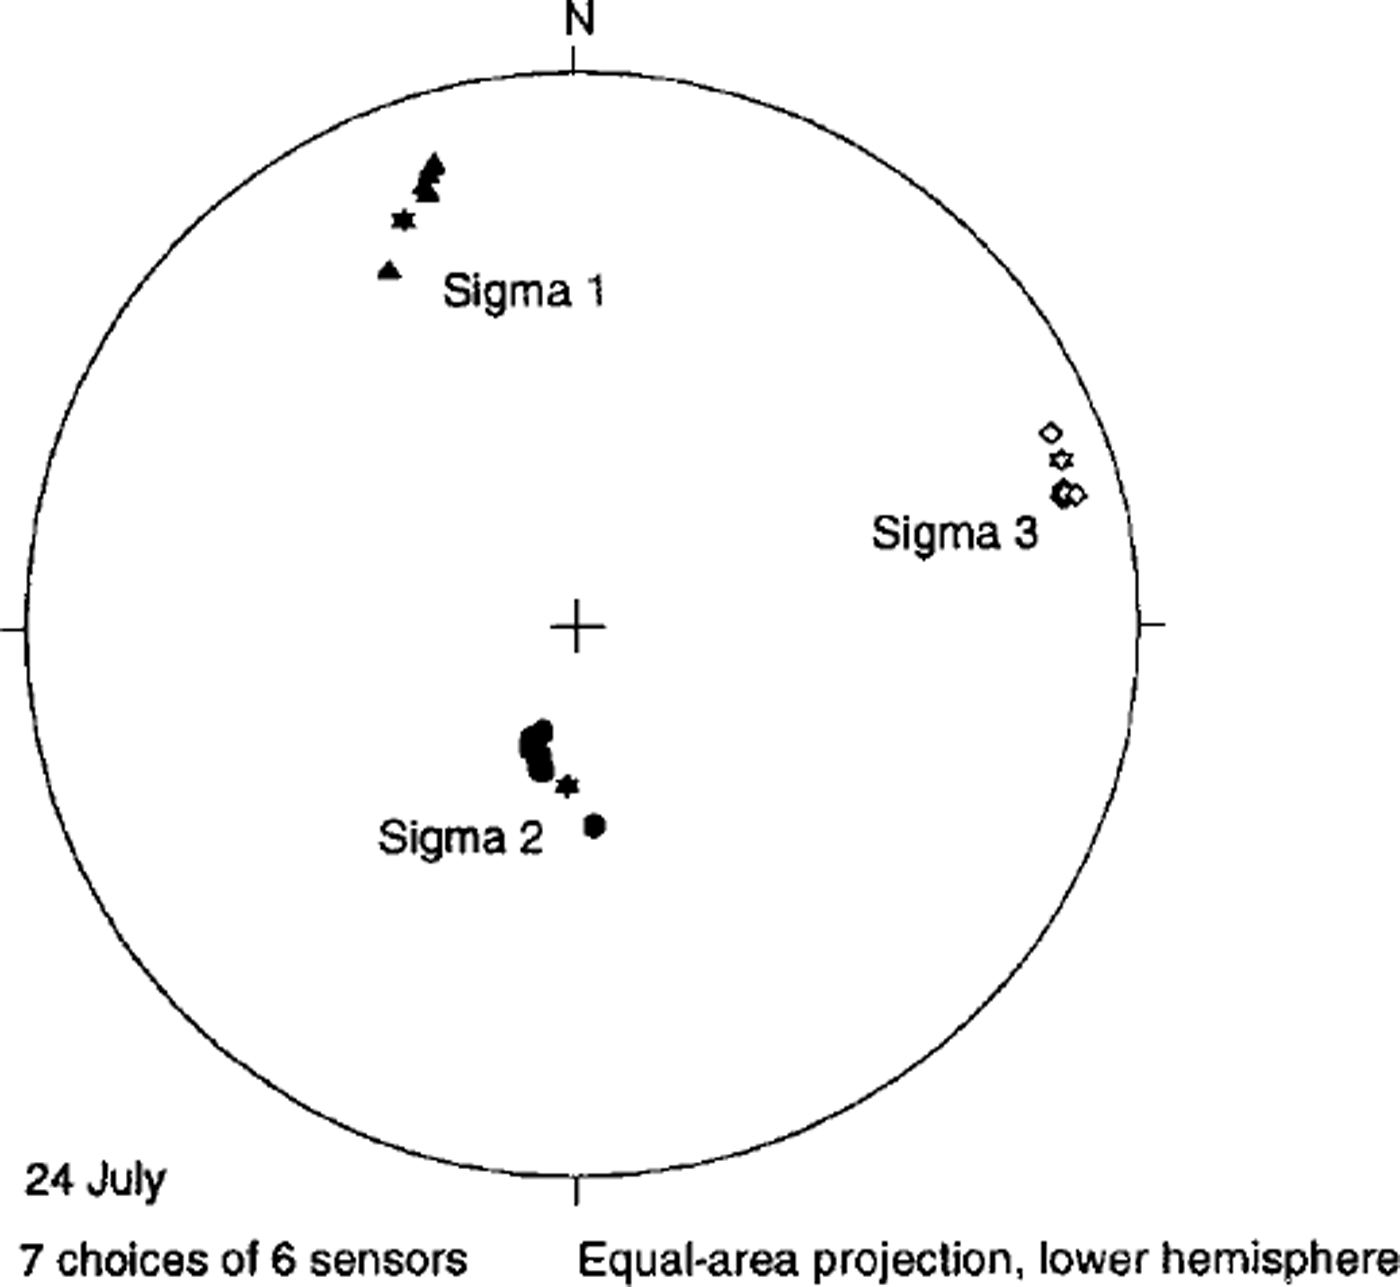
Stress-tensor component errors are also influenced by the number of sensors employed and by the distribution of sensor orientations around the orientation sphere. With seven sensors providing reliable data, there are eight possible combinations of six or more sensors available, with six being the minimum number of values required to produce a unique solution for the stress-tensor components. From the seven sensor measurements available, stress-tensor components were calculated for seven possible combinations of six pressure sensors and one combination of seven sensors. The combinations of six sensors were all found to produce more scattered values of stress-tensor components, due to less complete directional coverage of the orientation sphere, but all eight possible combinations of sensors produced principal-axis orientations which scatter to a degree comparable to the the orientation error arising from uncertainty in individual sensor orientation. Figure 3 shows the orientations of the principal stresses, plotted as equal-area lower-hemisphere projections, for the tensors determined from six of seven available sensors and for all seven available sensors. All orientations are very close, both to each other and to the principal-stress orientations presented in the discussion of changing stresses below. For all seven measurement days, the mean pressure on the seven cells was 1240 kPa, with a standard deviation of 41.2 kPa. This pressure corresponds to a burial depth of 140 m, 15% in excess of the value of 1078.4 kPa corresponding to the burial depth of 120 m under ice of density 917 kg m–3. Measurements were made in summer, when the firn cover was thin or absent, and the assumption of density equal to that for ice does not introduce a significant error.
Principal-axis orientations for seven choices of six sensors. Starred symbols show the orientations for the one choice of seven sensors.
6. State of Stress Prior to 30 August
The stress-tensor components (Table 1) at 120 m depth for dates before 30 August show lateral (cross-flow) compression and longitudinal (along-flow) extension. The vertical axial stress is variable, being weakly compressive on 24, 26 and 31 July and weakly tensile on 5 August. The sense of these terms is generally compatible with the regional flow regime which is in a transitional area between compression at the base of the upper icefall and extension entering the lower icefall. The axial strain rates
 and
 measured at the surface in the vicinity of the borehole stress measurements (Reference Harper, Humphrey and PfefferHarper and others, 1998b) show essentially a reversed pattern to that seen in the stresses at 120 m depth: surface strain rates are longitudinally compressive and laterally extensile. Comparison between stresses at the surface and at depth is not entirely straightforward, however, since insight into the characteristics of stresses at depth is based primarily on analytic solutions to the force equilibrium equations under very simple conditions, and on stresses inferred from a conventionally assumed flow law. The difference between the stresses measured at depth and inferred from velocities at the surface is discussed below.
The shear-stress term
 (marginal shear in a flow-parallel vertical plane) is positive at all measurement times, denoting left-lateral horizontal shear, which is expected on the left side of the flow center line (facing down-flow). The shear in the horizontal plane parallel to the flow direction,
 , is negative at all times, which again is the expected sense. The remaining shear-stress term,
 , represents a moment about the y axis (horizontal, oriented in the flow direction). A negative value of
 corresponds to a counterclockwise moment about the y axis, facing in the down-flow direction, and a positive value corresponds to a clockwise moment. It is a stress that could arise from a lateral (cross-flow) gradient in uplift or settling on the bed and does not have an expected value on the basis of simple flow configurations. The value of
 is negative before 30 August and positive after. The bed topography in the study region includes a low flow-parallel ridge in the center of the glacier valley, approximately under the flow center line, and rising in elevation with down-glacier distance below the upper icefall (Reference Welch, Pfeffer, Harper and HumphreyWelch and others, 1998). If this ridge forces lateral divergence of ice near the glacier bed, then on the left side of the bedrock ridge (facing down-flow) the cross-flow normal stress
 could be negative (as observed), with the shear stress
 also negative as ice is lifted on the right (closer to the center line) by the bedrock ridge. Changes in the value of
 could be a consequence of the passage of a bedrock feature of a smaller size than the bedrock ridge, or possibly a change in the spatial distribution of sliding arising from changes in basal hydrology.
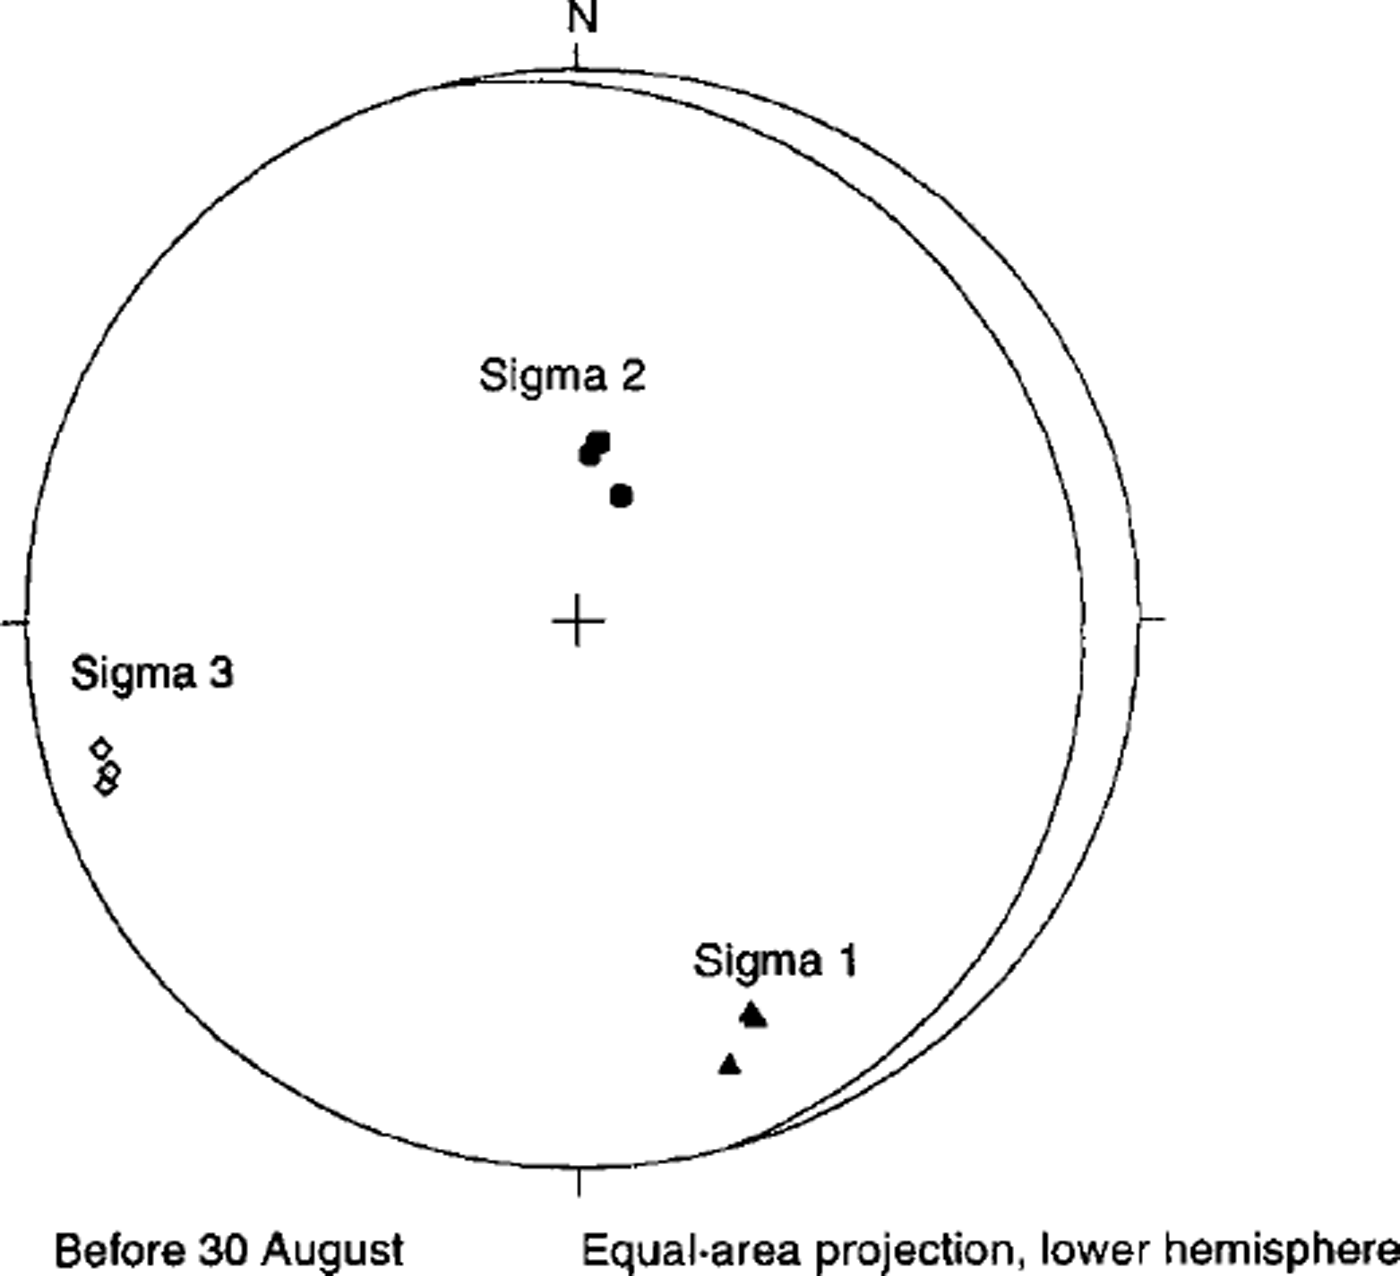
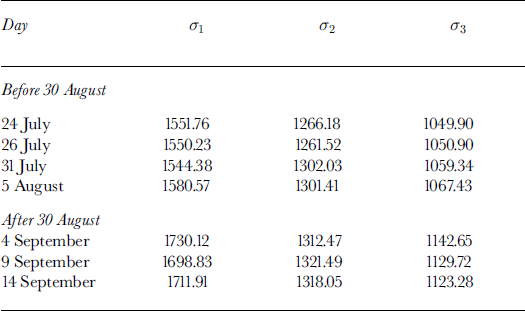
The principal non-deviatoric stress magnitudes are shown in Table 3, and principal-stress axis orientations for the period prior to 30 August are shown in Figure 4. The magnitudes and the orientations are nearly constant during the period of observation (variations in magnitude are approximately 1% of average value; average variation in orientation is 5°), and closely match the overall expected pattern of stress. Most of the differences seen in the stresses before and after 30 August are in the relative magnitude of the deviatoric-stress tensor terms, and do not appear as significant changes in the non-deviatoric principal-stress magnitudes.
Principal-stress orientations for the period prior to 30 August. Signal corresponds to direction of deviatoric principal compression; Sigma 3 corresponds to direction of deviatoric principal extension.
Principal-stress magnitudes (kPa)
7. Change in State of Stress Following 30 August
Figure 1 shows a transient increase in four of seven pressure signals occurring over a ^5 day period centered on 5 August. The sensors respond differently because the stress event constitutes a change in the stress tensor, not simply a uniform variation in mean stress. Following the 30 August transient, most of the pressure values stabilize at slightly higher values than observed before 30 August. As in the period prior to 30 August, the axial deviatoric stresses
 (cross-flow) are compressive and
 alcng-ffow) tensile, but both are larger in magnitude than before 30 August. The vertical axial deviatoric stress
 is consistently positive (tensile) following 30 August, and also greater in magnitude. Qualitatively, the axial stresses before and after 30 August indicate that strain rates undergo a transition to greater cross-flow, and compression, accommodated by higher values of along-flow and vertical extension.
The marginal shear-stress term
 remains positive, as expected, but is diminished in magnitude, indicating a reduced drag at the margin. The horizontal along-flow shear stress
 remains negative, also as expected, and also is diminished in magnitude, becoming less negative. The average magnitude of
 prior to 30 August is –73.35 kPa; after 30 August the average value is –16.63 kPa. The expected value of
 is –37 kPa, based on
 , using the values h= 120 m, α= 223. This difference between observed values and the expected value based on the assumption of simple laminar flow is large relative to the estimates of error in the determination of stress magnitude, and is interpreted as a deviation of the actual
 from simple laminar flow.
The cross-flow shear stress
 becomes positive in sign and smaller in magnitude following 30 August, corresponding to a transition from a counterclockwise to a clockwise moment about the y axis, facing down-flow The center-line subglacial ridge, described above, could be involved in this transition if some support by the ridge was lost during the 30 August transient (e.g. by flow down the backside of a bed obstacle), resulting in lowering of ice near the center line and a corresponding clockwise torsion left of the center line (looking down-flow).
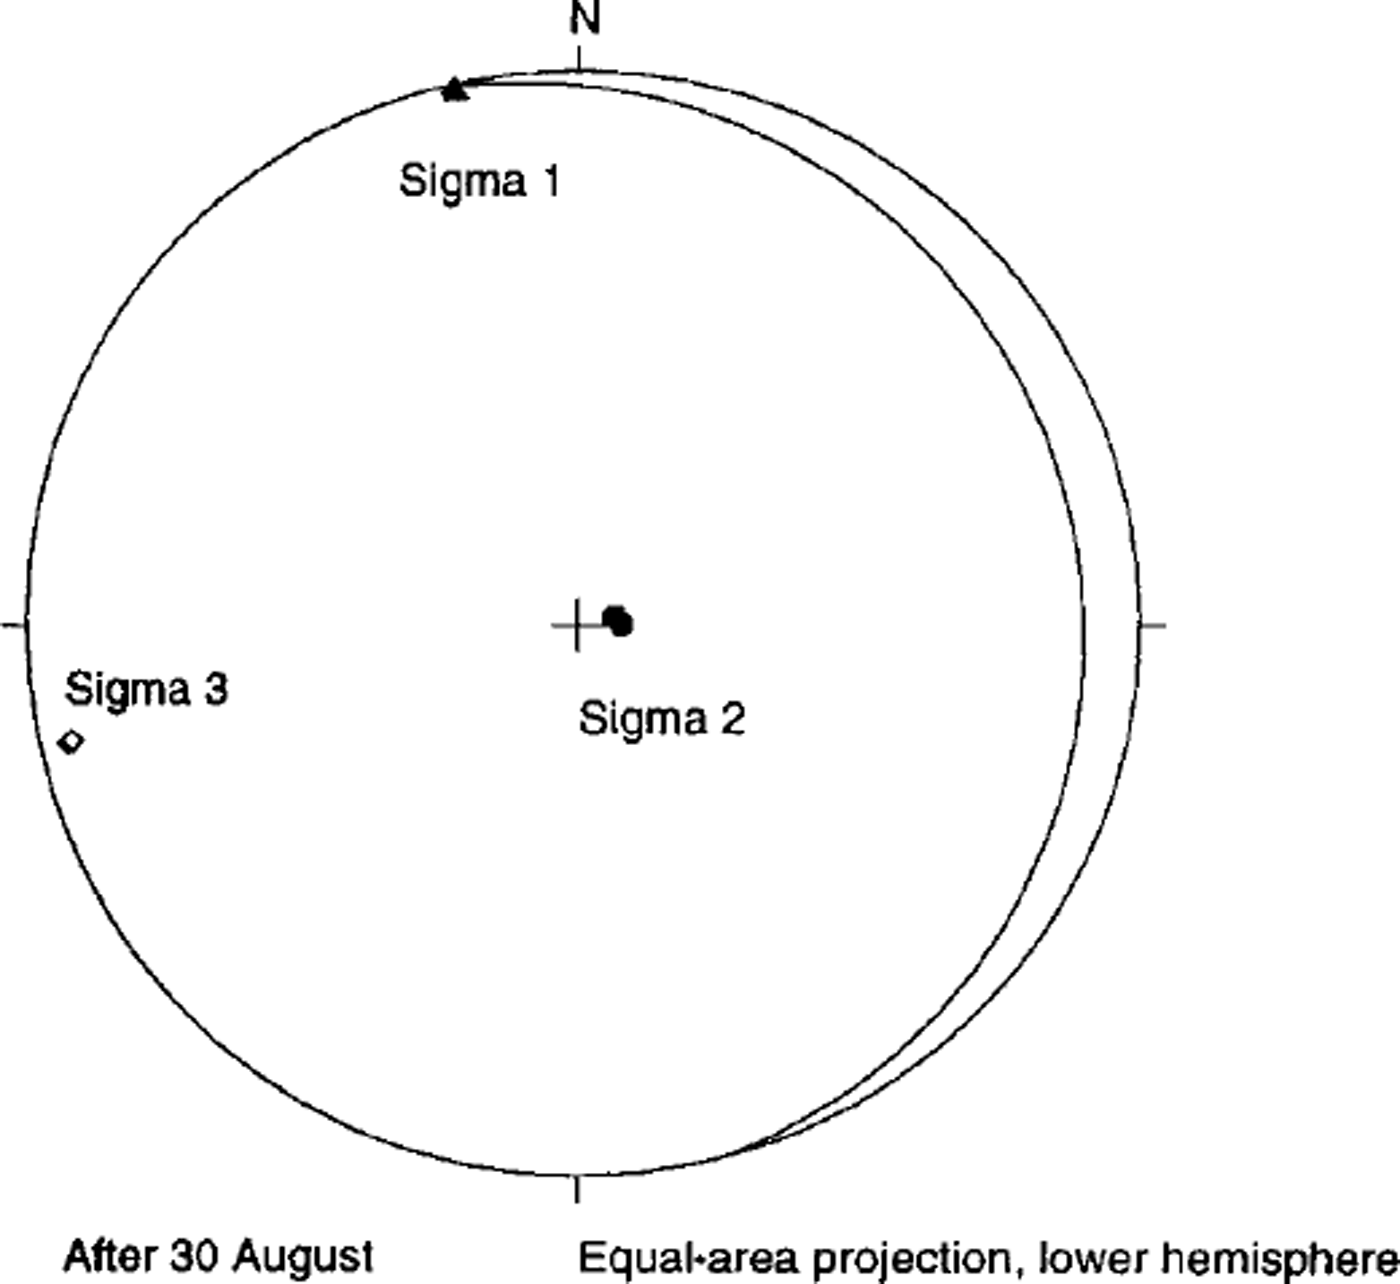
The changes described in the deviatoric stresses across the 30 August transient are not so pronounced in the principal stresses (Table 3): a, increases in magnitude following 30 August, σ2 declines slightly and σ3 increases slightly. A clearer change is evident in Figure 5 where the principal-stress orientations following 30 August are shown. The axes have rotated approximately 20° counterclockwise (looking down-flow) about an axis oriented approximately parallel to the a, direction and the flow direction. This change reflects the same change seen in the reversal of sign in the shear-stress term σxz from negative (clockwise) to positive (counterclockwise).
Principal-stress orientations for the period following August. Sigma 1 corresponds to direction of deviatoric principal compression; Sigma 3 corresponds to direction of deviatoric principal extension.
8. Discussion and Conclusions
The appearance of lateral compression and longitudinal extension at depth together with longitudinal compression and lateral extension at the surface would not be expected on the basis of a simple laminar-flow view of deformation, but might in fact be anticipated from the borehole inclinometery reported in Reference Harper, Humphrey and PfefferHarper and others (1998b). In the en-glacial ?tw-9.6pt>velocity fields inferred from measurements of deformation, it was reported that areas of faster flow exist in the up-glacier and down-glacier sections of the study area, and that these areas of higher velocity appear only in the uppermost 50–75 m of ice thickness. The location of the borehole stress measurements is at the transition from the up- glacier region of faster flow to the central region of slower flow. Near the surface, the velocity gradient at the surface is longitudinally compressive, but at depth where the region of faster flow is absent, the flow is longitudinally extensile. The velocity distribution near the borehole site can be seen most clearly in the central panel of figure 3 of Reference Harper, Humphrey and PfefferHarper and others (1998b). The upper part of the study region has yielded a number of other unusual results, including patterns of borehole deformation which suggest weak extrusion flow. The flow regime of this part of the glacier is evidently more complex than the gross geometry would indicate, probably because of the shape of the icefall above the study reach and the center-line bedrock ridge beneath. The icefall is concave up-glacier and has lobes on either side of the center line, shaped such that thicker and steeper ice comes into the study region on the flanks, compared to thinner ice leaving the base of the icefall at the center line. At the same time, the centerline ice of the study reach stands slightly above the flanks due to the center-line bedrock ridge. The net effect may be that lateral compression imposed by the extended flanks of the icefall is felt more at depth in the center of the glacier than at the surface where the elevated center-line ice is slightly isolated from the stresses imposed by the flanks. The additional compression imposed at depth could produce the lateral compression seen in the borehole measurements, and act to reduce the effective viscosity at depth through the influence of
 in the flow law. More extensive comparison of the stress measurements with the detailed borehole inclinometry is underway. Fully three- dimensional finite-element modeling would also be desirable, and is probably the most effective way to interpret the apparent interaction between stress components.
The change in
 before and after 30 August suggests complex and effective lateral coupling in the ice, although, on the basis of a measurement in one location only, it is hard to estimate a length scale for this coupling. Changes in
 (or any component of the stress) are undoubtedly common at small length scales near the boundary, but stress variations beneath some length scale are insignificant to the flow of the glacier. If the stress event causing the 30 August transient originated at the bed, then the fact that the event was observed some 65–70 m above the bed suggests that the length scale is comparable. However, we cannot at this stage rule out the possibility that the transient was a local artifact in some way connected with this prototype stress-sensor installation. The next tasks in our stress-measurement program will be to install a number of stress-sensor packages distributed in a volume of glacier ice of a length scale comparable to significant scales for glacier mechanics. Also needed are sensor arrays with greater redundancy than that provided by the nine-sensor array used here, so that sensor failures still leave more than the minimum number of six sensors. Finally, the technical problems of installation and mechanical coupling of the sensors to the ice are simplified to some degree by working in cold ice. Our next plans involve deployment of new stress-sensor packages in Greenland, where active freezing of the sensor arrays will be unnecessary.
Acknowledgements
This work was supported by U.S. National Science Foundation grants OPP-9531450 to W.T Pfeffer and OPP-9531565 and OPP-9531563 to N. F. Humphrey. We thank B. Korb and M. Brandemuehl of the Joint Center for Energy Management at University of Colorado Department of Civil, Environmental and Architectural Engineering for assistance with the design of the down-hole heat exchanger.



