Introduction
The continental shelf and slope region of the Ross Sea (Fig. 1) is the best sampled of the Southern Ocean due to its proximity to Scott Base (New Zealand) and McMurdo Station (USA), and its ice-free summer conditions. Winter sea ice formation in the open Ross Sea transforms Circumpolar Deep Water (CDW), drawn onto the Ross Sea continental shelf from the Antarctic Circumpolar Current, into High- and Low Salinity Shelf Waters (HSSW & LSSW, Orsi & Wiederwohl Reference Orsi and Wiederwohl2009), while interaction of HSSW with the deep glacial ice of the Ross Ice Shelf (RIS, Fig. 1) melts the ice shelf base to produce Ice Shelf Water (ISW, Jacobs et al. Reference Jacobs, Fairbanks and Horibe1985).
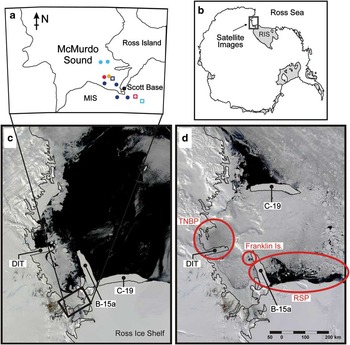
The study region and sea ice conditions. a. The locations of the various profiles collected within McMurdo Sound. Open squares and circles represent February and November datasets, respectively, and are colour coded as per their display in Fig. 4. The lower panels are MODIS satellite images of sea ice cover (location shown in b.) in the south-western Ross Sea on c. 20 December, and d. 12 December 2002 and identify the locations of icebergs B-15a and C-19, the Drygalski Ice Tongue (DIT), Franklin Island, and the typical regions of the Terra Nova Bay polynya (TNBP) and the Ross Sea polynya (RSP).

High Salinity Shelf Water formation in the Ross Sea is concentrated in two polynyas, which are regions of open water or thin ice in the sea ice cover. Heat flux between ocean and atmosphere, and hence new ice formation, is greatly enhanced within polynyas compared to regions of continuous ice cover. The Ross Sea polynya (RSP) forms year-round along the edge of the Ross Ice Shelf, in response to southerly winds flowing across the ice shelf and is most active in the south-west, near Ross Island (Fig. 1). Being more than an order of magnitude larger than any other perennial Antarctic or Arctic polynya (Arrigo & Van Dijken Reference Arrigo and van Dijken2003, Martin et al. Reference Martin, Drucker and Kwok2007), the RSP dominates regional sea ice formation, water mass conversion, ocean circulation and biological processes.
The RSP also very probably influences the behaviour of the nearby Terra Nova Bay polynya (TNBP, e.g. Van Woert Reference Van Woert1999). During winter, the TNBP (75°S, 164°E) is estimated at about one fifth the extent of the RSP (Kern Reference Kern2009), but is still capable of contributing up to 10% of total ice production on the Ross Sea continental shelf (Kurtz & Bromwich Reference Kurtz and Bromwich1985). It is formed by the combination of katabatic winds that move newly forming ice away from the coast, and the Drygalski Ice Tongue (DIT, Fig. 1) which forms the polynya's southern limit and blocks northward advection of ice into the area.
Ice formation in these polynyas serves three important functions of Ross Sea oceanography:
1) The east–west gradient across the continental shelf in sea ice formation gives rise to a similar gradient in ocean density, owing to the enhanced salt rejection within the polynas. The density gradient drives large-scale circulation on the Ross Sea continental shelf (Jacobs et al. Reference Jacobs, Giulivi and Mele2002) which intensifies through winter as the along-shelf density gradient steepens (Assmann & Timmermann Reference Assmann and Timmermann2005).
2) High Salinity Shelf Water, set at the surface freezing temperature by its formation process, is the densest water on the continental shelf, and is especially so in the vicinity of the RSP (Orsi & Wiederwohl Reference Orsi and Wiederwohl2009). High Salinity Shelf Water sinks to fill the deepest reservoirs in the open ocean and subice shelf cavities and is a key component of Antarctic Bottom Water. Therefore, the deep convection that occurs as a result of polynya activity is the mechanism by which variations in the salinity of CDW flowing onto the continental shelf are transmitted to the deep ocean (Jacobs et al. Reference Jacobs, Giulivi and Mele2002).
3) The early summer opening of the polynya areas promotes greatly enhanced biological activity (Arrigo et al. Reference Arrigo, van Dijken, Ainely, Fahnestock and Markus2002).
The oceanography of McMurdo Sound
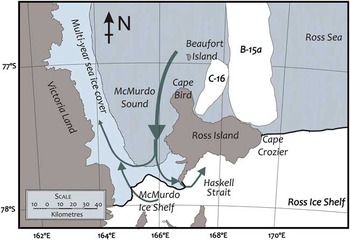
McMurdo Sound is located in the south-western corner of the Ross Sea and is bounded by Ross Island to the east, Victoria Land to the west, and the McMurdo/Ross Ice Shelf to the south (Fig. 2). It is not a true sound, being connected to the adjacent ice shelf cavity via Haskell Strait to the south. McMurdo Sound is c. 50 km wide, 80 km long, and features steep and rough bathymetry, a result of the volcanic activity that produced Ross Island.
The locations of icebergs C-16 and B-15a in 2003, and the known general circulation of McMurdo Sound. Modified from Robinson (Reference Robinson2012).

McMurdo Sound is an ideal location for observing processes of ice-ocean interaction: its eastern side acts as a conduit for flow from the RSP into the combined subice ocean cavity of the McMurdo and Ross ice shelves (Robinson et al. Reference Robinson, Williams, Barrett and Pyne2010). In the west, northward flows, typically ice laden and supercooled near the surface (e.g. Lewis & Perkin Reference Lewis and Perkin1985), are consistent year-round (Assmann et al. Reference Assmann, Hellmer and Beckmann2003), and must be considerable as they are required to maintain the salinity dome observed at 170°E (Jacobs & Giulivi Reference Jacobs and Giulivi1998). The resulting clockwise general circulation (Fig. 2) sets up an east–west density gradient within the sound. The strength of the circulation varies with the seasonal cycle of sea ice formation in the Ross Sea which in turn affects stratification in eastern McMurdo Sound.
Surface to mid-depth southward flow in the east is guided by topography to enter the McMurdo/Ross ice shelf cavity (Assmann et al. Reference Assmann, Hellmer and Beckmann2003, Dinniman et al. Reference Dinniman, Klink and Smith2007, Robinson et al. Reference Robinson, Williams, Barrett and Pyne2010), causing ice shelf basal melt in summer when relatively warm Antarctic Surface Water (AASW) (c. 1°C above freezing temperature) is drawn into the cavity (Jacobs et al. Reference Jacobs, Gordon and Ardai1979). During March and April, near surface flow in the east switches northward and out of the cavity (Leonard et al. Reference Leonard, Langhorne, Williams, Vennell, Purdie, Dempsey, Haskell and Frew2011, Mahoney et al. Reference Mahoney, Gough, Langhorne, Robinson, Stevens, Williams and Haskell2011). This is thought to result from large-scale changes in horizontal density gradients along the Ross Ice Shelf front (Assmann et al. Reference Assmann, Hellmer and Beckmann2003).
Typically, an ice shelf front presents a physical barrier to interaction between open water and subice shelf cavities through the step change in water column thickness (Grosfeld et al. Reference Grosfeld, Gerdes and Determann1997). However, the front of the McMurdo Ice Shelf is relatively thin (c. 20 m, McCrae Reference McCrae1984) and is accompanied by a bathymetric slope down into the subice shelf cavity (Horgan et al. Reference Horgan, Naish, Bannister, Balfour and Wilson2005). This allows for relatively unhindered flow between the open water of the Ross Sea and the common ocean cavity beneath the McMurdo and Ross ice shelves.
Modelling efforts (e.g. Assmann Reference Assmann2004, Dinniman et al. Reference Dinniman, Klink and Smith2007) have demonstrated the importance of flow through McMurdo Sound for ventilating the ice shelf cavity and the resulting production of ISW in the Ross Sea. This ocean pathway has also been observed with a series of instrumented moorings along the axis of the bathymetric channel (Robinson et al. Reference Robinson, Williams, Barrett and Pyne2010).
Vertical structures of temperature and salinity collected while the icebergs were in the Ross Sea (Robinson et al. Reference Robinson, Williams, Barrett and Pyne2010, Leonard et al. Reference Leonard, Langhorne, Williams, Vennell, Purdie, Dempsey, Haskell and Frew2011) show significant departures from typical seasonal profiles. They further demonstrate that the upper and lower water column (here defined to be separated at c. 200 m, corresponding to the approximate draft of B-15a, D. Blankenship in Martin et al. Reference Martin, Drucker and Kwok2007) had different responses to the iceberg-induced perturbation.
The icebergs of 2000–05
During 2000–02, a series of six giant icebergs calved from the Ross Ice Shelf into the Ross Sea. Iceberg B-15 calved from the region 165–175°W on 21 March 2000, and at c. 300 x 40 km, remains the largest iceberg on satellite record (Martin et al. Reference Martin, Drucker and Kwok2007). On 10 May, two months after calving, it broke in two with the pieces named B-15a and B-15b. During the remainder of 2000 B-15b exited the Ross Sea following the northward trajectories of B-17 (Martin et al. Reference Martin, Drucker and Kwok2007), part of the same calving event, and also that of B-9 which had calved from a similar location in 1987 (Keys et al. Reference Keys, Jacobs and Barnett1990).
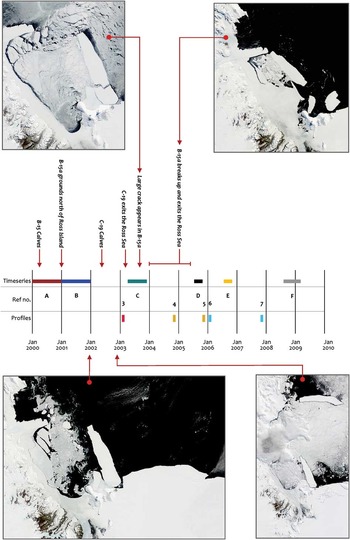
B-15a, under the influence of the westward flowing current, and following collisions with B-15b and the shallow Ross Bank seamount (see Martin et al. Reference Martin, Drucker and Kwok2007, Fig. 4), moved along the front of the Ross Ice Shelf until its western end became grounded against Ross Island in January 2001 (Fig. 3). During its westward traverse, further collisions with the ice shelf front produced the giant icebergs B-17, B-18, C-16, C-18, and C-19 (MacAyeal et al. Reference MacAyeal, Okal, Thom, Brunt, Kim and Bliss2008). After rotating through 90° B-15a became pinned against Ross and Franklin islands where it effectively formed the western limit of the RSP (MacAyeal et al. Reference MacAyeal, Okal, Thom, Brunt, Kim and Bliss2008). It remained there until its eventual break-up and release during 2004–05.
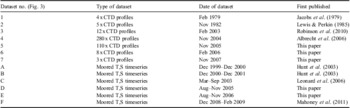
Timeline of collection of datasets used in this analysis in relation to events of the two massive tabular icebergs, B-15a and C-19. Datasets (timeseries and profiles) are colour coded as they appear in Figs 4 & 5.

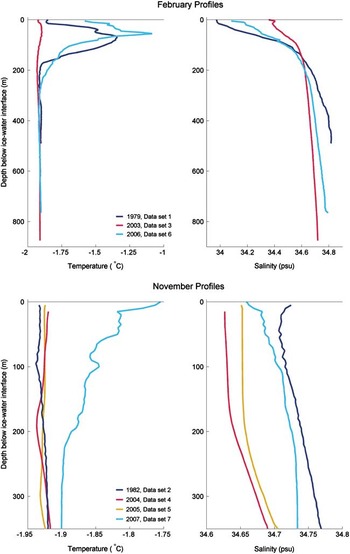
Water column profiles collected within a 20 km radius of Scott Base (see Fig. 1 for colour coded locations) during February (upper) and November (lower) in years prior to, during and after the icebergs event of 2000–05.

C-19 was the largest of the icebergs spawned by B-15a's collisions with the Ross Ice Shelf. It calved around 5 May 2002 between 170 and 180°E and directly into the most active section of the RSP (Martin et al. Reference Martin, Drucker and Kwok2007). It measured c. 30 x 200 km, which was slightly longer than B-15a (c. 180 km). Over the following approximately eight months, C-19 rotated and moved northward under the influence of ocean currents (Figs 1 & 3) eventually leaving the Ross Sea in July 2003 (Arrigo & Van Dijken Reference Arrigo and van Dijken2003).
Iceberg-induced changes to the operation of the Ross Sea and Terra Nova Bay polynyas
Both B-15a and C-19 had significant impacts on the normal operation of the RSP. As B-15a moved westward into the region of the RSP it initially reduced autumn polynya activity, and new ice production shifted to the north (i.e. downwind) of the iceberg (Martin et al. Reference Martin, Drucker and Kwok2007). However, after June 2000, together with icebergs B-17 and B-15b, B-15a contributed to a longer effective coastline, and so enhanced polynya activity throughout the rest of the winter (Martin et al. Reference Martin, Drucker and Kwok2007). After B-15a became pinned against Ross and Franklin islands during 2001 it had very little impact on the normal operation of the RSP - merely defining its western limit - until it broke up and moved northward in 2005.
In contrast, C-19 calved directly into the most active part of the RSP, trapping newly forming sea ice between itself and the ice shelf as it moved northward. Being a very large iceberg, its movement was dictated by ocean currents, independent of the wind which controls sea ice movement, so that a secondary polynya formed in its lee (Martin et al. Reference Martin, Drucker and Kwok2007, Kern Reference Kern2009), as though C-19 and the sea ice it trapped were a temporary extension of the ice shelf itself (Fig. 1). It is probable that this small polynya was responsible for anomalously saline water observed deep in the Drygalski trough early in 2003 (Gordon et al. Reference Gordon, Orsi, Muench, Huber, Zambianchi and Visbeck2009). Hence overall polynya size and new ice production for the Ross Sea were limited during the winter of 2002 (Martin et al. Reference Martin, Drucker and Kwok2007).
The 2002–03 summertime opening of the RSP was approximately six weeks later than usual and the summer sea ice was the heaviest on satellite record (Dinniman et al. Reference Dinniman, Klink and Smith2007). The combined influence of icebergs B-15a and C-19 (as described above) contributed to this anomalous behaviour (Arrigo & Van Dijken Reference Arrigo and van Dijken2003, Martin et al. Reference Martin, Drucker and Kwok2007). However, some of the 2003 perturbation has also been attributed to storminess (Brunt et al. Reference Brunt, Sergienko and MacAyeal2006), anomalous atmospheric effects (Harangozo & Connolley Reference Harangozo and Connolley2006) and warming (Tamura et al. Reference Tamura, Ohshima and Nihashi2008).
Connections between the sea ice, ice shelf and polynya regimes are complex, difficult to directly observe, and are not well represented in numerical climate models. Thus the icebergs provided a natural perturbation experiment of the oceanic connections between polynya operation, sea ice formation and ice shelf mass balance. In the following sections we first describe the various datasets used to assess the icebergs’ impact on the oceanography of the south-western Ross Sea. We then highlight the perturbations and changes in those data attributable to the icebergs’ influence, and describe various mechanisms to account for those changes and oceanographic signal transfer.
Methods
Investigation of the oceanographic impact of icebergs B-15a and C-19 has, to date, relied on inferences from iceberg positions, polynya state and sea ice coverage from satellite imagery (Arrigo & Van Dijken Reference Arrigo and van Dijken2003, Dinniman et al. Reference Dinniman, Klink and Smith2007, Martin et al. Reference Martin, Drucker and Kwok2007, Kern Reference Kern2009). This section describes in situ profiles of temperature and salinity collected during and subsequent to the icebergs’ presence in the Ross Sea, and their comparison with historical profiles collected from similar locations (Table I).
Sources of the various datasets used in this analysis. CTD = conductivity, temperature, depth. T,S = temperature, salinity.

All available temperature and salinity profiles collected between 1979 and 2009 from within a 20 km radius of Scott Base (Table I, Fig. 1) were sorted into summer (January–February) and late winter/spring (November) to provide seasonal interannual sequences. While profiles from other months were consistent with the mechanisms presented here, sampling was insufficient to provide interannual timeseries for other seasons. Taking into account sensor accuracy and drift, the maximum uncertainties in the recent (post-2002) profiles are 0.016 in salinity and 0.0006°C in temperature. In addition, several month-long timeseries of temperature and salinity were used to observe the different responses of the upper water column before, during and after the icebergs event (Table I). Full details of all instruments used are reported in Robinson (Reference Robinson2012).
Results
Here the observed oceanographic changes in McMurdo Sound are described and in the following sections, attributed to iceberg-induced perturbations and subsequent recovery.
Summertime observations in McMurdo Sound and Haskell Strait
During the height of summer (January/February) 2003, when icebergs B-15a and C-19 were both in residence, the warmest water observed beneath the McMurdo Ice Shelf was at the surface freezing point (Fig. 4, upper panel). The amount of freshening and very slight warming over the upper c. 100 m of the water column were reminiscent of typical summer inflow of AASW, but the upper water column was far too cool to be identified as such. By 2006, the temperature of the upper c. 200 m had recovered to be similar to the pre-iceberg profiles, including the observation of AASW in the upper c. 100 m.
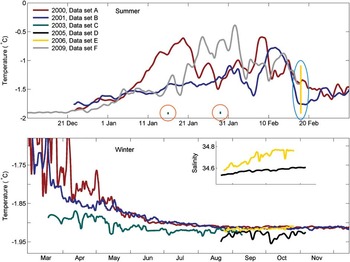
Similar changes to the upper water column were observed by Hunt et al. (Reference Hunt, Heofling and Cheng2003) between the summers of 1999–2000 and 2000–01. Their two year timeseries of thermistor data collected near McMurdo Station (Fig. 5, upper panel) showed an early summer warming pulse during December 1999–January 2000 that was apparently missing in the following year, by which time B-15a had grounded north of Ross Island. Although the timing of the summertime warm pulse was not captured in the 2003 timeseries (Fig. 5, lower panel), the surface water was clearly colder by the end of summer (March) than it had been in non-iceberg years. A summer warm pulse was again observed in the 2008–09 record of Mahoney et al. (Reference Mahoney, Gough, Langhorne, Robinson, Stevens, Williams and Haskell2011), which was captured three years after the icebergs had finally left the area.
Low-pass filtered (24 hr) timeseries of surface temperatures during various summers (upper) and winters (lower), before, during and after the icebergs event of 2000–05. Also shown are the temperature ranges of profiles collected at similar locations beneath the McMurdo Ice Shelf during February 2003 (dataset 3, circled in orange) and 2006 (dataset 6, circled in blue).

The profiles collected beneath the McMurdo Ice Shelf during summer 2003 (Fig. 4, upper panel) show that the surface water, in addition to being significantly colder than usual (by up to 1°C, described above), was also more saline than in non-iceberg years. This is consistent with the non-appearance in 2003 of warm, fresh AASW that would typically form seasonally in the RSP and be transported to McMurdo Sound. Conversely, the lower water column was less saline than historical profiles or profiles collected from the same site during summer 2006. Together, these anomalies contributed to a much more homogeneous, ‘winter-like’ water column beneath the ice shelf while both icebergs B-15a and C-19 were in residence. The simultaneous absence of both AASW in the upper water column, and HSSW in the deepest water during summer of 2003 is conspicuous, especially since both of these iconic water masses were again observed in the same location during summer 2006, when both icebergs had moved out of the area.
At depths greater than c. 200 m, the summer 2003 profiles (Fig. 4, upper panel) were significantly fresher than historical profiles. The densest water observed beneath the ice shelf at that time (S = 34.718) can be described as ‘super-fresh’ HSSW when compared to the range of values reported for the Ross Sea (Jacobs et al. Reference Jacobs, Giulivi and Mele2002). A recovery of salinity deeper than c. 200 m was apparent in February 2006, and the water below 700 m (S = 34.768) could be interpreted as constituting a reservoir of HSSW with properties consistent with the freshening trend. However, this did not fill the water column everywhere below 350 m as it had historically, indicating that the recovery may have been incomplete at that time.
Wintertime observations in McMurdo Sound
Surface temperatures immediately following B-15a's grounding north of Ross Island (January 2001), were not significantly cooler than the previous year, but had far less variability. This pattern was first observed as a missing ‘Ross Sea polynya signal’ (described above) in January, and continues into the onset of winter (late February through to early May; Fig. 5, lower panel), when there were far fewer warm excursions in the 2001 record than in the 2000 record.
Subice shelf profiles collected in January 2003 show that, after three years of B-15a's residence near McMurdo Sound, homogeneous winter-like conditions dominate year-round. Moving into winter, the surface waters of McMurdo Sound in 2003 were clearly cooler than normal with the surface freezing point attained as early as the beginning of April (Leonard et al. Reference Leonard, Langhorne, Williams, Vennell, Purdie, Dempsey, Haskell and Frew2011), compared to June in other years (e.g. Mahoney et al. Reference Mahoney, Gough, Langhorne, Robinson, Stevens, Williams and Haskell2011; Fig. 5, lower panel). The slight variability apparent throughout the 2003 temperature record is of excursions below the surface freezing point, indicative of export from the subice shelf ocean. Such influence appears consistent with other data from that time of year (e.g. Tressler & Ommundsen Reference Tressler and Ommundsen1962, Mahoney et al. Reference Mahoney, Gough, Langhorne, Robinson, Stevens, Williams and Haskell2011), but was more apparent than normal, as it appeared within an anomalously cooled and homogeneous water column.
Profiles collected in McMurdo Sound during November (very late oceanographic winter) 2004 (Fig. 4, lower panel) reveal that the entire water column was c. 0.10 fresher than ‘historical’ profiles collected in November 1982 (Lewis & Perkin Reference Lewis and Perkin1985). Of this difference, only 0.06 is attributable to the region-wide freshening trend (Jacobs et al. Reference Jacobs, Giulivi and Mele2002). This mirrors the summertime salinity ‘deficit’ observed beneath the McMurdo Ice Shelf in 2003 over that part of the water column not affected by the typical pulse of AASW (i.e. below c. 200 m as described above).
Recovery of deep water salinity in McMurdo Sound was underway by November 2005, and appears complete by November 2007 (Fig. 4, lower panel), by which time the deepest water (T = -1.91°C, S = 34.745) was recognizable as freshened HSSW, i.e. within the context of the region-wide freshening trend (Jacobs et al. Reference Jacobs, Giulivi and Mele2002). However, the upper c. 200 m of the water column was remarkably homogeneous in both temperature and salinity in November 2004 and November 2005, i.e. while B-15a remained in the south-western Ross Sea. The surface waters in November 2007 were warmer and more stratified than for November of other years, probably due to the six weeks early opening of the RSP that year (Dinniman et al. Reference Dinniman, Klink and Smith2007).
Discussion
The icebergs had a profound impact on the physical oceanography of the region while they were in residence, and follow-on effects for the marine ecosystem as a whole. We propose that the different responses of the upper and lower water column were due to distinct mechanisms separately attributable to each of the icebergs (summarized in Fig. 6): B-15a's effects appear limited to the surface water of McMurdo Sound and its connection to the ice shelf cavity through Haskell Strait. In contrast, C-19 seems to have impacted the wider and deeper Ross Sea region through its influence on the operation of the Ross Sea and Terra Nova Bay polynyas, and the resulting reduction and geographical shift in brine rejection from sea ice formation. Here we describe mechanisms of iceberg perturbation that together account for all of the observations described above.
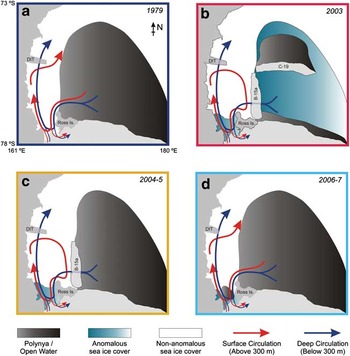
Schematic showing changes to local ice cover and circulation patterns through McMurdo Sound resulting from the presence of icebergs B-15a and C-19. Bounding box colour corresponds to timeline of profiles as shown in Figs 1 & 4. Features identified in b. include Ross Island, the Drygalski Ice Tongue (DIT) and icebergs B-15a and C-19.

B-15a effect: summertime changes to the upper water column
B-15a altered the geography of McMurdo Sound for the four years it remained grounded north of Ross Island, isolating the sound's surface waters from those of the greater Ross Sea (Fig. 6). In addition, much of the sea ice cover within McMurdo Sound was prevented from being blown out of the sound following its normal break-up, which allowed rapid reformation of the ice cover and shielding of the surface water from solar radiation (Remy et al. Reference Remy, Becquevort, Haskell and Tison2008).
The warm pulse (Fig. 5, dataset A) that was observed during summer 1999–2000 (prior to the calving of B-15) can be attributed to the typical seasonal advection of relatively warm, freshwater, including AASW, from the open water of the RSP. In the following year, blocking by B-15a prevented this signal from entering McMurdo Sound, and thus it was absent in the summer record of 2000–01 (Fig. 5, dataset B).
This shift in surface circulation caused a change in the melt/freeze regime of the McMurdo Ice Shelf. South of Ross Island, the ice shelf typically melts during summer, driven by the seasonal influx of AASW. However, during this period, in which no AASW was supplied, basal melt was significantly reduced, even switching to freezing conditions further downstream (Robinson et al. Reference Robinson, Williams, Barrett and Pyne2010). Recovery of this surface water was fast, returning to normal in the year immediately following B-15a's break-up. The speed of this recovery further supports the hypothesis that B-15a blocked inflow of AASW from the wider Ross Sea while it was located near Ross Island.
Onset of winter: evolution of the upper water column
Wintertime signals of process-driven variability were suppressed within McMurdo Sound during the whole period of B-15a's residence (Figs 4 & 5). The continued usual supply of low salinity water from beneath the ice shelf combined with the restriction of higher salinity water from the open Ross Sea, depressed the salinity of McMurdo Sound surface waters year after year. Rapid reformation of a substantial sea ice cover combined with physical blocking of surface advection by B-15a allowed vertical mixing driven by brine rejection from in situ winter sea ice formation within McMurdo Sound to dominate over the more variable inflow from the Ross Sea. This is seen in the very slight stratification present in November 2004 that was further eroded by November 2005 (Fig. 4, lower panel).
Flushing of cooler surface water out of western McMurdo Sound was reduced through the combined barriers of B-15a and the Drygalski Ice Tongue, with the retained surface water re-circulated within this semi-enclosed region, and giving rise to further homogenization. Interaction with the McMurdo Ice Shelf, the Drygalski Ice Tongue and B-15a on this circuit freshened and cooled the upper water column to below its surface freezing temperature. The resulting reduced density stratification made the eastern side of McMurdo Sound increasingly sensitive to intrusions of ISW. Such events are particularly prevalent in the 2005 August–November record (Fig. 5, dataset D), which also shows a very slight increasing salinity trend with little temporal variability.
Following the break-up and dispersal of B-15a, full communication with the Ross Sea was restored. This communication ‘reset’ McMurdo Sound's summertime upper water column structure - an annual function which had been absent for the previous five summers. The 2006 winter–spring (August–November) record (Fig. 5, dataset E) shows a significant increase in salinity compared to 2005, resulting from the resumed summer surface influx which overwrote the ISW redistribution. The associated increase in density stratification allowed the 2006 record to become dominated by salinity variations superimposed on an increasing trend. Both the background trend and temporal variability in the 2006 record represent signals of wintertime sea ice growth in the Ross Sea which were transported to McMurdo Sound.
C-19 effect: changes to lower water column
The observed salinity changes in the lower water column can be attributed to the anomalous sea ice conditions that resulted from C-19's impact on the operation of the RSP (Figs 1 & 6). C-19 calved into the most active region of the polynya near the beginning of the sea ice growth season, and continued its disruption of polynya activity throughout the winter of 2002. Thus, overall new ice growth in the RSP was significantly reduced during that winter, while the ice that did form was concentrated in a small polynya operating in the lee of the northward-moving iceberg.
Therefore the salt deficit observed between 2003 and 2007 in McMurdo Sound stems from a twofold disruption to a single year's ice growth. Firstly, vastly reduced ice production in the Ross Sea during 2003 led to reduced overall rejected brine and HSSW formation. Secondly, the ice that was produced during 2003 was concentrated northward from its typical formation region, allowing much of the HSSW formed in that year to be lost northward over the continental shelf break rather than to flow southward through McMurdo Sound and into the ice shelf cavity.
Typically, the basins of McMurdo Sound and Haskell Strait, which extend deeper than 900 m in places (Pyne et al. Reference Pyne, Ward, MacPherson and Barrett1985, Horgan et al. Reference Horgan, Naish, Bannister, Balfour and Wilson2005), are seasonally flushed and renewed with HSSW from the RSP that ultimately flows through to the sub-Ross Ice Shelf ocean cavity. However, reduced brine rejection from limited sea ice formation while C-19 was in residence led to a lower salinity version of HSSW being produced in 2002, and was observed as a salt deficit and subsequent recovery throughout the water column the following summer (Fig. 4).
Although ice production in the RSP was restored to typical levels following C-19's exit from the Ross Sea, the recovery of salinity throughout the water column of McMurdo Sound occurred over several years (Fig. 4, lower panel). High Salinity Shelf Waters freshened according to the region-wide freshening trend (Jacobs et al. Reference Jacobs, Giulivi and Mele2002) was observed in the deepest water in February 2006 and November 2007 (Fig. 4), although it is not clear whether or not recovery can be considered complete at that time.
The critical timing of the C-19 event
Although C-19 was resident for only nine months (May 2002–January 2003), the timing of the episode was crucial: C-19 calved and moved away from the ice shelf at a time when the sea ice cover was thin and allowed the iceberg unhindered passage northward. As it advanced, newly forming sea ice built up between C-19 and the Ross Ice Shelf and was prevented from northward advection by the physical blocking of C-19 (Figs 1 & 3). This significantly reduced new ice production and HSSW formation south of the iceberg's position, which is typically the most active region of the RSP, for that year.
By the time C-19 calved, the waters of McMurdo Sound had been ‘preconditioned’ by B-15a's presence, which allowed the C-19 influence to become more readily apparent than it might otherwise have been. By blocking variable signals from the Ross Sea and recirculating surface waters within the sound (Fig. 6), B-15a caused homogenizing of the water column that allowed the C-19 salt deficit to appear as a real signal that might otherwise have been lost in the noise.
Finally, the interaction of the two icebergs themselves may have been critical in generating C-19's influence on the regional oceanographic system. Firstly, it was a collision of B-15a with the Ross Ice Shelf that initially spawned iceberg C-19. However, that iceberg would probably have calved soon anyway, since a major crevasse distinguishing it from the Ross Ice Shelf proper was already apparent in satellite images (Joughin & MacAyeal Reference Joughin and MacAyeal2005).
More significant is that B-15a was already occupying the iceberg ‘parking lot’ north of Ross Island created by regional atmospheric surface pressure gradients (Turnbull Reference Turnbull2010, and references therein). B-15a was also just long enough to span the distance between Ross and Franklin islands (Fig. 1), allowing it to remain in place until it broke into smaller pieces several years later. In this, B-15a is almost unique among icebergs known to have entered the south-western Ross Sea, with the sole exception of C-19, which was slightly longer than B-15a itself. Therefore it is possible to surmise that, had B-15a not already grounded there, the presiding atmospheric pressure gradients would have guided C-19 into that same position. In that case, it would have had the minimal impact on RSP operation that B-15a ultimately had (2001–05) rather than disrupting the operation of the world's largest polynya and HSSW formation region.
The Haskell Strait gateway to the ice shelf cavity
The oceanic perturbation by the icebergs demonstrated McMurdo Sound's sensitivity to Ross Sea processes. It also demonstrated that McMurdo Sound provides an important connection between the open Ross Sea and the ocean cavity beneath the Ross Ice Shelf via Haskell Strait.
Much of the typical inflow from the wider Ross Sea to the surface waters of eastern McMurdo Sound was reduced by physical blocking by B-15a. It was replaced with water below the surface freezing point, which was recirculated within the sound having exited the ice shelf cavity in the western sound, from where it would normally exit to the north. However, during B-15a's residence, that pathway for surface water was restricted, as explained above (see Fig. 6).
The profiles collected beneath the McMurdo Ice Shelf in summer 2003 and 2006 show that signals from the open Ross Sea are normally transmitted to the sub-McMurdo Ice Shelf cavity via McMurdo Sound. They reveal an average of 54% depletion in sensible heat available for basal melt (i.e. temperature above in situ freezing temperature) over the upper 400 m of the water column with the icebergs in place (2003) compared to after both icebergs had gone (2006). The changes decreased with depth: reduction by 90% (0–100 m), 60% (100–200 m), 23% (200–300 m), 10% (300–400 m), with upper values (0–200 m) implying significant changes to the local basal melt regime. However, the deeper values (> 200 m) were probably within the range of interannual variability, indicating less significant change in melting of the more distant Ross Ice Shelf front, which is c. 200 m thicker in the zone connecting the Ross and McMurdo ice shelves.
Impact on deep ice shelf circulation and melt
Typically, with similar annual levels of sea ice production in the Ross Sea, the deep reservoirs of HSSW beneath the Ross Ice Shelf can be annually flushed and replenished. However, with the low salinity HSSW production of 2002–03, the newly formed water may have been insufficiently dense to perform this function. Instead it would have sunk to a shallower point of neutral buoyancy, bolstering the HSSW reserves while maintaining its surface freezing point temperature and potential to melt ice at depth. This could then bring HSSW into contact with the base of the ice shelf over a greater surface area than normal, leading to increased melt deep under the ice shelf.
Dinniman et al. (Reference Dinniman, Klink and Smith2007) used a numerical model to compare ocean conditions during ‘climatological’ and iceberg years. In accordance with the interpretation of the deeper observations outlined above, the model predicted an average increase in Ross Ice Shelf basal melt. However, in the model this was due to faster recirculation within the ice shelf cavity that relied on production of anomalously saline HSSW. This result seems counter-intuitive when considering the observed reduction in new sea ice production (Arrigo & Van Dijken Reference Arrigo and van Dijken2003, Martin et al. Reference Martin, Drucker and Kwok2007) and is in direct contrast to the observations reported here.
The discrepancy may be partly resolved by the northward displacement of the polynya during the period (Martin et al. Reference Martin, Drucker and Kwok2007, Gordon et al. Reference Gordon, Orsi, Muench, Huber, Zambianchi and Visbeck2009), but some significant differences remain. For example, the model shows no significant change in surface heating or cooling with heavy sea ice cover, suggesting that challenges remain in the numerical representation of polynya activity.
Operation of the Terra Nova Bay polynya
It is clear that iceberg C-19 exerted major influence on the operation of the RSP during winter 2002, but effects on the nearby TNBP are not as well documented. Being the much larger of the two, the RSP is thought to influence the operation of the TNBP, with a suggested inverse relation in ice and dense water production between the two polynyas (Van Woert Reference Van Woert1999). Thus if the RSP suffered a major shutdown, as it did in 2002, the TNBP could be expected to respond by producing greater volumes of ice and dense water than normal.
Long-term moorings revealed anomalously saline HSSW in the troughs connecting the Terra Nova Bay region with the deep ocean beyond the continental shelf break during summer and autumn 2003 (Gordon et al. Reference Gordon, Orsi, Muench, Huber, Zambianchi and Visbeck2009) - coincident with the observation of anomalously fresh HSSW in southern McMurdo Sound and Haskell Strait (Robinson et al. Reference Robinson, Williams, Barrett and Pyne2010). The inferred increase in rejected brine volume north of the RSP may result either from the northward shift of that polynya's ice formation region by C-19, or to increased ice production within the TNBP, although due to the close proximity of the two polynyas, particularly in that year, the two mechanisms are not easily distinguishable.
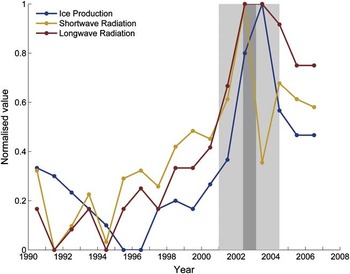
From a 17 year timeseries of meteorological data re-analysis (Fig. 7, Fusco et al. Reference Fusco, Budillon and Spezie2009) it is apparent that there was a major shift in TNBP activity beginning around the time that the icebergs were resident in the Ross Sea. From that record there appears to have been extensive ice cover in 2002, indicated by the highest shortwave radiation value of the timeseries, despite the apparently warm air temperatures. Fusco et al. (Reference Fusco, Budillon and Spezie2009) attributed this to variations in offshore winds. However, the timing is consistent with the stable and unbroken ice cover stretching between the Ross Ice Shelf and iceberg C-19 as it advanced to the north. Fusco et al. (Reference Fusco, Budillon and Spezie2009) noted the large interannual variability of the TNBP activity and attributed this to changes in the speed and temperature of offshore winds. However, by considering only atmospheric data in the controlling mechanisms, they have been unable to assess the ocean's contribution to this variability, including the role that two very large tabular icebergs in close proximity to the polynya would play.
Annual mean values (1990–2006) for the shortwave radiation, longwave radiation, and ice production transport estimated for the Terra Nova Bay polynya (TNBP). All data have been extracted from Fusco et al. (Reference Fusco, Budillon and Spezie2009) and have been presented here normalized between maximum and minimum values for the timeseries. Shading identifies the periods where icebergs B-15a (light grey) and C-19 (dark grey) were present.

In the Fusco et al. (Reference Fusco, Budillon and Spezie2009) record C-19's influence on the TNBP carries over into 2003, for which the highest longwave, sensible heat and ice production records of the timeseries were made. It is noteable that 2003 also saw a very large drop in shortwave energy, which signifies open ocean conditions, indicating that the polynya was active at that time. Their record also shows that the TNBP appears to have shifted to a state of greater ice production after the period of the icebergs’ perturbation, compared to the 12 years prior. It is not possible to determine whether this is a permanent shift, but it could well be a temporary response to colder, fresher water being exported from western McMurdo Sound while the sound recovers from the icebergs’ perturbation.
Regional deep water formation and pathways
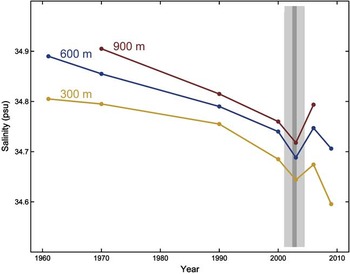
C-19 is known to have reduced RSP activity, resulting in reduced HSSW formation at that time. Not only were the deep waters starved of salt, leading to a salt ‘deficit’ throughout the water column, but the system was isolated from the variability in surface waters. Hence, shutting down the RSP impeded the mechanism that transmits surface signals to depth over the nine months of C-19's residence. Resumption of the RSP's normal operation has led to the recovery of the deep waters towards their historical salinities. However, because of the background freshening trend (Jacobs et al. Reference Jacobs, Giulivi and Mele2002), on which this event was a significant perturbation, it is not clear whether or not this process is complete to date (Fig. 8).
Timeseries of summer salinity measurements at three depths over five decades. The effect of the icebergs (2000–05) is apparent as a perturbation on the Ross Sea freshening trend reported by Jacobs et al. (Reference Jacobs, Giulivi and Mele2002) from which the 1970, 1990 and 2000 data were extracted. Shading identifies the periods where icebergs B-15a (light grey) and C-19 (dark grey) were present. Data from 1961 are from Tressler & Ommundsen (Reference Tressler and Ommundsen1962).

A ‘southern branch’ of deep water flow, emanating from TNBP, was previously thought to exist, supplying HSSW to the Ross Ice Shelf cavity via McMurdo Sound (e.g. Fusco et al. Reference Fusco, Budillon and Spezie2009). However, the opposite sign of the coincident HSSW salinity anomalies in Terra Nova Bay and southern McMurdo Sound identified here implies that there was no transport of deep water from Terra Nova Bay to McMurdo Sound at that time. This is despite the alignment of B-15a, which, if it had any influence on deep circulation, should have enhanced such flow. The low salinity anomaly observed at the same time in the eastern RSP (Gordon et al. Reference Gordon, Orsi, Muench, Huber, Zambianchi and Visbeck2009) further identifies the RSP as the source region for McMurdo Sound.
Combined, the Terra Nova Bay and Ross Sea polynyas contribute to high concentrations of dense waters on the western Ross Sea continental shelf. The resulting gradient in deep water density gives rise to circulation along the Ross Ice Shelf front. The changes in both polynyas due to C-19 may also have created a short-term perturbation to this larger-scale circulation, but quantifying that possibility lies beyond the scope of this investigation.
Impact on regional marine ecosystem
Typically, the opening of the RSP in summer provides an opportunity for warming of surface waters and intense phytoplankton blooms. As a result of this activity the south-western Ross Sea is one of the most biologically productive regions in the Southern Ocean. From satellite observations, Arrigo & Van Dijken (Reference Arrigo and van Dijken2004) established that 76% of sea ice extent for the south-western Ross Sea can be explained by a Multivariate ENSO Index. They go on to show that this relationship breaks down if the 2000–01 B-15a year is included. Primary production in the RSP for that year was delayed and reduced by 50–75% (Seibel & Dierssen Reference Seibel and Dierssen2003), in a similar manner to the strong El Niño year of 1997–98, despite 2000–01 being a weak La Niña year (Arrigo & Van Dijken Reference Arrigo and van Dijken2004).
Two years later, during C-19's interruption to the RSP, phytoplankton blooms suffered even greater reduction relative to normal years. The 90% reduction in primary productivity reported by Arrigo & Van Dijken (Reference Arrigo and van Dijken2003) confirmed their earlier finding that icebergs can have severe negative impacts at the base of the polar marine ecosystem. Such interruptions cascade through the trophic levels, with some mollusc species severely reduced or absent altogether in McMurdo Sound (Seibel & Dierssen Reference Seibel and Dierssen2003).
In addition, physical changes to the seasonal sea ice cover brought about by the icebergs disrupted nesting patterns of Adelie penguins at Cape Bird (Fig. 2, Cockrem et al. Reference Cockrem, Potter and Candy2006), and destroyed the breeding habitat and foraging routes of Emperor penguins at Cape Crozier (Fig. 2, Kooyman et al. Reference Kooyman, Ainley, Ballard and Ponganis2007), leading to the colony's complete failure in 2001. In the years following the icebergs’ perturbation, chick production was reduced to 40% and 6% of 2000s count at Cape Crozier and Beaufort Island (Fig. 2), respectively (Kooyman et al. Reference Kooyman, Ainley, Ballard and Ponganis2007).
A similar long-term effect was not apparent for McMurdo Sound's population of Weddell seals, whose numbers were depressed during the iceberg years, but which completely rebounded as soon as the icebergs had moved on (Ainley et al. Reference Ainley, Ballard and Olmastroni2009). This difference in response seems to indicate that the more mobile species suffered far less iceberg-induced disruption than land dependent ones, and implies that the ‘cascading trophic impacts’ described by Siebel & Dierssen (2003) were limited to the south-western Ross Sea.
Conclusions
The complexity of Antarctic coastal processes should not be underestimated. Sea ice formation and water mass creation in the Polar Regions are highly sensitive to ocean conditions, especially in waters very close to the in situ freezing point. In these processes polynyas are particularly significant, being localized and seasonal sources of strong signals in surface fluxes. They represent a connection between atmospheric forcing at the coast and ocean response. Thus when the terrestrial, or ice shelf, topography changes, in this case by iceberg calving, the ocean system must respond.
The observations presented here have identified two distinct oceanographic responses separately attributable to two giant icebergs present in the Ross Sea during the period 2000–05. B-15a caused a shift in surface circulation patterns by blocking communication between McMurdo Sound and the wider Ross Sea. Conversely, C-19 induced changes in deep water formation processes. The anomalously low salinities observed below 200 m in McMurdo Sound and Haskell Strait resulted from sea ice formation in the RSP either shutting down or moving northward after C-19 calved.
The observations revealed that there was no transport of HSSW from Terra Nova Bay to southern McMurdo Sound. They also indicate timescales of recovery to the iceberg-induced salinity anomaly: the surface water appeared to recover immediately after B-15a left, a result of circulation patterns returning to normal, while deep water formation processes took at least three to four years to recover after C-19 left.
Calving of massive icebergs from the Ross Ice Shelf, although not previously captured by satellite, have probably occurred every 30–50 years in order to have maintained a stable front position for at least 8000 years (McKay et al. Reference McKay, Dunbar, Naish, Barrett, Carter and Harper2008), perhaps producing ocean anomalies, such as have been demonstrated here, each time. These calving events and associated sea ice-ocean perturbations could increase in frequency if ice shelf dynamics change under warming climate scenarios. Such changes would also have flow-on effects for the regional marine ecosystem (e.g. Seibel & Dierssen Reference Seibel and Dierssen2003, Arrigo & Van Dijken Reference Arrigo and van Dijken2004), the stability of the Antarctic ice sheet (Kenneally & Hughes Reference Kenneally and Hughes2006), and the role of icebergs in delivering glacial meltwater to the Southern Ocean (Silva et al. Reference Silva, Bigg and Nicholls2006).
Acknowledgements
The authors gratefully acknowledge the generous provision of datasets by Nicole Albrect, Craig Stevens, Lionel Carter, Christina Cheng, Greg Leonard, and Andy Mahoney. Logistical support was provided by Antarctica New Zealand through events led by Tim Haskell and Alex Pyne. We wish to thank the anonymous reviewer for their thoughtful review and positive comments. Valuable comments on previous versions of this manuscript have been made by Stan Jacobs, Claudia Guilivi, Craig Stevens, Pat Langhorne and Inga Smith. The work was funded through a University of Otago Postgraduate Scholarship and the New Zealand Foundation for Research, Science and Technology.