





1. Introduction
Deeper understanding of the physics of oscillatory flow past a solid vertical cylinder mounted on a channel bed is useful for several engineering applications. Such a flow serves as a canonical test case for understanding sediment erosion mechanisms and the relationship between the unsteady forcing of the approaching flow and the capacity of the flow to induce sediment entrainment and local scour around piles placed in marine environments. As such, a main application is related to safe design of monopile foundations of offshore structures (e.g. wind turbines). Of particular concern is the local scour that can erode the seabed around the base of a foundation due to the action of waves and/or tidal currents. Depending on the flow conditions in the field, scour holes with maximum depths of several metres can develop over a short period around offshore foundation structures. Use of a rock-armour apron around the base of the pile is by far the most common scour protection measure for this type of structure (Louwersheimer, Verhagen & Olthof Reference Louwersheimer, Verhagen and Olthof2009; Petersen et al. Reference Petersen, Sumer, Fredsøe, Fuhrman and Christensen2014). Designing the apron in terms of its size and the mean diameter of the rock to be used requires accurate information on the maximum bed shear stress and the positions of the regions of high bed shear induced by the unsteady flow before scour begins (e.g. for flat-bed conditions around a monopile). Knowledge of the unsteady forces acting on the submerged part of the structure is essential for both strength and fatigue design of offshore wind turbines. Other applications include understanding transport processes and ecological implications for isolated emerged plant stems in shallow coastal waters, understanding heat transfer for heat exchangers in marine environments and quantifying fatigue damage by wave-induced loads for the columns of semi-submersible platforms in marine environments (Kamsanam Reference Kamsanam2014; Liu et al. Reference Liu, Li, Yi and Chen2016; Zang, Tang & Nepf Reference Zang, Tang and Nepf2017). In such applications, the approaching flow generally has a strong oscillatory component due to waves or other unsteady flow conditions in the marine environment.
The case of a surface-mounted, emerged, circular solid cylinder in steady incoming flow with flat and deformed (e.g. scoured) bed has been the object of detailed experimental and numerical studies focusing on the dynamics of the large-scale coherent structures (e.g. see Dargahi Reference Dargahi1989; Sumer & Fredsøe Reference Sumer and Fredsøe1997; Akili & Rockwell Reference Akilli and Rockwell2002; Roulund et al. Reference Roulund, Sumer, Fredsøe and Michelsen2005; Kirkil & Constantinescu Reference Kirkil and Constantinescu2009, Reference Kirkil and Constantinescu2012, Reference Kirkil and Constantinescu2015; Apsilidis et al. Reference Apsilidis, Diplas, Dany and Bouratsis2015; Baykal et al. Reference Baykal, Fuhrman, Sumer, Jacobsen and Fredsøe2015, Reference Baykal, Sumer, Fuhrman, Jacobsen and Fredsøe2017). These studies have shown that at conditions corresponding to the start of the bed scouring process (e.g. flat-bed conditions), scour is driven by the flow acceleration around the sides of the cylinder and by the horseshoe vortex system forming around the upstream base of the cylinder. Though the coherence of the horseshoe vortices is highly variable in time, the main horseshoe vortex is always present in the flow fields if the degree of bluntness of the cylinder is sufficiently high. The large erosion potential of the horseshoe vortex system even for flat-bed conditions was explained by the fact that the main horseshoe vortex is subject to large-scale bimodal oscillations (Simpson Reference Simpson2001; Kirkil & Constantinescu Reference Kirkil and Constantinescu2015). The core of the vortex undergoes sweeping, low-frequency motions towards and away from the upstream face of the cylinder. As a result, the size of the region where high bed shear stresses and sediment entrainment are induced at different times in the instantaneous flow fields is much larger compared with that expected for a relatively stable main horseshoe vortex that is subject only to small oscillations around its mean-flow position.
The same studies showed that the presence of the channel bed had a noticeable influence on the billow vortices shed in the wake. While for flat-bed conditions, the anti-symmetric vortex-shedding mode was present (similar to the von Kármán vortex street for long cylinders), the cores of the wake vortices were vertical only close to the free surface. Near the bed, the cores of the wake vortices were stretched and became inclined with respect to the vertical, which decreased their overall capacity to induce large bed shear stresses. Another important effect was observed at high Reynolds numbers where the attached boundary layers on the circular cylinder were turbulent before separation (supercritical Reynolds numbers) and the flow separated at polar angles larger than 100°. Close to the bed, where the approaching velocity is small due to the bottom boundary layer, the flow separated at about 90° and the vortex shedding resembled that observed for long cylinders at subcritical Reynolds numbers. Wake vortices generated for subcritical flow conditions have a much-reduced capacity to induce large bed shear stresses compared with vortices generated for cases where the separation line is vertical until the bed (e.g. for rectangular and square cylinders, see discussion in Kirkil & Constantinescu Reference Kirkil and Constantinescu2009) and to entrain particles from the channel bed. Finally, the presence of the channel bed also induced strong three-dimensional (3-D) effects at the back of the cylinder where a pair of streamwise-oriented, counter-rotating vortices formed. These vortices were shown to play an important role in the weakening of the anti-symmetric mode especially once the scour hole starts developing (Kirkil, Constantinescu & Ettema Reference Kirkil, Constantinescu and Ettema2009).
The structure of oscillatory flow around a surface-mounted cylinder and the dynamics of the large-scale coherent eddies were less investigated. The dynamics of both the wake flow on the downstream (lee) side of the cylinder and of the horseshoe vortices forming around the upstream face of the cylinder is much more complex compared with the case of an incoming steady current (Sumer, Christiansen & Fredsøe Reference Sumer, Christiansen and Fredsøe1997; Baykal et al. Reference Baykal, Sumer, Fuhrman, Jacobsen and Fredsøe2017). Similar to the simpler case of oscillatory flow around a long cylinder parallel to the free surface or of an oscillating long cylinder in steady flow (e.g. see Keulegan & Carpenter Reference Keulegan and Carpenter1958; Sarpkaya & Issacson Reference Sarpkaya and Issacson1981; Williamson Reference Williamson1985; Obasaju, Bearman & Graham Reference Obasaju, Bearman and Graham1988), the Keulegan–Carpenter number, KC = UmT/D (T is the period of the oscillatory flow, Um is the maximum depth-averaged streamwise velocity at large distances from the cylinder, D is the cylinder diameter), is the main parameter that determines the structure of the wake flow and the number of vortices shed over each half-cycle (Sumer et al. Reference Sumer, Christiansen and Fredsøe1997). As opposed to the case of an incoming steady current, horseshoe vortices are present only over part of the oscillatory cycle and only for sufficiently high KC numbers. In the case where the cylinder is placed on a loose bed, the wake vortices may have a larger capacity to entrain particulates and induce local scour compared with the horseshoe vortices (Sumer et al. Reference Sumer, Christiansen and Fredsøe1997).
Given the importance of protecting foundations of wind turbines and bridge piers against excessive local scour in marine environments, the focus of most of the previous experimental and numerical investigations was on predicting the scour evolution and the equilibrium scour bathymetry around surface-mounted vertical piles and investigating the efficiency of different scour protection measures (e.g. rock armour). Some investigations focused on predicting the decrease of the scour hole as a result of reducing the amplitude of the waves approaching the pile, a process called backfilling (Sumer et al. Reference Sumer, Chua, Cheng and Fredsøe2003). Three-dimensional Reynolds-averaged Navier Stokes (RANS) investigations were quite successful in predicting the temporal evolution of the scour hole at foundations of offshore structures starting either with an initially flat bed or with a scoured bed in the case of backfilling (Stahlmann Reference Stahlmann2014; Baykal et al. Reference Baykal, Sumer, Fuhrman, Jacobsen and Fredsøe2017). However, no numerical study based on large-eddy simulation (LES) techniques that can accurately capture the unsteady dynamics of the energetically important coherent structures in the flow was conducted for surface-mounted vertical cylinders in oscillatory flow. For example, unsteady RANS (URANS)-based models cannot capture the aperiodic oscillations of the main horseshoe vortices forming around the upstream face of a cylinder placed in a steady current. Though URANS was shown to correctly capture the dependence between the number of wake vortices shed at the back of a cylinder in oscillatory flow and the KC number (Baykal et al. Reference Baykal, Sumer, Fuhrman, Jacobsen and Fredsøe2017), some discrepancies between the RANS predictions of the bed shear stresses and the experimental data were present. In general, RANS accuracy is less than that of LES, or similar eddy-resolving techniques, in terms of predicting the mean-flow quantities in complex turbulent flows. Moreover, there is much evidence that RANS is less accurate than LES in terms of capturing the dynamics of the vortex tubes in the separated shear layers, the coherence of the shed vortices and the complex interactions among coherent structures generated around a surface-mounted bluff body (e.g. see Kirkil & Constantinescu Reference Kirkil and Constantinescu2009; Keylock, Constantinescu & Hardy Reference Keylock, Constantinescu and Hardy2012). So, LES-based techniques are better suited to investigate the flow physics and the role of large-scale turbulence in such flows.
Away from the channel bottom, the oscillatory wake flow past a surface-mounted cylinder is very similar to the oscillatory wake flow past a long, isolated cylinder at similar KC and Reynolds (Re = UmD/ν, where ν is the molecular viscosity) numbers. Most oscillatory-flow experimental studies were conducted at low Reynolds numbers that are far from those encountered in most applications related to marine structures. For example, Tatsuno & Bearman (Reference Tatsuno and Bearman1990) discussed the two-dimensional (2-D) and 3-D flow regimes observed for a circular cylinder oscillating in a tank of water for KC ≤ 12, Re < 1200 and Stokes numbers β = Re/KC < 100. The same is true for numerical studies conducted using 2-D and 3-D direct numerical simulations (e.g. see Justensen Reference Justensen1991; Dutsch et al. Reference Dutsch, Durst, Becker and Lienhart1998; Nehari & Ballio Reference Nehari and Ballio2004; Elston, Blackburn & Sheridan Reference Elston, Blackburn and Sheridan2006; Zhao & Cheng Reference Zhao and Cheng2014; Tong et al. Reference Tong, Cheng, Xiong, Draper, An and Lou2017). Generally, 2-D numerical simulations successfully predict the 2-D vortex-shedding patterns and the forces acting on the cylinder for relatively low Reynolds and Stokes numbers. The experimental study of Williamson (Reference Williamson1985) provided detailed information on the wake structure in planes perpendicular to the axis of the cylinder for flow past an oscillating cylinder in a tank of water for a much wider range of KC and Stokes numbers (KC ≤ 40 and β < 730). His experiments revealed an increase of the number of shed vortices over each oscillatory cycle with increasing KC number (e.g. from no vortices shed for KC < 7 to four pairs of vortices shed for KC > 32). A transverse shedding regime was also observed at intermediate KC numbers (7 < KC < 15). For sufficiently large KC numbers, the anti-symmetric vortex shedding generates vortices whose subsequent dynamics may induce significant lift or spanwise forces on the cylinder (e.g. some of the vortices generated on one side of the cylinder may be advected to the other side over the next half of the oscillatory cycle) and a quasi-periodic, multiple-mode variation of the drag and lift forces even for cases with one mode (e.g. sinusoidal) forcing in the incoming, unidirectional oscillatory flow. Three-dimensional effects may be important even at relatively low Reynolds and Stokes numbers (e.g. see Tatsuno & Bearman Reference Tatsuno and Bearman1990; Yang & Rockwell Reference Yang and Rockwell2002). As for the case of steady incoming flow past a cylinder, 3-D effects are expected to become stronger at much higher Reynolds numbers than those considered in the aforementioned laboratory-scale investigations.
The present study investigates the effects of the KC number on flow and turbulence structure generated by a circular cylinder of diameter D placed in open channel of depth H in unidirectional, purely oscillatory flow using detached eddy simulation (DES). The channel bed is horizontal and smooth. Comparison with results of URANS simulations is also included. Following validation with the experimental data of Sumer et al. (Reference Sumer, Christiansen and Fredsøe1997) conducted for a case with multiple-mode forcing of the incoming streamwise velocity, D/H = 0.5, Re ≈ 7200 and KC ≈ 20 corresponding to experimental Test 14, a series of high-Reynolds-number simulations are conducted with 1.5 ≤ KC < ≤30.8, D/H = 0.325, Re ≈ 130 000 and one-mode sinusoidal forcing (table 1). The Reynolds number is large enough for the wake to be strongly turbulent.
Main non-dimensional flow and geometrical variables for the test cases conducted with purely oscillatory flow (one-mode forcing).

Given that a major goal of the present paper is to investigate the physics of oscillatory flow past cylinders at sufficiently high Reynolds numbers (e.g. Re > 105) where the turbulence structure is fairly similar that one observed in field studies, the main options are the use of classical LES with wall functions or of a hybrid RANS–LES approach. Given the success of DES in simulating high-Reynolds-number separated flows past bluff bodies (Spalart Reference Spalart2009; Koken & Constantinescu Reference Koken and Constantinescu2011; Rodi, Constantinescu & Stoesser Reference Rodi, Constantinescu and Stoesser2013), the latter approach is used. Away from the walls, the eddy viscosity predicted by DES is proportional to the square of the local grid spacing and the rate of strain magnitude, like in a classical Smagorinsky model. As a result, DES behaves as LES with a more sophisticated near-wall model. Using a one- or two-equation RANS model to solve the flow inside the viscous sublayer and next to it avoids the use of wall functions and the associated assumption that the law-of-the-wall is valid near solid surfaces, which is the main reason why LES with wall functions is not very accurate in complex flows with strong adverse pressure gradients and massive separation, like the flows investigated in this study. For flows past surface-mounted cylinders, DES was shown to accurately capture not only the wake structure but also the complex dynamics (e.g. bimodal oscillations) of the horseshoe vortices forming around the upstream face of the cylinder (Kirkil & Constantinescu Reference Kirkil and Constantinescu2015).
A first goal of the paper is to describe the wake vortex-flow regimes in the presence of a no-slip bottom boundary for relatively shallow conditions (D/H < 1) and the dynamics of the horseshoe vortices and of the other near-bed coherent structures generated during the oscillatory cycles over a fairly large range of KC numbers. A second goal is to describe the dominant sediment entrainment mechanisms based on the instantaneous and phase-averaged bed shear stress distributions around the cylinder. Of particular interest is to describe how the coherent structures forming in the vicinity of the channel bed affect sediment entrainment and transport and to point to similarities to and differences from erosion processes observed in the well-studied case of steady incoming flow past a vertical cylinder placed in a channel. One important research question is what is the variation of the sediment entrainment capacity of the flow with increasing KC number? A related question is what is the contribution of the coherent structures whose dynamics is not quasi-periodic and of the smaller-scale turbulence to the sediment entrainment capacity of the oscillatory flow? A third goal is to determine the phase-averaged forces acting on the cylinder during the oscillatory cycle and their standard deviation as a function of the KC number. One related question is how do the magnitudes of the instantaneous and phase-averaged spanwise drag forces compare with those of the streamwise drag forces for different KC numbers?
Section 2 briefly discusses the numerical method, the boundary conditions and the main flow and geometrical parameters of the test cases. Section 3 compares the DES and URANS predictions of bed shear stresses with those from an experiment performed by Sumer et al. (Reference Sumer, Christiansen and Fredsøe1997) for flow around a vertical cylinder exposed to waves (KC = 20). Section 4 focuses on the effect of the KC number on the bed shear stress distributions for oscillatory flow past a vertical cylinder with one-mode sinusoidal forcing. The same section analyses the wake-vortex-shedding regimes, the horseshoe vortex flow dynamics and the other flow features and large-scale turbulent structures playing an important role in the amplification of the bed shear stresses. Section 5 analyses the effect of the KC number on the volumetric flux of entrained sediment per unit time over the oscillatory cycle and the average capacity of the oscillatory flow to entrain sediment over the full cycle. Section 6 discusses how the KC number affects the variations of the phase-averaged forces acting on the cylinder, the phase-averaged in-line force coefficient and their standard deviations over the oscillatory cycle. The same section discusses the use of Morison's equation to provide predictions of the phase-averaged in-line force over the oscillatory cycle. Section 7 summarizes the main findings and presents some conclusions.
2. Numerical model, boundary conditions and test cases
Detached eddy simulation is a hybrid model that combines LES away from the solid boundaries with RANS close to solid boundaries to account for the unresolved turbulence (Spalart Reference Spalart2009). In the shear stress transport (SST) version of DES (Strelets Reference Strelets2001), transport equations are solved for the turbulent kinetic energy, k, and the turbulence specific dissipation rate, ω. For smooth surfaces, the turbulence length scale used in the computation of the dissipation rate in the transport equation for k is redefined as  ${d_{DES}} = {C_{DES}}\varDelta $, where
 $\varDelta$ = min(Δx,Δy,Δz). The model constant is CDES = 0.61. The SST version of DES is less sensitive to grid resolution restrictions compared with the classical Spalart–Allmaras version of DES (Strelets Reference Strelets2001; Spalart Reference Spalart2009).
At Reynolds numbers at which the boundary layers on the cylinders are laminar at separation, the performance of DES in predicting mean flow and turbulence statistics for flow past long (circular) cylinders was shown to be comparable with that of well-resolved LES and superior to URANS (Travin et al. Reference Travin, Shur, Strelets and Spalart2000; Spalart Reference Spalart2009). Detached eddy simulation was successfully used to predict flow past surface-mounted circular and rectangular cylinders and arrays of surface-mounted cylinders (e.g. see Kirkil & Constantinescu Reference Kirkil and Constantinescu2009, Reference Kirkil and Constantinescu2015; Chang et al. Reference Chang, Constantinescu, Tsai and Lien2011, Reference Chang, Constantinescu, Lien, Tsai, Lai and Loh2013; Chang, Constantinescu & Tsai Reference Chang, Constantinescu and Tsai2017, Reference Chang, Constantinescu and Tsai2020; Zeng & Constantinescu Reference Zeng and Constantinescu2017; Koken & Constantinescu Reference Koken and Constantinescu2020). These studies have shown that for steady incoming flow conditions, DES can accurately predict the wake structure and dynamics of the shed billow vortices, the dynamics of the main horseshoe vortices and their interactions with the vortex tubes shed in the separated shear layers. In particular, Kirkil & Constantinescu (Reference Kirkil and Constantinescu2009) compared results of well-resolved LES conducted using the dynamic Smagorinsky model and a fully non-dissipative code with DES for flow past a surface-mounted circular cylinder with D/H ≈ 1 and a cylinder Reynolds number of 18 000. The agreement between the two simulations in terms of the predicted mean velocity, turbulent kinetic energy and total turbulence production term was found to be very satisfactory both inside the near-wake region and inside the horseshoe vortex system. Detached eddy simulation successfully captured the bimodal oscillations of the main horseshoe vortex.
To generate a unidirectional oscillatory flow, an unsteady forcing term, fx, is added to the streamwise momentum equation. With this modification, the Navier–Stokes equations are
 \begin{gather}\frac{{\partial {u_i}}}{{\partial {x_i}}} = 0,\end{gather}
 \begin{gather}\frac{{\partial {u_i}}}{{\partial t}} + \frac{{\partial ({u_i}{u_k})}}{{\partial {x_k}}} ={-} \frac{{\partial p}}{{\partial {x_i}}} - \frac{\partial }{{\partial {x_k}}}\left[ {(\nu + {\nu_t})\left( {\frac{{\partial {u_i}}}{{\partial {x_k}}} + \frac{{\partial {u_k}}}{{\partial {x_i}}}} \right)} \right] + {f_x}{\delta _{i1}},\end{gather}
where ui is the instantaneous velocity component along the i direction, xi is the i coordinate (x 1 = x, x 2 = y, x 3 = z), νt is the eddy/subgrid-scale viscosity, p is the instantaneous pressure, δij is the Kronecker symbol and i = 1 corresponds to the streamwise direction in which the forcing is applied. The eddy/subgrid-scale viscosity is obtained either from a RANS model or from DES. The governing equations for the k–ω SST model used to perform the URANS simulations can be found in Wilcox (Reference Wilcox2006). The delayed version of DES, which preserves the RANS mode inside the attached boundary layers, was used (Spalart Reference Spalart2009). The governing equations for delayed DES are given in Rodi et al. (Reference Rodi, Constantinescu and Stoesser2013).
A finite-volume method is used to integrate the discretized incompressible Navier–Stokes equations and the turbulence model equations over each control volume in a time-accurate way. The Gauss divergence theorem is used to convert volume integrals to surface integrals. A collocated grid layout is used such that the control volumes are identical for all transport equations. The convective terms in the momentum equations are discretized using a blend of second-order-accurate upwind biased scheme and second-order central scheme. A procedure similar to the classical algorithm of Rhie & Chow (Reference Rhie and Chow1983) is used to estimate the advecting velocity at each integrating point in which a higher-order pressure redistribution term, which scales with the mesh spacing, is added (Mahesh, Constantinescu & Moin Reference Mahesh, Constantinescu and Moin2004). The second-order backward upwind scheme is used for time integration. A fully implicit discretization of the governing equations is used at each time step. Multiple inner iterations are performed at each time step. A coupled solver with algebraic multigrid and lower–upper factorization technique is used to solve the discrete system of linearized equations. In the simulations discussed in the present study the mesh was fine enough to resolve the near-wall flow (e.g. viscous sublayer) and no wall functions were used.
The computational domain used in the numerical simulations is shown in figure 1. The channel bed is located at z = 0 and the top boundary at  $z = H(z^{\prime} = z/H = 1)$. The origin of the system of coordinates is located at the centre of the solid cylinder. The streamwise direction is x, while the spanwise direction is y. The streamwise and spanwise lengths of the computational domain are Lx and Ly, respectively. Periodic boundary conditions are applied in the streamwise direction. Slip-wall boundary conditions are imposed at the two lateral boundaries for the velocity components and turbulence variables. No-slip boundary conditions are imposed on the channel bottom and on the cylinder's surface. The turbulent kinetic energy is set to zero, while ω is calculated using the standard formula for smooth walls used with the low-Reynolds-number version of the k–ω model (Zeng, Constantinescu & Weber Reference Zeng, Constantinescu and Weber2008). Similar to the oscillatory flow simulations of Baykal et al. (Reference Baykal, Sumer, Fuhrman, Jacobsen and Fredsøe2017) and to most studies investigating flow past surface-mounted cylinders placed in open channels with steady incoming flow (e.g. Kirkil & Constantinescu Reference Kirkil and Constantinescu2015), the top boundary is modelled as a shear-free slip wall. A zero surface-normal gradient is specified for the flow and turbulence variables. As opposed to the experiments of Sumer et al. (Reference Sumer, Christiansen and Fredsøe1997), the present simulations are conducted with no waves at the free surface. Rather it is the imposed forcing along the x direction that drives the oscillatory flow. Simulations were run with a non-dimensional time step of 0.001TUm/H. This low value allowed resolving the range of energetic frequencies associated with the dynamically important coherent structures in the flow. After the initial transients were eliminated, phase-averaged quantities were collected over a time interval of 20 cycles (Δt = 20T). The mesh contained around 5 million cells and 55 points were used to resolve the flow in the vertical direction. The mesh was refined near the cylinder and close to the bed surface.
Sketch of the computational domain with the main physical dimensions. Series of simulations were conducted with D/H = 0.5, Lx/H = 15, Ly/H = 7.5 and with D/H = 0.325, Lx/H = 20, Ly/H = 10. The depth-averaged velocity in the oscillatory flow at large distances from the cylinder is  $\hat{u}$.

The first set of simulations were performed mostly for validation purposes. The geometrical and flow conditions were close to those of Test 14 (D = 0.04 m, H = 0.08 m, Um = 0.183 m s−1) in the experimental study of Sumer et al. (Reference Sumer, Christiansen and Fredsøe1997) conducted in a wave flume with a plane bed. The main non-dimensional parameters were D/H = 0.5, KC = 20 and Re = 7200. A multimodal forcing was applied in the DES and URANS simulations to try to mimic as close as possible the experimentally measured oscillatory streamwise velocity away from the cylinder (undisturbed flow). After several trials, the final expression for the non-dimensional forcing was  ${f^{\prime}_x} = {f_x}(H/U_m^2) = (0.626\cos (2{\rm \pi} t/T) + 0.312\cos (4{\rm \pi} t/T) + 0.158\cos (6{\rm \pi} t/T)$. For both DES and URANS, the non-dimensional, depth-averaged streamwise velocity at large distances away from the cylinder was
 $\hat{u}^{\prime} = \hat{u}/{U_m} = 0.95\sin (2{\rm \pi} t/T) + 0.26\sin (4{\rm \pi} t/T) + 0.08\sin (6{\rm \pi} t/T)$. Its peak values are close to 1 and −1. Similar to the experiment, an asymmetry is present between the wave crest and the wave trough in the streamwise velocity signal over a cycle. The DES and URANS simulations were performed in a domain with Lx/H = 15 and Ly/H = 7.5. The first grid point was placed at around 0.15 wall units from the channel bed and at about 1.5 wall units from the surface of the cylinder, where the non-dimensional distance in wall units, n+, corresponding to the physical distance to a smooth wall surface, n, is calculated as
 ${n^ + } = (n/H)({u_\tau }/{U_m})Re$ assuming conservatively that the non-dimensional bed shear velocity is uτ/Um = 0.06.
A second set of mostly DES were performed to study the changes in the flow physics and oscillatory behaviour of relevant flow variables with increasing KC number (1.5 ≤ KC ≤ 30.8). All simulations (table 1) were conducted with D/H = 0.325 and Re ≈ 130 000 in a domain with Lx/H = 20 and Ly/H = 10. A non-dimensional unimodal forcing  ${f^{\prime}_x} = {a_x}\cos (2{\rm \pi} t/T)$ was applied such that the streamwise velocity in the undisturbed flow is
 $\hat{u}^{\prime} = \hat{u}/{U_m} = \sin (2{\rm \pi} t/T)$ for all cases. The values of the Reynolds number, Rea, defined with the semi-excursion length, a = UmT/2
 ${\rm \pi} $, are also included in table 1. The physical significance of the variable a is the amplitude of the undisturbed oscillatory flow in a deep oscillatory boundary layer over a smooth wall. The peak
 $|\hat{u}|$ values are reached at t = T/4 and t = 3T/4 and
 $\hat{u}$ changes signs at t = T/2. Given the anti-symmetric oscillatory pattern, the phase-averaged flow can be studied only over half of the period of the oscillatory cycle. For each of the four test cases, the non-dimensional amplitude of the applied forcing ax/(Umω) = 1, where ω = 2
 ${\rm \pi} $/T is the angular frequency. Formally, one can consider that simulations were performed with constant values of D, H and Um and varying periods of the oscillatory cycle, T. Given that the first grid point off each solid surface is situated within the viscous sublayer, the shear stresses on the solid surfaces are calculated using the definition rather than using the law of the wall. The maximum phase-averaged bed shear stress recorded during the oscillatory cycle in the undisturbed flow is denoted
 ${\tau _m}$. Its non-dimensional values are also included in table 1.
The RANS simulations and DES were performed using the same meshes. The simulations were run on 64 processors of a PC cluster. The RANS solutions became periodical or quasi-periodical after about 2 weeks. Another 2–3 weeks of physical time were needed to calculate the phase-averaged flow. The DES was run starting from RANS after the RANS solution became quasi-periodical. About 3 weeks of simulation time was needed for the flow to become quasi-periodic in DES. Another 5–7 weeks were needed to calculate the quasi-periodic flow over 20 shedding cycles. This corresponds to about 100 000 CPU hours per DES. A LES with wall functions at the same Reynolds number will reduce the computational time by only about 20 %–30 %.
3. Validation simulations
At large distances from the cylinder, the values of the phase-averaged streamwise velocity,  $\bar{u}$, predicted by DES and URANS are close to identical over the whole oscillatory cycle. This can be observed from figure 2 that compares the vertical profiles of the non-dimensional phase-averaged streamwise velocity,
 $\bar{u}^{\prime} = \bar{u}/{U_m}$, predicted by the numerical simulations in the symmetry plane (y/H = 0) at x/H = −7.5 with the experimental measurements of Sumer et al. (Reference Sumer, Christiansen and Fredsøe1997) for an oscillatory flow (Re = 7200, Rea = 11 465) with no cylinder present in the flume and with the theoretical laminar solution for an oscillatory boundary layer corresponding to the three-mode forcing. The wave boundary layer was essentially laminar for this test case. The slight disagreement between the predicted profiles and those obtained from the superposition of theoretical solutions corresponding to each mode is mainly due to the small effect induced by the cylinder at the locations of the inlet and outlet sections in the numerical simulations. Given the multimodal forcing, the velocity profiles at t = t 0 and t = t 0 + T/2 are not anti-symmetric. The numerical simulations accurately capture the temporal evolution of
 $\bar{u}^{\prime}$ over the oscillatory cycle outside of the bottom boundary layer where
 $\bar{u}^{\prime}$ does not vary with the distance from the bed. Some small errors are observed over the second half of the oscillatory cycle (0.5T < t < T). The velocity variation inside the bottom boundary layer at different times during the oscillatory cycle is also fairly well reproduced by the numerical simulations (figure 2).
Phase-averaged streamwise velocity profiles,  $\bar{u}^{\prime}(z/H) = \bar{u}/{U_m}$, during the oscillatory cycle (0 ≤ t ≤ 10T/12) predicted by URANS and DES in the symmetry plane (y/H = 0) at x/H = −7.5. The non-dimensional vertical distance is
 $z^{\prime} = z/H$. The symbols show the velocity profiles measured by Sumer et al. (Reference Sumer, Christiansen and Fredsøe1997) for oscillatory flow with no cylinder present in the flume. The green line shows the theoretical solution for an oscillatory laminar boundary layer based on the imposed oscillatory flow containing three modes.

Consistent with the corresponding experimental observations of Sumer et al. (Reference Sumer, Christiansen and Fredsøe1997), a horseshoe vortex is observed over about 65 %–70 % of each oscillatory half-cycle in which the incoming flow is oriented towards one side of the cylinder. Figure 3 compares the numerical predictions of the non-dimensional, phase-averaged bed shear stress,  $\bar{\tau }/{\tau _m}$, inside the symmetry plane (y/H = 0) at two time instances (t = T/4 and t = 3T/4) when the magnitude of the depth-averaged streamwise velocity in the undisturbed flow is relatively high (e.g.
 $|\hat{u}^{\prime}|$ is close to 1) and a strongly coherent horseshoe vortex is present near the upstream base of the cylinder. At both time instances, the bed shear stresses are shown only on the side containing the horseshoe vortex. The presence of a coherent horseshoe vortex induces an amplification of the bed shear stress near the upstream face of the cylinder relative to the incoming flow direction. The peak values of
 $\bar{\tau }/{\tau _m}$ predicted by the present URANS simulations are close to −0.55 at t = T/4 and t = 3T/4, in very good agreement with the peak values predicted by the k–ω URANS simulations of Baykal et al. (Reference Baykal, Sumer, Fuhrman, Jacobsen and Fredsøe2017). The RANS simulations strongly underestimate the peak values measured by Sumer et al. (Reference Sumer, Christiansen and Fredsøe1997) which are close to −1.4 at t = T/4 and −1 at t = 3T/4. By contrast, DES predictions of
 $\bar{\tau }/{\tau _m}$ in the y/H = 0 plane are much closer to the experimental measurements. In particular, the peak values of
 $\bar{\tau }/{\tau _m}$ are about −1.2 at t = T/4 and −0.87 at t = 3T/4. Consistent with the experiment and the asymmetric variation of the incoming flow velocity over the oscillatory cycle, DES predicts a larger magnitude of the peak value of
 $\bar{\tau }/{\tau _m}$ at t = T/4 compared with t = 3T/4.
Non-dimensional bed shear stress, τ/τm and  $\bar{\tau }/{\tau _m}$, inside the symmetry plane (y/H = 0) at the upstream (horseshoe vortex) side of the cylinder at t = T/4 and t = 3T/4 during the oscillatory cycle. Solid lines represent phase-averaged values. The dashed line shows τ/τm (DES) during one of the oscillatory cycles when the presence of the horseshoe vortices results in a large amplification of the bed shear stresses close to one side of the cylinder. The symbols show the experimental data (phase-averaged values) of Sumer et al. (Reference Sumer, Christiansen and Fredsøe1997) for KC = 20 (Test 14).

It is also relevant to point out that Sumer et al. (Reference Sumer, Christiansen and Fredsøe1997) mentioned that over some of the cycles the peak instantaneous values of τ/τm can be as high as two times the phase-averaged values. This is also the case in the present DES. Figure 3 also includes the variation of τ/τm over one of the cycles where the coherence and circulation of the main horseshoe vortex forming during the trough half-period are very large. For this oscillatory cycle, the peak values of τ/τm are close to −2 at t = 3T/4. A similar behaviour is also observed over the crest half-period for some of the oscillatory cycles. Though significant cycle-to-cycle variations are also observed in the instantaneous distributions of τ/τm in the RANS simulation, the relative difference between the peak instantaneous value and the peak phase-averaged value is of the order of only 25 %. Both DES and RANS predict that the incoming boundary layer separates in the y/H = 0 plane at |xs|/D = 0.8–0.85 ( $\bar{\tau }/{\tau _m} = 0$, xs is measured from the face of the cylinder) at both t = T/4 and t = 3T/4, in good agreement with the value (|xs|/D ≈ 0.9) measured by Sumer et al. (Reference Sumer, Christiansen and Fredsøe1997). Overall, these results show that DES can capture more accurately the variation in the coherence of the horseshoe vortices forming over part of the oscillatory cycles.
Both RANS and DES predict the shedding of two vortices over each half-cycle, which is consistent with observations from the corresponding (KC = 20) experiment of Sumer et al. (Reference Sumer, Christiansen and Fredsøe1997), the experiments conducted with isolated long cylinders by Williamson (Reference Williamson1985) and several numerical studies (An, Cheng & Zhao Reference An, Cheng and Zhao2015; Baykal et al. Reference Baykal, Sumer, Fuhrman, Jacobsen and Fredsøe2017). Experimental data suggest that for a fairly large range of KC numbers, the wake vortices forming in oscillatory flow past a surface-mounted cylinder have a larger capacity to entrain sediment than the horseshoe vortices. This is also the case for the present test case (KC = 20) for which the measured maximum phase-averaged bed shear stress magnitude  $|{\bar{\tau }_{max}}|/{\tau _m}$ in the y/D = 0 plane is close to 2.3 over the crest half-period of the oscillatory cycle and 2.0 over the trough half-period (figure 4). These values are larger than those measured beneath the horseshoe vortex system
 $(|{\bar{\tau }_{max}}|/{\tau _m} \approx 1.4)$. Similar to the trends observed for the upstream (horseshoe vortex) side of the cylinder, DES predictions of the peak bed shear stress magnitudes on the downstream (lee-wake) side of the cylinder (
 $|{\bar{\tau }_{max}}|/{\tau _m} \approx 2.2$ over the crest half-period and
 $|{\bar{\tau }_{max}}|/{\tau _m} = 2.35$ over the trough half-period) are fairly close to the experimental values. Meanwhile, RANS severely underpredicts these values for both half-periods of the oscillatory cycle
 $(|{\bar{\tau }_{max}}|/{\tau _m} \approx 1)$. The k–ω RANS of Baykal et al. (Reference Baykal, Sumer, Fuhrman, Jacobsen and Fredsøe2017) predicted
 $|{\bar{\tau }_{max}}|/{\tau _m} \approx 1.3$. Moreover, DES predictions of the decay of
 $|{\bar{\tau }_{max}}|/{\tau _m}$ away from the cylinder are in very good agreement with the experiment over the trough half-period.
Maximum, phase-averaged bed shear stress magnitude,  $|{\bar{\tau }_{max}}|/{\tau _m}$, in the y/H = 0 plane at the downstream (wake) side of the cylinder. The solid lines and square symbols show the peak values recorded over the first half (crest half-period) of the oscillatory cycle 0 < t < T/2
 $(u^{\prime} > 0)$ for x/D > 0.5. The dashed lines and the circle symbols show the peak values recorded over the second half (trough half-period) of the oscillatory cycle T/2 < t < T
 $(u^{\prime} < 0)$ over the region x/D < −0.5. The symbols show the experimental data of Sumer et al. (Reference Sumer, Christiansen and Fredsøe1997) for KC = 20 (Test 14).

The largest amplification of the phase-averaged bed shear stress around the cylinder occurs near the sides of the cylinder in the region of strong flow acceleration forming when the velocity magnitude of the incoming flow is close to its peak values. Inside this region, DES predicts  $|{\bar{\tau }_{max}}|/{\tau _m} \approx 3.8$ while the experimental measurements of Sumer et al. (Reference Sumer, Christiansen and Fredsøe1997) indicate
 $|{\bar{\tau }_{max}}|/{\tau _m} \approx 3.5$.
4. Effect of the KC number on wake vortex shedding, bed shear stress and horseshoe vortex system
4.1. Wake structure during the oscillatory cycle
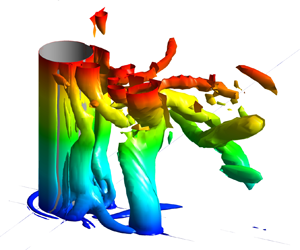
Figure 5 visualizes the vortical structure around the cylinder using the Q criterion (Dubief & Delcayre Reference Dubief and Delcayre2000). The quantity  $Q ={-} 0.5\partial {u_i}/\partial {x_j} \times \partial {u_j}/\partial {x_i}({H^2}/U_m^2)$ is the second invariant of the resolved velocity gradient tensor. For all simulations conducted with KC ≥ 8, vortices are shed in the wake. Though the cores of these wake vortices are subject to large-scale deformations along their axes, these vortices remain close to vertical from the top surface to the bed surface. This is different from the case of a surface-mounted circular cylinder with steady incoming flow where the cores of the wake vortices tilt as they approach the bed mostly because of the stretching induced inside the bottom boundary layer. This finding is consistent with the observations of Baykal et al. (Reference Baykal, Sumer, Fuhrman, Jacobsen and Fredsøe2017) based on URANS simulations. Present results show that the amplitude of the along-the-axis deformations of the cores of the wake vortices decreases with decreasing KC. The distance from the cylinder at which the wake vortices remain coherent increases with increasing KC number. For KC = 30.8 these vortices remain coherent until about 6D from the centre of the cylinder. This distance reduces to about 3D for KC = 8.
Visualization of the coherent structures in the instantaneous flow fields (DES predictions): (a) KC = 30.8; (b) KC = 15.4; (c) KC = 8. The Q isosurface (Q = 10.0) is coloured with the distance from the channel bottom,  $z^{\prime} = z/H$. Besides the 3-D view, a vertical view from below the channel bed is included to better visualize the near-bed (dark blue) vortices that are parallel to the channel bottom. To facilitate discussion of the effect of vortical structures on the bed shear stress distributions (view from above the channel bed in figures 8 and 9), the vertical views are rotated by 180° around the x axis. The horseshoe vortices, horizontal near-bed secondary vortices and main vertical wake vortices are denoted HV, HSV and WV, respectively.

One important finding is that for all the cases where wake shedding is present, the near-bed wake region contains a number of horizontal secondary vortices parallel to the bed (see HSV vortices forming on the downstream side of the cylinder in figure 5). These vortices play a similar role to the horseshoe vortices (HV vortices in figure 5) forming around the upstream side of the cylinder in terms of locally enhancing the instantaneous bed shear stresses. The HSV vortices generally form in between the cores of the (vertical) wake vortices (e.g. such vortices are observed at t = T/4 in figure 5a and at t = T/4 and 3T/8 in figure 5b), but some of them can penetrate on the outer side of the region containing the wake vortices (e.g. this is the case at t = 3T/8 in figure 5a). For lower KC numbers where the wake shedding near the cylinder becomes more symmetric, the HSV vortices generally form close to the symmetry plane (see figure 5c for KC = 8). Additionally, a weaker HSV vortex can form around the downstream face of the cylinder, similar to the much more coherent horseshoe vortex present around its upstream face (figure 5c). The HSV vortices are generated mainly because of the interactions among the shed wake vortices and the presence of the no-slip bed surface. Similar to the streamwise-oriented secondary ‘finger’ vortices forming in the wake of a long cylinder (Mahesh et al. Reference Mahesh, Constantinescu and Moin2004), the formation of the near-bed horizontal vortices in figure 5 is favoured by the large-scale instabilities generated along the (vertical) cores of the wake vortices. Capturing the dynamics of these secondary vortices requires a LES-based approach.
The main effect of increasing the KC number is to generate an increasing number of wake vortices on the downstream (lee) side of the cylinder over each half-period of the oscillatory cycle. The wake vortex shedding is in the anti-symmetric mode in all test cases with KC ≥ 15.4 (e.g. see instantaneous vertical vorticity plots in figure 6 for KC = 30.8). The wake vortex shedding over the oscillatory cycles is fairly regular, which explains the close-to-symmetric patterns of the phase-averaged vorticity,  $\overline {{\omega _z}} $, in figure 6. By t = T/4 when the incoming velocity peaks, two counter-rotating vortices have been shed in the wake and another one is detaching from the cylinder (see
 ${\omega _z}$ panel in figure 6a). This explains why two pairs of positive/negative vorticity patches are observed in the distribution of
 $\overline {{\omega _z}} H/{U_m}$ in figure 6(a). By t = 3T/8 (figure 6b), three counter-rotating vortices are shed in the wake, with a fourth vortex being attached to the cylinder. The fourth vortex remains attached to the cylinder until the incoming flow changes direction at t = T/2. The interactions and trajectories of the wake vortices are very irregular as the flow decelerates and the incoming flow velocity approaches zero. The KC = 30.8 case is characterized by the formation of four wake vortices and the shedding of three of these vortices every half-cycle. This shedding pattern for KC = 30.8 is somewhat expected given that Sumer et al. (Reference Sumer, Christiansen and Fredsøe1997) also observed an increase of the number of shed vortices with increasing KC with two vortices being shed each half-cycle for 17 < KC < 23.
Non-dimensional phase-averaged and instantaneous vertical vorticity,  $\overline {{\omega _z}} H/{U_m}$ and
 ${\omega _z}H/{U_m}$, during the oscillatory cycle in the z/H = 0.5 plane for the KC = 30.8 test case (DES predictions): (a) t = T/4
 $(\hat{u}^{\prime} = 1)$; (b) t = 3T/8
 $(\hat{u}^{\prime} = 0.7)$.

The anti-symmetric mode weakens considerably as the KC number decreases towards the threshold value at which vortices are shed in the wake. This can be observed in the KC = 8 case where the two counter-rotating vortices forming at the back of the cylinder are fairly symmetric (e.g. see figures 5c and 7b). None of these vortices moves in the wake of the cylinder between t = 0 and t = T/2. As the incoming flow reverses (t > T/2), these two vortices are advected along the lateral sides of the cylinder and move into the new wake region. This is also why the mean vorticity distributions in figure 7(a) (t = T/4) contain two pairs of counter-rotating vortices. The pair situated around x/D = 1.5 does not correspond to vortices shed in the wake between t = 0 and t = T/4 but to vortices forming at the back of the cylinder in the x/D < 0 region between t = −T/2 and t = 0 that moved into the x/D > 0 region over the next half-period. Consistent with this dynamics, the vorticity sign is different inside the vortices forming on the two sides of the symmetry plane (y/D = 0) at t = T/4 (figure 7a). This is different from what is observed in cases where the shed vortices remain on the side of the cylinder where they originated (e.g. see  $\overline {{\omega _z}} \; $ distributions in figure 6a,b).
Non-dimensional vertical vorticity, during the oscillatory cycle in the z/H = 0.5 plane for the KC = 8 test case (DES predictions): (a)  $\overline {{\omega _z}} H/{U_m}$ at t = T/4
 $(\hat{u}^{\prime} = 1)$; (b)
 ${\omega _z}H/{U_m}$ at t = 3T/8
 $(\hat{u}^{\prime} = 0.7)$; (c)
 ${\omega _z}H/{U_m}$ at t = 5T/8
 $(\hat{u}^{\prime} ={-} 0.7)$. The black arrows show the positions of the two vortices forming at the back of the cylinder (x/D > 0) for 0 < t < T/2. These two vortices move in the x/D < 0 region over the next half-cycle (T/2 < t < T). The red arrows point to the two vortices that formed in the x/D < 0 region for −T/2 < t < 0 and were advected in the x/D > 0 region over the next half-cycle.

Figures 5(c) and 7(b) visualize the two close-to-symmetric vortices forming at the back of the cylinder (x/D > 0) in the KC = 8 case at two times (t = 3T/8 and t = T/2) when their coherence is close to maximum. As these two vortices start moving towards and past the cylinder for t > T/2, one vortex becomes more coherent than the other (e.g. higher circulation) and their advection speeds become different. Moreover, their trajectories are no longer symmetric with respect to the y/D = 0 plane. This can be observed in the  ${\omega _z}H/{U_m}$ distribution at t = 5T/8 (figure 7c) where the (red) wake vortex being advected in the y/D < 0 region is situated at x/D ≈ 0 while the (blue) wake vortex being advected in the y/D > 0 region is situated at x/D ≈ −0.9.
The wake shedding in the KC = 15.4 case presents some important similarities to and differences from those discussed for the KC = 30.8 and KC = 8 cases. For brevity, figures are not included to illustrate the wake dynamics for this case. In the KC = 15.4 case, only one vortex is shed in the wake of the cylinder over each half of the oscillatory cycle. This vortex can be seen on the right-hand side of the cylinder in figure 5(b) at t = T/4 and 3T/8. Thus, the wake shedding is anti-symmetric. Lowering the KC number from 30.8 to 15.4 decreases the number of shed vortices over each half of the oscillatory cycle from three to one. However, rather than remaining on the side of the cylinder where it originated, the vortex shed in the KC = 15.4 case will start moving back towards the cylinder and then past it as the incoming flow changes direction during the next half-cycle. This is similar to what was observed in the KC = 8 case except that only one vortex is washed out around the cylinder each half-cycle, a result also consistent with the experiments of Sumer et al. (Reference Sumer, Christiansen and Fredsøe1997). The vortex moving past the cylinder in the KC = 15.4 case strongly interacts with the vortex forming on the other side of the cylinder over the next half-cycle. Finally, the degree of cycle-to-cycle variability of the wake shedding is the largest in the KC = 15.4 case. This is because for some oscillatory cycles a second weaker vortex of opposite-sign circulation to the first wake vortex is shed during one of the half-cycles.
4.2. Bed shear stress distributions
Besides the vortices shed from the cylinder and the horizontal near-bed vortices, the other vortices with a significant capacity to induce sediment entrainment are the horseshoe vortices forming around the upstream face of the cylinder. The mechanism for the formation of horseshoe vortices in oscillatory flow is the same as that for a surface-mounted cylinder with steady incoming flow. The main difference is that horseshoe vortices form on both sides of the cylinder during each oscillatory cycle as the flow accelerates towards the upstream face of the cylinder. The coherence of these vortices starts decaying and their cores move away from the bed as the flow decelerates. As for the case of cylinders with steady incoming flow, the coherence of the main horseshoe vortex in the instantaneous flow fields varies with the polar angle. Simulation results in figure 5 show that the degree of asymmetry of the necklace vortex with respect to the symmetry plane is quite high for KC ≥ 8. For example, the legs of the horseshoe vortex are generally not oriented along the streamwise direction, one leg extends further downstream compared with the other leg and/or the size of its core is generally highly asymmetric with respect to the symmetry plane (e.g. see figure 5c for KC = 8). This behaviour is mostly due to the much stronger interactions between the cores of the shed wake vortices, which remain vertical as the bed is approached, and the legs of the main horseshoe vortex compared with the interactions observed for cases with steady incoming flow.
Both the horseshoe vortices and the lower parts of the wake vortices interact with the bed surface. The passage of these eddies and/or variations in their position and coherence over time have a great effect on the amplification of the instantaneous bed shear stresses around the cylinder. In particular, the passage of wake vortices can induce lots of sediment entrainment at locations where the mean (phase-averaged) value of the bed friction velocity magnitude is smaller than the critical threshold value for entrainment given by the Shields diagram or other methods used to estimate this variable for sediment with a given mean particle diameter, d 50 (Cheng, Koken & Constantinescu Reference Cheng, Koken and Constantinescu2018). Therefore, in figure 8 we analyse both the distributions of  $|\bar{\tau }|/{\tau _m}$ and
 $|\tau |/{\tau _m}$.
Non-dimensional bed shear stresses magnitude,  $|\bar{\tau }|/{\tau _m}$ and
 $|\tau |/{\tau _m}$, for the KC = 30.8 test case (DES predictions): (a) t = T/4
 $(\hat{u}^{\prime} = 1)$, (b) t = 3T/8
 $(\hat{u}^{\prime} = 0.7)$; (c) t = T/2
 $(\hat{u}^{\prime} = 0)$. The black arrows point towards regions of high |τ|/τm induced by horizontal near-bed vortices (see figure 5a).

For KC = 30.8, the maximum values of  $|\bar{\tau }|/{\tau _m}$ are recorded when the incoming flow velocity magnitude peaks at t = T/4 and 5T/4. Similar to what is observed for cylinders mounted on a horizontal surface with an incoming steady current (Kirkil & Constantinescu Reference Kirkil and Constantinescu2015), the two main regions of high bed shear stress in figure 8(a) are situated between polar angles of 30° and 60° measured from the symmetry plane (y/D = 0). The peak values of
 $|\bar{\tau }|/{\tau _m}$ inside these regions are close to 5. These values are slightly larger than those reported by Sumer et al. (Reference Sumer, Christiansen and Fredsøe1997) for cases when the incoming oscillatory flow was multimodal. Due to the anti-symmetric vortex shedding, the sizes of these regions are generally not equal in the instantaneous flow fields (figure 8a). Moreover, instantaneous bed shear stresses of comparable magnitude can be induced beneath the wake vortex that detaches from the back of the cylinder (see figures 5a and 8a for t = T/4). In the case of steady incoming flow, such wake vortices with a high sediment entrainment potential are generally observed for cylinders with sharp edges that favour the formation of vortices whose cores remain vertical until the bed surface is reached (Kirkil & Constantinescu Reference Kirkil and Constantinescu2009). Here, the cross-section of the cylinder does not contain any corner, but the oscillatory flow favours the formation of wake vortices whose axes remain vertical (see discussion of figure 5). This explains the much larger capacity of these vortices to entrain sediment when the incoming flow past the circular cylinder is oscillatory rather than steady.
Interestingly, as the flow starts decelerating, the region of high bed shear stress around the upstream face of the cylinder is situated beneath the main horseshoe vortex. This means that the horseshoe vortex rather than the flow ‘acceleration’ induced by the presence of the cylinder controls sediment entrainment over part of the oscillatory cycle. As opposed to the case of cylinders with incoming steady current, a region of high mean (phase-averaged) bed shear stress is also forming near the back of the cylinder as the flow is decelerating (e.g. for 0.5 < x/D < 2 in figure 8b). Moreover, additional regions of high instantaneous bed shear stress (|τ|/τm > 2) are present in the wake at t = T/4 (figure 8a) and t = 3T/8 (figure 8b). As already discussed, some of these patches of high|τ|/τm correspond to the cores of the shed vortices. However, the elongated patches making a low angle with the streamwise direction are induced by the near-bed horizontal vortices forming in the wake (see HSV vortices in figure 5a for t = T/4 and t = 3T/8). As expected, the mean bed shear stresses are relatively low at times when the incoming flow velocity magnitude is very low (see figure 8c for t = T/2). However, regions of relatively high |τ|/τm are still generated in the instantaneous flow fields on the sides and at the back of the cylinder as the incoming velocity approaches zero. By contrast, the amplification of |τ|/τm at t = T/2 (figure 8c) is negligible around the upstream face of the cylinder because the horseshoe vortex loses its coherence and moves away from the bed as the incoming flow velocity approaches zero.
For relatively low KC values, the core of the main horseshoe vortex increases considerably as the flow starts decelerating (t > T/4). In the KC = 8 case, the horseshoe vortex maintains its coherence past t = T/2 when the incoming flow reverses and is able to induce relatively large bed shear stresses beneath it (e.g. see figures 5c and 9b for t = T/2). On the wake side, the elongated streamwise-oriented horizontal vortex forming near y/D = 0 and the near-bed vortex forming around the downstream face of the cylinder induce the largest bed shear stresses in the wake region at t = T/2 (figure 9b). So, for oscillatory flow conditions, the bed shear stress distributions can be qualitatively very different from those observed for steady incoming flow especially at times when the velocity magnitude in the approaching flow is much lower than the peak approaching flow velocity.
Non-dimensional bed shear stresses magnitude, |τ|/τm (DES predictions): (a) t = T/4 for KC = 8; (b) t = T/2 for KC = 8; (c) t = T/4 for KC = 15.4. The black arrow in (b) points towards a region of high |τ|/τm induced by a horizontal near-bed vortex (see figure 5c for t = T/2).

4.3. Bed shear stresses and horseshoe vortex dynamics in the symmetry plane
Figure 10 compares the distributions of  $\bar{\tau }/{\tau _m}$ in the symmetry (y/D = 0) plane at the upstream (x/D < 0) side of the cylinder at relevant times during the oscillatory cycle. For KC ≥ 8, a negative peak of
 $\bar{\tau }$ is observed close to the cylinder when the incoming velocity magnitude is the highest (t = T/4). This peak is induced by the horseshoe vortex. The magnitude of
 $\bar{\tau }/{\tau _m}$ in this region increases with increasing KC to reach 1.2 for KC = 30.8 (figure 10d). The negative peak is not present in the KC = 1.5 case where no horseshoe vortex forms.
Non-dimensional phase-averaged bed shear stress,  $\bar{\tau }/{\tau _m}$, in the symmetry (y/D = 0) plane at the upstream (x/D < 0) side of the cylinder (DES predictions): (a) KC = 1.5; (b) KC = 8; (c) KC = 15.4; (d) KC = 30.8. The bed shear stress is plotted at t = 0T
 $(\hat{u}^{\prime} = 0)$, t = T/8
 $(\hat{u}^{\prime} = 0.7)$, t = T/4
 $(\hat{u}^{\prime} = 1)$ and t = 3T/8
 $(\hat{u}^{\prime} = 0.7)$.

As opposed to the case of steady incoming flow where erosion on the upstream side of the cylinder, close to its symmetry line, is only driven by the horseshoe vortex, in the case of oscillatory flow erosion near the upstream face can also be induced by other mechanisms. This is the case for the KC = 8 (figure 10b) and KC = 15.4 (figure 10c) simulations where regions with  $|\bar{\tau }/{\tau _m}|> 1$ and
 $|\tau /{\tau _m}|> 1$ form during the first half of the oscillatory cycle (e.g. see also figures 9a and 9c). The peak values of
 $\bar{\tau }/{\tau _m}$ in figure 10 are close to 1.4 (t = T/8, x/D ≈ −1.2) for KC = 8 and 1.45 (t = T/8, x/D ≈ −1.6) for KC = 15.4. The peak values beneath the horseshoe vortex are 0.6 (t = T/4) for KC = 8 and 0.8 (t = T/4) for KC = 15.4. For these two cases, local scour on the upstream side of the cylinder is not primarily driven by the horseshoe vortices but rather by some of the wake vortices shed on the downstream side of the cylinder that start moving towards the cylinder as the direction of the incoming flow changes during the next half of the oscillatory cycle (see discussion of figure 7). As these vortices pass the cylinder and move into the ‘upstream’ region, they accelerate some of the flow next to them which increases the bed shear stress. This is illustrated in figure 11 for the KC = 15.4 simulation. The two counter-rotating vortices in the x/D < 0 region originated in the x/D > 0 region during the previous half-period of the oscillatory cycle when
 $\hat{u^{\prime}} < 0$. As they pass the cylinder, they generate between their cores a strong jet-like flow towards the cylinder. This effect is the strongest at times where the incoming velocity magnitude is small. As KC further increases, the wake vortices generally remain on the side of the cylinder where they were shed. This explains why a region with
 $\bar{\tau }/{\tau _m} > 1$ is not present away from the cylinder in the KC = 30.8 simulation (figure 10d). It is only for such high-KC cases that the horseshoe vortices are the main mechanism for scour on the upstream side of the cylinder.
Phase-averaged streamwise velocity,  $\bar{u}/{U_m}$, in a horizontal plane (z/H = 1) at t = 0T
 $(\hat{u}^{\prime} = 0)$ in the KC = 15.4 simulation. The streamlines visualize the vortices that correspond to the two cells forming at the back of the cylinder (x/D > 0) at earlier times when
 $\hat{u}^{\prime} < 0$. The flow is accelerated towards the cylinder between the cores of these vortices once the two vortices move inside the x/D < 0 region.

On the downstream side of the cylinder, the variation of  $\bar{\tau }/{\tau _m}$ in the symmetry plane (figure 12) is qualitatively similar in the simulations conducted with KC ≥ 8. As expected, the largest magnitudes are predicted at t = T/4 when the incoming flow velocity magnitude is the largest. A first region of high values of
 $|\bar{\tau }|/{\tau _m}$ is predicted inside the recirculation region at the back of the cylinder. It is mainly induced by the wake billows as they detach from the cylinder and start moving downstream (e.g. see VW vortices at t = T/4 in figure 5a,b for KC = 30.8 and 15.4,
 $|\bar{\tau }|/{\tau _m}$ distribution for KC = 30.8 in figure 8a and |τ|/τm distribution for KC = 15.4 in figure 9c). The shedding of the pair of counter-rotating vortices is more symmetric in the KC = 8 case (see VW vortices in figure 5c and
 ${\omega _z}$ distribution in figure 7b). As a result, their capacity to accelerate the fluid towards the cylinder between their cores is also the largest, which explains why the peak negative value of
 $\bar{\tau }/{\tau _m}$ in figure 12 is predicted for KC = 8. The position of the peak negative bed shear stress moves away from the cylinder with increasing KC. A region of high positive values of
 $\bar{\tau }/{\tau _m}$ is predicted in the near wake (e.g. see distribution of
 $|\bar{\tau }|/{\tau _m}$ between x/D = 3 and x/D = 8 in figure 8a for KC = 30.8 and that of |τ|/τm between x/D = 1.5 and x/D = 4 in figure 9a for KC = 8) as the accelerated flow passing the cylinder moves towards the symmetry plane behind the flow recirculation region. Results in figure 12 show that the peak values inside this region decay monotonically with increasing KC, while the distance from the cylinder where the peak value is reached increases from x/D = 1.5 for KC = 8 to x/D = 5.4 for KC = 30.8. The streamwise distance over which the bed shear stress recovers towards the values in the incoming flow also increases with increasing KC (figure 12). For KC = 15.4, the peak values of
 $|\bar{\tau }/{\tau _m}|$ inside the two regions are close to 1.45. However, in the KC = 8 and 30.8 simulations, the magnitude of
 $\bar{\tau }/{\tau _m}$ is larger inside the near-wake region than inside the recirculation region. For these cases, most of the scour on the downstream (wake) side will occur away from the cylinder if the bed is close to horizontal.
Non-dimensional phase-averaged bed shear stress,  $\bar{\tau }/{\tau _m}$, in the symmetry (y/D = 0) plane at the downstream (x/D > 0) side of the cylinder (DES predictions). Solid lines show results at t = T/4
 $(\hat{u}^{\prime} = 1)$. Dashed lines show results at t = 3T/8
 $(\hat{u}^{\prime} = 0.7)$.

Figure 13 quantifies the variability of the bed shear stresses along the symmetry plane with respect to the phase-averaged values. During some of the oscillatory cycles the horseshoe vortex induces bed shear stresses that can be up to 50 %–100 % larger than the phase-averaged values. This level of amplification with respect to the phase-averaged values was also observed in the validation test case (KC = 20). A high cycle-to-cycle variability of the bed shear stresses on the upstream side is also observed especially when the incoming flow velocity magnitude is small (e.g. at t = T/2 in the x/D > 0 region in figure 13a) and is mainly due to differences in the coherence/circulation of the wake vortices and their trajectories as they move on the other side of the cylinder (see discussion of figure 11). For both KC values, URANS simulations severely underpredict the peak magnitude of  $\bar{\tau }/{\tau _m}$ beneath the horseshoe vortex (e.g. by more than 100 % in the KC = 30.8 case). The RANS simulation also underpredicts the peak values of
 $\bar{\tau }/{\tau _m}$ induced by the advection of wake vortices on the upstream side of the cylinder (see predictions for t = T/2 in figure 13a). The maximum bed shear stress predicted by RANS is
 $\bar{\tau }/{\tau _m} = 1$ and the peak value is situated farther from the cylinder compared with DES. The differences between URANS and DES at t = T/2 are much smaller in the KC = 30.8 case.
Non-dimensional instantaneous and phase-averaged bed shear stress, τ/τm and  $\bar{\tau }/{\tau _m}$, along the x direction (y/D = 0 plane) at the upstream (horseshoe vortex) side of the cylinder at t = T/4
 $(\hat{u}^{\prime} = 1)$ and at t = T/2
 $(\hat{u}^{\prime} = 0)$: (a) KC = 15.4; (b) KC = 30.8. Solid lines represent phase-averaged values. Dashed lines are used for instantaneous values during an oscillatory cycle when relatively large bed shear stress magnitudes are induced close to the cylinder.

Figure 14 provides more information of the dynamics of the main horseshoe vortex in the symmetry plane. This vortex forms a short time after the incoming flow velocity becomes positive. As KC decreases, the vortex forms closer to the cylinder. The patch of vorticity situated near the junction line between the cylinder and the bed in the KC = 15.4 and 30.8 cases is not a horseshoe vortex. When the incoming flow velocity is the largest (t = T/4), the circulation of the horseshoe increases monotonically with KC. This result is consistent with the bed shear stress distributions in figure 10 that show  $\bar{\tau }/{\tau _m}$ at t = T/4 also increases with KC beneath the horseshoe vortex. As the flow decelerates (T/4 < t < T/2), the main horseshoe vortex moves away from the cylinder in the KC = 30 and 15 cases. This does not happen in the KC = 8 case which is characterized by a large growth of the core of the horseshoe vortex between t = T/4 and t = 3T/8 (see also figure 5c) when the flow starts decelerating. In all simulations conducted with KC ≥ 8, the horseshoe vortex survives past the time the incoming velocity reaches a zero value (e.g. it is still present in the flow fields at t = T/2 in figure 5c) but completely loses its coherence shortly after the incoming flow changes direction. An increase in the size of the core during the deceleration phase (T/4 < t < T/2) does not necessarily translate into an increase of the bed shear stress magnitude beneath the horseshoe vortex. This is because the increase in the size of the core is generally accompanied by an increase of the distance between the axis of the vortex and the bed surface. Still, the large growth of the circulation in the KC = 8 case between t = T/4 and t = T/2 is sufficient to generate a horseshow vortex with a relatively high capacity to entrain sediment near t = T/2, when the approaching flow velocity is zero (figure 9b).
Non-dimensional out-of-plane vorticity,  ${\omega _y}H$/Um, at t = T/4 (
 $\hat{u}^{\prime} = 1$, left-hand panels), t = 3T/8 (
 $\hat{u}^{\prime} = 0.7$, middle panels) and t = T/2 (
 $\hat{u}^{\prime} = 0$, right-hand panels) during the oscillatory cycle in the y/D = 0 plane visualizing the dynamics of the horseshoe vortices (DES predictions): (a) KC = 30.8; (b) KC = 15.4; (c) KC = 8.

5. Volumetric flux of entrained sediment
To characterize in an average way the capacity of the flow to entrain sediment, one has to consider not only the phase-averaged value of the bed shear stress,  $\bar{\tau }$, but also the cycle-to-cycle variations of the instantaneous bed shear stresses with respect to the phase-averaged values. This is similar to the case of a cylinder with incoming steady flow; besides
 $\bar{\tau }$ the values of the standard deviation of the bed shear stress should be considered when evaluating the capacity of the flow to entrain sediment (Sumer et al. Reference Sumer, Chua, Cheng and Fredsøe2003; Cheng et al. Reference Cheng, Koken and Constantinescu2018). In the case where the incoming flow is oscillatory, some of the largest contributions to the instantaneous stress,
 $\tau $, are not due to random temporal variations of the coherence of some of the large-scale, near-bed coherent structures or of the paths followed by these eddies as they are advected away from the cylinder. Rather, the main reason for the very high amplification of the bed shear stress during some of the oscillatory cycles is the departure from the dominant wake-shedding pattern observed over most of the oscillatory cycles. A good example is the KC = 15 case where sometimes two vortices are shed during a half-cycle instead of one vortex, which is the case for most of the half-cycles.
One simple way to assess the effect of varying the KC number on the sediment entrainment capacity of the flow around the cylinder at conditions corresponding to the start of the local scour process (e.g. flat bed) is to calculate the phase-averaged flux of entrained sediment based on the instantaneous flow fields,  $\overline {{I_n}} $. Sediment entrainment formulas for non-cohesive sediment generally assume the sediment flux is proportional to
 ${(\tau - {\tau _c})^\gamma }$ with γ > 1, where
 ${\tau _c}$ is the critical value for sediment entrainment for a given mean particle diameter, d 50 (Chou & Fringer Reference Chou and Fringer2010). For example, γ = 1.5 in van Rijn's (Reference van Rijn1984) formula to estimate the volumetric flux of sediment entrainment per unit time and area. This formula is often used in eddy-resolving simulations with a movable bed (e.g. see Chou & Fringer Reference Chou and Fringer2010). In non-dimensional form, the volumetric flux of sediment entrained from the bed at any given time during the oscillatory cycle with index n can be written as
 \begin{equation}{I_n}(t/T) = \frac{1}{{{\rho ^{1.5}}U_m^3{D^2}}}\int_{A^{\prime}} {{{(\tau - {\tau _c})}^{1.5}}\,\textrm{d}A^{\prime}} ,\end{equation}
where A′(t) is the bed region of the whole computational domain where  $\tau (t,x,y) > {\tau _c}$ and 0 < t/T ≤ 1. The phase-averaged flux
 $\overline {{I_n}} (t/T)$ is the average value of
 ${I_n}$ over the N cycles used for phase averaging. Given that the series of simulations with varying KC were performed with constant H, D and Um, one can compare the erosive capability of the flow associated with local scour around the cylinder by assuming a constant value of
 ${\tau _c}$ that is sufficiently large such that no erosion occurs in the undisturbed flow.
The sediment fluxes were calculated in figure 15 assuming  ${\tau _c}/\rho U_m^2 = 0.0048$. This value was higher than the maximum bed shear stress away from the cylinder such that all entrainment is due to the presence of the cylinder. For example, assuming a laboratory-scale experiment performed with Um = 0.18 m s−1 and D = 0.04 m, the aforementioned value of
 ${\tau _c}$ will correspond to sediment with d 50 = 0.3 mm based on Shields’ diagram. Relatively large differences are observed between
 $\overline {{I_n}} $ and the values of the volumetric flux for some of the oscillatory cycles. Generally, this happens for the cycles in which the wake-shedding pattern and/or the coherence of the shed vortices are significantly different from those observed for most of the other oscillatory cycles. The combined effects of the cycle-to-cycle variations of the coherence of the main near-bed coherent structures and of the smaller-scale turbulent eddies on entrainment can be estimated by looking at the difference between
 $\overline {{I_n}} $ and the entrainment flux calculated based on the phase-averaged bed shear stress,
 $\bar{I} = (1/{\rho ^{1.5}}U_m^3{D^2})\int_{A^{\prime}} {{{(\bar{\tau } - {\tau _c})}^{1.5}}\,\textrm{d}A^{\prime}} $. The values of
 $\bar{I}$ are also included in figure 15.
Non-dimensional volumetric flux of entrained sediment per unit time versus non-dimensional time, t/T (DES predictions): (a) KC = 1.5; (b) KC = 8; (c) KC = 15.4; (d) KC = 30.8. Results are plotted for  $\; {\tau _c}/\rho U_m^2 = 0.0048$. The symbols show the values of the instantaneous flux, In, for each oscillatory cycle (n = 1 to 20) used to calculate the mean (phase-averaged) flux,
 $\overline {{I_n}} $. Also shown is the mean flux calculated using the phase-averaged bed shear stress,
 $\bar{I}$.

For all KC values the fluxes  $\overline {{I_n}} $ and
 $\bar{I}$ peak at t = T/4 and 3T/4 when the velocity magnitude in the undisturbed flow is the largest. The largest cycle-to-cycle variation of
 ${I_n}$ is observed for KC = 15.4. In this case, the maximum values of
 ${I_n}/\overline {{I_n}} \;$ are larger than 2 over most of the cycle (figure 15c). This means that the volumetric flux of entrained sediment over some of the cycles can be much larger than the cycle-averaged value. Consistent with this result, the standard deviation of
 ${I_n}$ is also the largest for the KC = 15.4 case over most of the oscillatory cycle (figure 16). It is only when the undisturbed flow velocity is close to zero (t ≈ 0T and T/2) and the entrainment is negligible that the standard deviation of
 ${I_n}$ is basically independent of KC (figure 16). The large variation of
 ${I_n}$ in the KC = 15.4 case is explained by the fact that this is the case with the most irregular wake-shedding pattern among the four cases analysed in figure 15.
Standard deviation of the non-dimensional volumetric flux of entrained sediment per unit time versus non-dimensional time, t/T (DES predictions).

The mean value of the volumetric flux of entrained sediment over one oscillatory cycle  $\overline {{F_n}} $ is obtained by integrating
 $\overline {{I_n}} $ from t/T = 0 to t/T = 1. Similarly, one can calculate the volumetric flux of sediment entrained over one oscillatory cycle using the values of
 $\; \bar{I}$ rather than
 $\overline {{I_n}} $. This flux is denoted
 $\bar{F}$. Figure 17(a) shows that
 $\overline {{F_n}} $ peaks for 8 < KC < 15.4 before starting to decrease for KC > 15.4. Meanwhile,
 $\bar{F}$ peaks for KC ≈ 8 and then decreases monotonically with increasing KC. As expected,
 $\bar{F} = \overline {{F_n}} $ for KC = 1.5 as the flow is periodic. The ratio
 $\bar{F}/\overline {{F_n}} $ decreases to 0.66 for KC = 8 and is close to 0.5 for KC > 8. This means that coherent structures whose dynamics is not quasi-periodic (e.g. some of the shed wake vortices and near-bed vortices parallel to the bed) play a major role in sediment entrainment at relatively large KC numbers.
Mean non-dimensional volumetric flux of entrained sediment over one oscillatory cycle (DES predictions): (a)  ${\tau _c}/\rho U_m^2 = 0.0048$; (b)
 ${\tau _c}/{\tau _m} = 1.5$. The fluxes
 $\overline {{F_n}} \; $ and
 $\bar{F}\; $ are calculated based on In and
 $\bar{I}$, respectively.

Another way to compare the sediment entrainment capacity of the flow among test cases with varying KC is to choose the values of H, Um and T such that the non-dimensional bed shear stresses induced in the undisturbed flow region are about the same, which means that  $\; {\tau _m}/\rho U_m^2$ should be independent of KC. In this case, the critical bed shear stress for sediment entrainment should be the same for all test cases. Figure 17(b) shows the variations of
 $\bar{F}$ and
 $\overline {{F_n}} $ with KC assuming
 ${\tau _c}/{\tau _m} = 1.5$. Results in figures 17(a) and 17(b) are qualitatively similar. The only difference is that
 $\overline {{F_n}} $ reaches its maximum for KC = 15.4 when the flux is calculated assuming
 ${\tau _c}/{\tau _m} = 1.5$.
6. Forces acting on the cylinder
Figures 18 and 19 compare the non-dimensional phase-averaged streamwise and spanwise forces acting on the solid cylinder,  $\overline {{F_x}} (t/T)$ and
 $\overline {{F_y}} (t/T)$, for the test cases with unimodal forcing (1.5 ≤ KC ≤ 30.8) based on DES predictions. Following the usual convention used for forces acting on obstacles in oscillatory unidirectional flow (e.g. see Williamson Reference Williamson1985), the total streamwise force will be referred to as the in-line force. The spanwise forces in the present geometrical set-up with a vertical cylinder correspond to the lift forces for cases where the cylinder is positioned horizontally (e.g. see Keulegan & Carpenter Reference Keulegan and Carpenter1958). The instantaneous and phase-averaged forces were obtained by integrating the pressure and shear stresses over the surface of the cylinder, between the channel bottom and the top surface, and then normalizing by
 $\rho U_a^2DH$, where Ua = 0.622Um is the mean value of
 $|\hat{u}|$ over one oscillatory cycle. The phase averaging was conducted over 20 oscillatory cycles. We checked that phase averaging over the first 10 cycles and over the last 10 cycles produced very similar results. Given the small height of the bottom boundary layer relative to the flow depth in the approaching flow (figure 2), no significant variations were observed in the distributions of the streamwise and spanwise forces per unit height when these forces were estimated over the whole height of the cylinder (figures 18 and 19) or only over the part situated outside of the bottom boundary layer.
Non-dimensional (streamwise) in-line force versus non-dimensional time, t/T (DES predictions): (a) KC = 1.5; (b) KC = 8; (c) KC = 15.4; (d) KC = 30.8. The open symbols show the values of the instantaneous in-line force,  ${F_x}$, for each oscillatory cycle (n = 1 to 20) used to calculate the mean (phase-averaged) drag force,
 $\overline {{F_x}} $. The instantaneous and phase-averaged values are very close for KC = 8. Also included (solid red line) is the in-line force
 $\overline {{F_{IF}}} $ predicted using Morison's equation.

Non-dimensional spanwise force versus non-dimensional time, t/T (DES predictions): (a) KC = 1.5; (b) KC = 8; (c) KC = 15.4; (d) KC = 30.8. The open symbols show the values of the instantaneous drag force,  ${F_y}$, for each oscillatory cycle (n = 1 to 20) used to calculate the mean (phase-averaged) force,
 $\overline {{F_y}} $.

For cylinders placed in oscillatory and wave flow, the prediction of the in-line force per unit length acting on the cylinder is modelled using an equation proposed by Morison et al. (Reference Morison, O'Brien, Johnson and Schaaf1950) that splits the in-line force into two components due to the inertia and the drag force contributions. If the phase-averaged, in-line force non-dimensionalized by  $\rho U_a^2D$ is denoted
 $\overline {{F_{IF}}} (t/T)$, then Morison's equation for a circular cylinder is
 \begin{equation}\overline {{F_{IF}}} = {C_m}\frac{{\rm \pi} }{4}\frac{D}{{TU_a^2}}\frac{{\partial \hat{u}}}{{\partial \left( {\frac{t}{T}} \right)}} + {C_d}\frac{1}{2}\frac{{\hat{u}|\hat{u}|}}{{U_a^2}} = {C_m}\frac{{\rm \pi} }{4}\frac{1}{{{{0.622}^2}KC}}\frac{{\partial \hat{u}^{\prime}}}{{\partial \left( {\frac{t}{T}} \right)}} + {C_d}\frac{1}{2}\frac{{\hat{u}^{\prime}|\hat{u}^{\prime}|}}{{{{0.622}^2}}},\end{equation}
where  ${C_m}$ and
 ${C_d}$ are the inertia and drag coefficients, respectively. Keulegan & Carpenter (Reference Keulegan and Carpenter1958) evaluated these coefficients based on experiments conducted with a horizontal cylinder placed below the free surface in a basin with standing waves surging in it. They found that for a circular cylinder
 ${C_m}$ is close to 2.0 for small KC numbers and reaches a minimum
 $({C_m} \approx 0.7)$ for KC ≈ 15. It then starts to monotonically increase with KC to reach
 ${C_m} \approx 2.5$ for KC = 120. For small KC numbers,
 ${C_d}$ increases with KC to reach a value close to 2.3 for KC = 15. It then gradually decreases with increasing KC to reach the steady flow value
 $({C_d} \approx 1.0)$ for
 $KC \gg 100$. Using the expression for
 $\hat{u}^{\prime}$, (6.1) can be written as
 \begin{equation}\overline {{F_{IF}}} = {C_1}\cos \left( {2{\rm \pi} \frac{t}{T}} \right) + {C_2}\sin \left( {2{\rm \pi} \frac{t}{T}} \right)\left|{\sin \left( {2{\rm \pi} \frac{t}{T}} \right)} \right|.\end{equation}
Figure 18 shows the variation of  $\overline {{F_x}} $ together with a best-fit function for
 $\overline {{F_{IF}}} $. One can see that for all four cases
 $\overline {{F_{IF}}} $ provides a fairly good approximation to
 $\overline {{F_x}} $ over the oscillatory cycle. Using the
 ${C_1}$ and
 ${C_2}$ constants given in figure 18, one can calculate
 ${C_m}$ and
 ${C_d}$. Despite the different set-up of the present simulations (e.g. orientation of the cylinder, Reynolds number) compared with that in the study conducted by Keulegan & Carpenter (Reference Keulegan and Carpenter1958), the predicted values of
 ${C_m}$ and
 ${C_d}$ (table 2) are fairly close to the values inferred from experiments (see figures 10 and 11 in Keulegan & Carpenter (Reference Keulegan and Carpenter1958)).
Non-dimensional variables characterizing the forces acting on the cylinder for the test cases conducted with purely oscillatory flow (one-mode forcing).

Table 2 also includes the values of the maximum magnitude of the in-line drag force  ${F_{x,max}}/(\rho U_m^2DH)$ recorded over the oscillatory cycles analysed in figure 18. These forces are on average 15 %–20 % smaller than the values compiled by Keulegan & Carpenter (Reference Keulegan and Carpenter1958). The difference is partially due to the boundary layer forming at the channel bottom in the present simulations conducted with a vertical surface-mounted cylinder. The phase angles where the maximum force is reached are close to 0° and 45° in the KC = 1.5 and 8 simulations, respectively. The phase angle is about 90° in the KC = 15.4 and 30.8 simulations. If one accounts for the 90° phase difference in the forcing used in the experiments and present simulations, the values reported in figure 31 by Keulegan & Carpenter (Reference Keulegan and Carpenter1958) are similar to those predicted by the present simulations.
The variations of the in-line and spanwise forces during the oscillatory cycles can be used to calculate the root-mean-square (r.m.s.) of the two forces. Following Williamson (Reference Williamson1985), the r.m.s. of the in-line and spanwise forces are reported in the form of a force coefficient where the force acting on the whole cylinder is non-dimensionalized by  $({\textstyle{1 \over 2}}\rho ({D^2}/{T^2})DH = {\textstyle{1 \over 2}}\rho (U_m^2/K{C^2})DH)$. The estimated values of the r.m.s. coefficients for the in-line
 $(C_{Fx}^{rms})$ and spanwise
 $(C_{Fy}^{rms})$ forces are also included in table 2. Williamson (Reference Williamson1985) proposed an empirical formula,
 $C_{Fx}^{rms} = {(160K{C^2} + 0.69K{C^4})^{0.5}}$, that fitted very well the estimations of the r.m.s. of the in-line force based on his experimental data. The values given by this formula (
 $C_{Fx}^{rms} = 19.0$, 81.64, 277.0 and 879.1 for KC = 1.5, 8.0, 15.4 and 30.8, respectively) are fairly close to the values estimated from the present simulations (table 2). The scatter in the experimental data (see figure 22 in Williamson (Reference Williamson1985)) is very high for
 $C_{Fy}^{rms}$ no and clear trend can be identified in the variation of
 $C_{Fy}^{rms}$ with KC except for the fact that
 $C_{Fy}^{rms}$ is expected to be very small for KC < 6. Most of the experiments predicted
 $20 < C_{Fy}^{rms} < 100$ for KC > 6 with a peak measured value close to 180 for KC ≈ 11. The values reported in table 2 are consistent with this range except for KC = 15.4 where
 $C_{Fy}^{rms}$ is close to 310.0. This increase is attributed to the fact that, after formation on one side of the cylinder, most of the shed vortices are advected over the other side of the cylinder. Large spanwise forces are induced as these very coherent vortices move near one side of the cylinder. Moreover, this is also the case where the number of vortices shed over one half-cycle is not always the same.
For KC = 1.5,  $\overline {{F_x}} $ is well approximated by a cosine function (figure 18a). This means that for sufficiently small KC numbers,
 $\overline {{F_x}} (t)$ has the same (sinusoidal) shape as the velocity in the undisturbed flow but is out of phase with it (e.g.
 $\overline {{F_x}} (t)\sim \hat{u}^{\prime}(t + T/2)$). One should note that for this case
 ${C_d} \approx 0$, which confirms that for very small KC numbers the in-line force in unidirectional oscillatory flow is due only to inertia effects.
Once shedding occurs at the lee side of the cylinder (KC > 6), the in-line force variation becomes more complex and the phase difference starts decreasing monotonically with increasing KC (figure 18b–d). The contributions of both the inertia force and the drag force components are significant in the simulations conducted with KC ≥ 8 (table 2). For KC = 30.8, the maximum and minimum values of the in-line force are close to in phase with the maximum and minimum velocities in the undisturbed flow occurring at t = T/4 and t = 3T/4, respectively. Meanwhile,  $\overline {{F_x}} $ is small, but not equal to 0, at t = 0 and T/2 (figure 18d). The largest cycle-to-cycle variations of the instantaneous in-line force,
 ${F_x}$, are observed for KC = 8. This information is presented in a more quantitative way in figure 20(a) that shows the standard deviation of
 ${F_x}$ with respect to the phase-averaged value at representative times during the oscillatory cycle. At lower KC numbers, the largest standard deviations of
 ${F_x}$ occur during the time the incoming flow accelerates towards the cylinder (e.g. t ≈ T/8 for KC = 8). Once the phase lag between
 ${F_x}$ and
 $\hat{u}^{\prime}$ decreases, the largest standard deviations occur close to t = T/4 (KC = 15.4 and 30.8). The peak values of the standard deviation reduce by about 50 % as KC increases from 8 to 15.4. Other relevant variables characterizing the ‘mean’ magnitude of the in-line forces experienced by the cylinder over the oscillatory cycle are the r.m.s. of
 $\overline {{F_x}} $ and the momentum of the in-line force magnitude over the oscillatory cycle
 ${M_x} = {\textstyle{1 \over 2}}\int_0^1 {|\overline {{F_x}} |\; \,\textrm{d}(t/T)} $. Both
 ${\overline {{F_x}} ^{rms}}$ and Mx show a sharp decay as KC increases from 1.5 to 8. This is followed by a much milder monotonic decay regime for KC ≥ 8 (see figure 21 and table 2).
Standard deviation of the non-dimensional force acting on the cylinder along the streamwise and spanwise directions (DES predictions): (a)  $F_x^{SD}$; (b)
 $F_y^{SD}$.

Oscillatory behaviour of the phase-averaged, non-dimensional (streamwise) in-line force,  $\overline {{F_x}} $ (DES predictions): (a) r.m.s. of
 $\overline {{F_x}} $; (b) non-dimensional in-line force momentum over the half of the oscillatory cycle when
 $\overline {{F_x}} > 0$.

Figure 19 shows that for a range of KC numbers the cylinder is subject to significant phase-averaged spanwise forces during the oscillatory cycle. As expected, for cases with no shedding the mean and the instantaneous spanwise forces are equal to zero (e.g. see results for KC = 1.5 in figure 19a). This is because the flow remains symmetric with respect to the y/D = 0 axis. Interestingly,  $\overline {{F_y}} $ is also very close to zero during the oscillatory cycle for sufficiently high KC numbers (e.g. see results for KC = 30.8 in figure 19d). However, for large KC numbers, the cylinder can experience large instantaneous spanwise forces during some of the cycles. For example, the peak in-line forces occur at t = T/4 and 3T/4 for KC = 30.8. At these times,
 $|\overline {{F_x}} |\approx 2.5$ and the peak magnitude of
 ${F_x}$ is close to 3. While for
 $|\overline {{F_y}} |\approx 0$, the peak magnitude of
 ${F_y}$ is close to 3.5 at t = T/4 and 3T/4. These forces are mainly induced by some of the highly coherent vortices generated in the flow as they interact with the cylinder.
For KC = 8 (figure 19b) and KC = 15.4 (figure 19c), the oscillatory flow is characterized by non-zero mean spanwise forces. The peak magnitude of  $\overline {{F_y}} $ is close to 2.2 and 5.5, respectively. These values are significant given that the peak magnitudes of
 $\overline {{F_x}} $ are close to 2.7 for both KC = 8 and 15.5. The peak values of
 $\; \overline {{F_y}} $ occur at times when also peak values are recorded for
 $\overline {{F_x}} $. This regime characterized by non-zero mean spanwise forces occurs for cases when at least one of the vortices shed during half of the oscillatory cycle moves back towards the cylinder and past it during the next half of the oscillatory cycle. In both cases, the peak magnitudes of
 ${F_y}$ occur at times when the magnitude of
 $\overline {{F_y}} $ is also high (e.g. t = T/8, T/4 and 3T/8 for KC = 8 and t = T/4 for KC = 15.4). This is confirmed by the variation of the standard deviation of
 ${F_y}$ for these two cases shown in figure 20(b). As KC increases and the flow reaches a regime where the shed wake vortices do not move back past the cylinder, the standard deviation of
 ${F_y}$ decays with increasing KC over most of the oscillatory cycle (e.g. compare results for KC = 15.4 and 30.8 in figure 20b).
Figure 22 compares the phase-averaged in-line force coefficient for the cylinder,  $\overline {{C_{Fx}}} = \overline {{F_x}} /0.5\rho {\hat{u}^2}(t)DH$, during the oscillatory cycle. Also shown are the in-line force coefficients,
 $\; {C_{Fx}}$, calculated using the instantaneous drag force,
 ${F_x}$, for each of the 20 oscillatory cycles used for phase averaging. These coefficients are similar to the standard streamwise drag coefficients defined in steady flow past cylinders. No values of
 ${C_{Fx}}$ were included for the KC = 1.5 case because the solution is periodic
 $(\overline {{C_{Fx}}} = \; {C_{Fx}})$. The in-line force coefficient is not defined for t/T = 0 and 0.5 when
 $\hat{u} = 0$. For KC > 15, the phase-averaged in-line force coefficients do not vary much the oscillatory cycle. This is different from cases with KC ≤ 8 for which the in-line force coefficient is equal to zero twice during the oscillatory cycle as the in-line force becomes zero for non-zero values of the incoming velocity. On average, the largest in-line force coefficients are predicted in the KC = 1.5 case for which
 $\overline {{C_{Fx}}} = 9\unicode{x2013} 10$ except for times close to T/4 and 3T/4 when the in-line force and the corresponding in-line force coefficient approach zero.
In-line force coefficient versus non-dimensional time, t/T (DES predictions): (a) KC = 1.5; (b) KC = 8; (c) KC = 15.4; (d) KC = 30.8. The open symbols show the values of the instantaneous in-line force coefficient,  ${C_{Fx}}$, for each oscillatory cycle (n = 1 to 20) used to calculate the mean (phase-averaged) in-line force coefficient,
 $\overline {{C_{Fx}}} $. The instantaneous and phase-averaged values are very close for KC = 8. To get the force coefficient, the in-line force is non-dimensionalized with the depth-averaged streamwise velocity in the undisturbed flow,
 $\hat{u}(t/T)$, and the projected area, HD. No values can be calculated for t/T = 0 and 0.5 when
 $\hat{u} = 0$.

It is also relevant to point out that  $\overline {{C_{Fx}}} $ varies roughly between 0.8 and 1.1 in the KC = 15.4 and 30.8 cases with Re = 130 000. A value of 1.2 is expected for the total drag coefficient of long cylinders in steady incoming flow with Re ≈ 105. As the incoming velocity varies during the oscillatory cycle, the cylinder will experience lower physical Reynolds numbers. Still, the streamwise drag coefficient will not get below 0.9 as long as the Reynolds numbers remain larger than 2500, which will correspond to most of the oscillatory cycle in the cases discussed in this section. This result suggests that for sufficiently high KC numbers the phase-averaged in-line force coefficients during the oscillatory cycle are only 10 %–15 % smaller than the mean (time-averaged) drag coefficient for a case with incoming steady flow at the same Reynolds number. For circular cylinders, this result assumes that the physical Reynolds numbers defined with the unsteady undisturbed flow velocity are larger than 2500 and smaller than the Reynolds number at which the drag crisis starts.
As for the in-line force, the largest cycle-to-cycle variations in the values of  ${C_{Fx}}$ occur at t = T/8 and 5T/8 in the KC = 8 case (figure 22b). By contrast, the standard deviation of
 ${C_{Fx}}$ varies much less during the oscillatory cycle in the KC = 15.4 (figure 22c) and KC = 30.8 (figure 22d) cases.
7. Summary and conclusions
The better performance of DES compared with URANS in predicting the maximum amplification of the bed shear stress in front and behind the surface-mounted vertical cylinder with incoming oscillatory flow was linked to the superior capability of DES to capture the formation, coherence and dynamics of the energetically important eddies in the flow. In agreement with previous numerical investigations of this type of flow (e.g. see Baykal et al. Reference Baykal, Sumer, Fuhrman, Jacobsen and Fredsøe2017), for sufficiently large KC numbers, DES predicted the formation and shedding of wake vortices whose cores remained close to vertical over the whole flow depth. This is different from the behaviour of these vortices in flow past a circular cylinder with steady incoming flow where the cores of these vortices become inclined and are severely stretched as they approach the bed surface (Kirkil & Constantinescu Reference Kirkil and Constantinescu2015). The fact that the cores remained close to vertical and were subject to minimal stretching as they interacted with the bed is the main reason why the largest instantaneous bed shear stresses beneath these vortices were comparable to the peak values recorded in the regions of strong flow acceleration near the cylinder. Wake vortices whose cores remain vertical as they reach the bed and that can induce large bed shear stresses can also occur with steady incoming flow but only for cylinders of non-circular shape that contain sharp corners (e.g. for rectangular cylinders, see Kirkil & Constantinescu Reference Kirkil and Constantinescu2009).
Besides the vertical wake vortices, DES predicted the formation of near-bed horizontal vortices at the back of the cylinder and inside the near-wake region. The formation mechanism of these vortices is driven by the interaction of the deformed cores of the vertical wake vortices with the bed surface. Similar to the finger (secondary) vortices forming in the wake of long cylinders due to the spanwise instabilities propagating along the cores of the main wake vortices, an eddy-resolving technique is needed to capture the formation of these near-bed vortices. The peak bed shear stresses occurred in the regions of strong flow acceleration forming close to the upstream face of the cylinder only at times when the incoming velocity magnitude was close to its peak values. At other times during the oscillatory cycle, the amplification of the bed shear stress was mainly driven by the cores of the wake billows, by the main horseshoe vortex and by some of the near-bed horizontal vortices.
The capability of DES to accurately predict the bed shear stress distributions around the cylinder for fixed bathymetry (e.g. flat bed) is particularly relevant for designing scour protection measures around pile foundations. Calibration of design formulas for the minimum size of the stone forming the rock apron around the pile requires estimation of the peak mean shear stress over the rock apron given a certain approach flow and pile geometry. Such an approach based on 3-D simulations was used by Wu, Zeng & Constantinescu (Reference Wu, Zeng and Constantinescu2021) for designing riprap apron protections at bridge abutments with a steady current. That approach can be easily used with a DES solver and extended for monopile foundations placed in oscillatory flow or for cases where the oscillatory flow is superimposed with a steady current.
Consistent with previous experimental and URANS studies of oscillatory flow past cylinders conducted at lower Reynolds numbers (e.g. Sumer et al. Reference Sumer, Christiansen and Fredsøe1997; Baykal et al. Reference Baykal, Sumer, Fuhrman, Jacobsen and Fredsøe2017), the present high-Reynolds-number simulations with unimodal oscillatory flow showed that the wake structure, the number of vortices shed every half-cycle and the dynamics of these vortices are mainly dependent on the KC number. The predicted wake dynamics in the KC = 1.5 case (no vortex shedding, periodic flow) and the KC = 15.4 case (one vortex shed each half-period) is in good general agreement with the experimental observations of Sumer et al. (Reference Sumer, Christiansen and Fredsøe1997) for cases with KC < 23. The shedding of three vortices in the KC = 30.8 case is consistent with the increase of the number of shed vortices with increasing KC observed by Williamson (Reference Williamson1985) and Sumer et al. (Reference Sumer, Christiansen and Fredsøe1997).
The present study showed that for KC numbers close to values where the number of shed vortices over each half-cycle increases by one (e.g. KC ≈ 17 where the number of shed vortices increases from one to two), the number of shed vortices is not always the same for all the half-cycles. For example, in the KC = 15.4 simulation two vortices were sometimes shed over a half-cycle instead of one vortex. Such cases are characterized by the largest cycle-to-cycle variation of quantities of engineering interest like the phase-averaged variation of the flux of sediment entrained from the bed and the drag forces acting on the cylinder.
For KC numbers only slightly larger than the threshold value for the formation of wake vortices (KC ≈ 6), the dynamics of the wake vortices is quite different from that observed at large KC numbers where the anti-symmetric wake-shedding mode dominates, similar to the case of long cylinders. The KC = 8 simulation revealed that two fairly symmetric vortices form at the back of the cylinder during each half-cycle. None of these vortices is advected into the wake during the half-cycle where they form. Rather these vortices move over the other side of the cylinder during the next half-cycle when the incoming flow reverses. Previous experimental studies also reported cases where some of the vortices shed at the back of the cylinder can be washed past the cylinder during the next half-cycle. The different wake dynamics observed for KC numbers for which two strongly coherent, counter-rotating vortices move past the cylinder during the next half-cycle was found to have important consequences in terms of the bed shear stress distributions near the cylinder. As the two vortices pass the cylinder, they induce a jet-like flow oriented towards the cylinder between their cores. This phenomenon happens at times when the incoming flow velocity magnitude is low and the peak velocity amplification is driven by these two vortices. The phase-averaged bed shear stress magnitudes generated during this part of the oscillatory cycle can be larger than those induced by the horseshoe vortex when its coherence is the highest during the oscillatory cycle. For such cases, the sediment erosion mechanisms close to the cylinder are much more complex that those observed for cylinders with steady incoming flow.
The availability of the 3-D instantaneous and phase-averaged velocity fields allowed estimating the variation of the sediment entrainment potential of the flow with the KC number. If the depth-averaged velocity in the undisturbed oscillatory flow was assumed constant, results showed that the mean (cycle-averaged) volumetric flux of sediment entrained from the bed over one oscillatory cycle peaks for 8 < KC < 15.4. The volumetric flux of entrained sediment calculated using the phase-averaged flow field peaked for KC ≈ 8 and then decreased monotonically with increasing KC. This component was found to account for less than 50 % of the flux calculated based on the instantaneous flow fields for KC ≥ 15.4. This means that coherent structures whose dynamics is not quasi-periodic (e.g. some of the shed wake vortices and near-bed vortices whose axes are parallel to the bed) play a major role in sediment entrainment at relatively large KC numbers.
In the KC = 1.5 simulation the flow was periodic. The in-line force acting on the cylinder was unimodal but out of phase with the incoming velocity forcing. The spanwise force was equal to zero at all times. For sufficiently high KC numbers for vortices to form at the back of the cylinder, the phase-averaged in-line force variation became multimodal. Despite its simplifying assumptions, Morison's equation was found to approximate reasonably well the variation of the phase-averaged in-line force during the oscillatory cycle for a surface-mounted cylinder with 1.5 ≤ KC ≤ 30.8. The inertia term was found to be the dominant one in the KC = 1.5 simulation. The phase lag between the maximum values of the incoming velocity magnitude and in-line force monotonically decayed with increasing KC such that the lag was close to zero for KC = 30.8. For KC ≥ 15, the phase-averaged in-line force coefficients varied between 0.8 and 1.1 during most of the oscillatory cycle. The corresponding drag coefficient for a cylinder in steady flow at a Reynolds number defined with the peak incoming velocity is 1.2. This means that for sufficiently high KC numbers the phase-averaged in-line force coefficient during the oscillatory cycle is only 10 %–15 % smaller than the drag coefficient in steady flow past a cylinder at the same Reynolds number.
Quantification of the cycle-averaged and instantaneous forces acting on the cylinder revealed that, for a certain range of KC numbers, the phase-averaged and instantaneous spanwise forces were non-negligible. Over an intermediate range of KC numbers (e.g. for KC = 8 and KC = 15.4), the cylinder was subject to phase-averaged spanwise forces that were comparable to the peak phase-averaged in-line forces. At large KC numbers (e.g. for KC = 30.8), the phase-averaged spanwise force was equal to zero over the whole oscillatory cycle but the cylinder was still subject to large instantaneous spanwise forces over part of the oscillatory cycle. These findings are relevant both for fatigue analysis and for applications where the cylinder is flexible (e.g. plant stems).
The present study provided detailed information on the flow physics and dynamics of coherent structures for the most canonical configuration (e.g. isolated, emerged circular cylinder). Using the knowledge acquired for this limiting case, one can analyse more complex cases of relevance to practical applications. They include cases in which the incoming flow has both an oscillatory component and a steady component, cases in which the cylinder is placed on a surface containing bedforms (Chang & Constantinescu Reference Chang and Constantinescu2013) and configurations containing an array of cylinders (e.g. offshore wind farms or circular patches of vegetation with a given porosity).
Acknowledgements
We would like to thank Professor M. Sumer for providing details of his experimental data and numerical simulations. We gratefully acknowledge the National Center for High-Performance Computing (NCHC) in Taiwan for providing the computational resources needed to conduct the simulations.
Declaration of interests
The authors report no conflict of interest.


 Open access

