


1. Introduction
Traditionally, business cycle theory and growth theory have been treated as unrelated areas of macroeconomics. As endogenous growth theory developed in the late 1980s, it explored the idea of analyzing interactions between growth and business cycles, abandoning the traditional decomposition approach that defined cycles as deviations from exogenous trends.Footnote 1
If we look at the data for the G7 countries, we see a negative relationship between the frequency and the amplitude of the business cycle and the average per capita growth, as shown in Figure 1. Figure 2 makes this effect even more explicit, showing the correlation between ten-year moving averages of per capita GDP growth and its standard deviation. The correlations, computed over twenty-year sliding windows, are mostly negative across all G7 countries.Footnote 2
A wide empirical literature looks systematically at this relationship between economic fluctuations and long-term economic growth. The study by Ramey and Ramey (Reference Ramey and Ramey1995) set a benchmark in this respect. Based on a complete panel consisting of 92 countries covering a time horizon of 1960–1985, as well as a complete sub-panel of 24 OECD countries for the period 1950–1988, the authors show that countries with higher volatility in output, measured as the standard deviation of the growth rate, have significantly lower growth rates on average, even after controlling for key growth drivers. The effect has been broadly confirmed by later research, even if estimates vary considerably across empirical studies, being sensitive to the countries considered, the period examined, the nature of data, and the methodology employed. An overview of the empirical literature is in the meta-analysis by Bakas et al. (Reference Bakas, Chortareas and Magkonis2019), to which we refer the interested reader.Footnote 3
Growth and business cycles in G7 countries. Source: Our elaborations on available yearly per capita GDP data for the period 1954-2019 across G7 Countries. The graphs show ten-year moving averages of per capita GDP growth and its standard deviation. Data source: World Bank Group (2023), World Development Indicators, retrieved from the Federal Reserve Bank of St Louis Data (FRED).

Relationship between growth and business cycles in G7 countries. Source: Our elaborations on available yearly per capita GDP data for the period 1954-2019 across G7 Countries. The graphs show correlations between ten-year moving averages of per capita GDP growth and its standard deviation (SD). Correlations are computed over twenty-year sliding windows. Data source: World Bank Group (2023), World Development Indicators, retrieved from the Federal Reserve Bank of St Louis Data (FRED).

However, endogenous growth theory has experienced difficulties in generating a negative relationship between long-run growth and the variance of innovations assumed to drive business cycles. In fact, with standard constant relative risk aversion preferences (CRRA) when the degree of risk aversion is above one, as the micro evidence suggests, an increase in the standard deviations of shocks driving fluctuations causes an increase in precautionary investment, which is conducive to an increase in both long-run growth and its time variability (see De Hek, Reference De Hek1999, Canton, Reference Canton2002 and Jones et al. Reference Jones, Manuelli, Siu and Stacchetti2005).Footnote 4 Then explanations hinging on various frictions have been proposed for the negative relationship that the data seem to indicate: irreversible investment in machines or technology (as in Pindyck, Reference Pindyck1991 and Ramey and Ramey, Reference Ramey and Ramey1991), credit constraints making it impossible to exploit the reduced opportunity cost of innovating during slumps (Aghion et al. Reference Aghion, Angeletos, Banerjee and Manova2010), New Keynesian features (e.g. wage and price rigidities) because of which negative demand shocks cause a fall in real activity and reduced accumulation of tangible and intangible capital, not compensated by the increased accumulation during booms (Blackburn and Pelloni, Reference Blackburn and Pelloni2004, Blackburn and Pelloni, Reference Blackburn and Pelloni2005 and Annicchiarico and Pelloni, Reference Annicchiarico and Pelloni2014). Other explanations go from intergenerational complementarities in education (Palivos and Varvarigos, Reference Palivos and Varvarigos2013) and countercyclical markups leading to extrinsic uncertainty (Wang and Wen, Reference Wang and Wen2011) to bad institutions and undisciplined governments (Loayza and Hnatkovska, Reference Loayza and Hnatkovska2004, Varvarigos, Reference Varvarigos2010, Fatás and Mihov, Reference Fatás and Mihov2013).Footnote 5
Recent literature has shown the usefulness of Epstein-Zin (EZ) preferences (see Epstein and Zin, Reference Epstein and Zin1989) in explaining standard asset pricing puzzles.Footnote 6 A key feature of these preferences is that the relationship between risk (RA) and intertemporal elasticity of substitution (IES) is not restricted to be reciprocal, as is the case with CRRA preferences. This generalization is attractive because it is unclear why individuals’ willingness to substitute consumption across random states of nature should be so tightly linked to their willingness to substitute consumption deterministically over time.Footnote 7
Since in modern economic theory asset prices are evaluated using marginal utilities, empirical evidence from asset markets can potentially guide the choice of preferences in macroeconomic analysis. EZ preferences have been incorporated into dynamic stochastic general equilibrium models to match basic asset pricing observations while maintaining good business cycle properties. A seminal paper in this stream of research is Tallarini (Reference Tallarini2000). More recent contributions are Van Binsbergen et al. (Reference Van Binsbergen, Fernández-Villaverde, Koijen and Rubio-Ramírez2012), Croce et al. (Reference Croce, Kung, Nguyen and Schmid2012) and Kung and Schmid (Reference Kung and Schmid2015).
This paper adds value by showing how EZ preferences can also be useful in theoretically investigating the relationship between business cycles and growth. To streamline the analysis and make the intuitive interpretation of our results more transparent, we introduce such preferences in a model specified to conform as closely as possible to the standard frictionless real business cycle model. More specifically, we adopt the framework in Jones et al. (Reference Jones, Manuelli, Siu and Stacchetti2005), in which the accumulation of human and physical capital drives unbounded growth, while the source of fluctuations is a productivity shock.
We will see how the relationship between the dispersion of shocks and mean growth in the model depends on the interplay between the elasticity of intertemporal substitution and the coefficient of risk aversion. In particular, a negative relationship is obtained when the IES and RA are both high enough, as is the case under preference parameterizations widely used for calibration purposes and empirically supported. When we go back to CRRA preferences, constraining IES and RA to be the inverse of each other, this is not possible.
To explain our results intuitively, we can reason as follows: in a stochastic environment, agents will work more when the realization of the productivity shock is higher. The expected return to savings will then increase in the shock variance. However, the certainty equivalent of the return will be reduced by risk aversion. If RA is high enough, more volatile shocks will decrease rather than increase the certainty equivalent of the return on savings. However, this will reduce savings and growth only if the IES exceeds one, so the substitution effect prevails over the income effect when choosing current consumption.
Epaulard and Pommeret (Reference Epaulard and Pommeret2003) analyze the effect of the dispersion of productivity shocks on mean growth in a model with EZ preferences. Using an AK model with no labor, they show that the sign of the effect of a higher level of the dispersion on growth is exclusively governed by the IES and is, in fact, negative whenever the IES is larger than one, while risk aversion only influences the size of the effect. In our model, instead, the sign of the effect crucially depends on both risk aversion and the intertemporal elasticity of substitution. We trace back this substantial difference in results to the restrictive assumption in Epaulard and Pommeret (Reference Epaulard and Pommeret2003) that only physical capital, not labor, is needed for production. We drop this assumption and show that labor supply and the possibility of accumulating human as well as physical capital are important in determining how short-run fluctuations influence average growth.
Our results differ from those in Epaulard and Pommeret (Reference Epaulard and Pommeret2003) not only as regards the effects of shock volatility on growth but also as regards its effects on welfare, which in their analysis are always negative, while in our model can be positive, albeit only for very low levels of RA. The possibility of welfare increasing uncertainty is the central point of Cho et al. (Reference Cho, Cooley and Kim2015) who look at the issue using a standard Ramsey model. Specifically, they assume CRRA preferences and strictly decreasing returns to capital, and they find that for very low values of RA agents can use uncertainty in their own favor. We show this is also possible with EZ preferences, although again, only for implausibly low levels of RA. With EZ preferences, higher volatility of the shocks is, in most cases, harmful even when it enhances long-run growth. This possible divergence of growth and welfare effects is also new in the literature. For instance, in an influential paper, Barlevy (Reference Barlevy2004) criticized the famous argument in Lucas (Reference Lucas1987) that the welfare gains from reducing volatility in consumption are negligible by showing that fluctuations generate high welfare costs when they negatively influence growth because of diminishing returns to investment. We show that with EZ preferences, the welfare costs of fluctuations may be high, even when the shocks causing them positively affect long-run growth.
The remainder of this paper is structured as follows. Section 2 introduces the model, Section 3 presents our results, and Section 4 concludes.
2. The model
This section outlines the baseline stochastic endogenous growth model we use for our analysis. The model features optimizing firms, households with EZ preferences, human and physical capital investments, time-stationary technology subject to random shocks, and perfect competition in all markets.
The representative firm has the following production function:
 \begin{equation} Y_{t}=As_{t}K_{d,t}^{\alpha }L_{t}^{1-\alpha },\ 0\lt \alpha \lt 1, \end{equation}
where
 $K_{d,t}$
is physical capital and
 $L_{t}$
is demand for labor in efficiency units,
 $A$
is a technological constant, while
 $s_{t}$
introduces innovation into the model and is such that
 \begin{equation} s_{t} =\exp \left ( \zeta _{t}-\frac{\sigma ^{2}}{2\left ( 1-\varphi ^{2}\right ) }\right ), \end{equation}
 \begin{equation} \zeta _{t} =\varphi \zeta _{t-1}+\varepsilon _{t},\ \varphi \in (0,1) \end{equation}
with
 $\varepsilon _{t} \sim N\left ( 0,\ \sigma ^{2}\right )$
. This parameterization implies that the levels of
 $\sigma$
and
 $\varphi$
do not affect the expected value of
 $s_{t}$
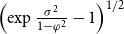
. This will allow us to consider mean-preserving increases in the dispersion of shocks, as measured by the ergodic standard deviation of
 $s_{t}.$
This is given by
 $\left ( \exp \frac{\sigma ^{2}}{1-\varphi ^{2}}-1\right ) ^{1/2}$
and is therefore increasing in both
 $\sigma$
and
 $\varphi$
. We can take this as a measure of uncertainty following use in the related theoretical literature.Footnote 8
The final good is the numéraire, so its price is normalized to one. Let
 $r_{t}$
be the rental price of capital and
 $W_{t}$
the wage. Profit maximization then imposes:
 \begin{equation} r_{t}=\alpha As_{t}K_{d,t}^{\alpha -1}L_{t}^{1-\alpha } \end{equation}
and
 \begin{equation} W_{t}=\left ( 1-\alpha \right ) As_{t}K_{d,t}^{\alpha }L_{t}^{-\alpha }, \end{equation}
so as to determine the demand for physical capital and labor.
The representative household has the following Kreps-Porteus preferences in their EZ specification:
 \begin{equation} U_{t}\left ( C_{t},l_{t}\right ) =\left ( 1-\beta \right ) u(C_{t},l_{t})+\beta \left ( \mathbb{E}_{t}U(C_{t+1},l_{t+1})^{\frac{1-\gamma }{1-\rho }}\right ) ^{\frac{1-\rho }{1-\gamma }},\ 0\lt \rho \lt 1, \end{equation}
or alternatively:
 \begin{equation} U_{t}\left ( C_{t},l_{t}\right ) =\left ( 1-\beta \right ) u(C_{t},l_{t})-\beta \left [ \mathbb{E}_{t}\left ( -U(C_{t+1},l_{t+1})\right ) ^{\frac{1-\gamma }{1-\rho }}\right ] ^{\frac{1-\rho }{1-\gamma }},\ \rho \gt 1 \end{equation}
where
 $\beta \in (0,1)$
is the discount factor, and
 $u(C_{t},l_{t})$
is the period utility function with arguments consumption
 $C_{t}$
and leisure
 $l_{t}$
;
 $\rho$
is the inverse of the intertemporal elasticity of substitution, say
 $\psi$
(i.e.
 $\rho =\psi ^{-1}$
), and
 $\gamma$
is the coefficient of relative risk aversion. See Swanson (Reference Swanson2012, Reference Swanson2018). Standard Von Neumann-Morgenstern preferences constrain the risk aversion to be the inverse of the intertemporal elasticity of substitution (in our context, this would mean
 $\gamma =\rho$
), while with EZ preferences, these two parameters are allowed to take any positive value.Footnote 9
We assume that preferences are multiplicatively separable between consumption and leisure with a period utility function:
 \begin{equation} u(C_{t},l_{t})=\frac{C_{t}^{1-\rho }\left [ 1-\chi (1-\rho )n_{t}^{1+\frac{1}{\eta }}\right ] ^{\rho }}{1-\rho }, \end{equation}
where
 $1-\chi (1-\rho )\gt 0$
for concavity,
 $\eta \gt 0$
is the Frisch elasticity of labor supply and
 $\chi \gt 0$
is a scaling parameter weighting the disutility from labor effort
 $n_{t}=1-l_{t}$
.Footnote 10 For non-recursive preferences, this specification of the period utility function was first proposed by Trabandt and Uhlig (Reference Trabandt and Uhlig2011) and is consistent with long-term growth. The fact that the Frisch elasticity of labor supply is captured by just one parameter, instead of changing with the level of consumption or labor supply, makes it easier to isolate its role in sensitivity exercises and to understand the importance of endogenous leisure choices in shaping our results. Note that if
 $\rho \lt 1$
, marginal labor disutility is stronger if consumption is higher, while the opposite is true if
 $\rho \gt 1.$
Footnote 11
The representative household accumulates not only physical capital (i.e. the final good) but also human capital
 $H_{t}$
that increases labor efficiency. The two types of capital accumulate according to the following functions:
 \begin{equation} K_{t+1} =\left ( 1-\delta _{K}\right ) K_{t}+I_{K,t}, \end{equation}
 \begin{equation} H_{t+1} =\left ( 1-\delta _{H}\right ) H_{t}+I_{H,t}, \end{equation}
where
 $I_{K}$
(
 $I_{H}$
) denotes investment in physical (human) capital and the parameter
 $\delta _{K}$
(
 $\delta _{H}$
) measures the rate of physical (human) capital depreciation. The representative household then maximizes:
 \begin{equation} V_{t}=\max _{\{n_{t},K_{t+1},H_{t+1}\}}U_{t} \end{equation}
subject to the constraints in (9)-(10), given (8), the initial stocks of capital
 $K_{0}$
and
 $H_{0}$
as well as the following flow budget constraint:
 \begin{equation} W_{t}H_{t}n_{t}+r_{t}K_{t}=C_{t}+I_{K,t}+I_{H,t}. \end{equation}
Epstein and Zin (Reference Epstein and Zin1991) prove the existence and uniqueness of
 $V_{t}$
when there is a single consumption good and no labor, which also applies if consumption and leisure form an aggregate good, as in the specification we adopt. Assuming that an interior and unique solution exists, the optimality conditions are then found to be:
 \begin{equation} C_{t}=\frac{W_{t}H_{t}}{\rho \chi \left ( 1+\frac{1}{\eta }\right ) n_{t}^{\frac{1}{\eta }}}\left [ 1-\chi (1-\rho )n_{t}^{1+\frac{1}{\eta }}\right ], \end{equation}
 \begin{equation} 1=\mathbb{E}_{t}\left [ M_{t+1}\left ( 1-\delta _{K}+r_{t+1}\right ) \right ], \end{equation}
and
 \begin{equation} 1=\mathbb{E}_{t}\left [ M_{t+1}\left ( 1-\delta _{H}+W_{t+1}n_{t+1}\right ) \right ], \end{equation}
where (13) determines labor supply, while (14) and (15) are the Euler equations referring to physical and human capital,Footnote 12 with
 $M_{t+1}$
being the stochastic discount factor in our economy, in turn, given by:
 \begin{equation} M_{t+1}=\beta \left \{ \frac{\left [ \left ( \mathbb{E}_{t}V_{t+1}^{\frac{1-\gamma }{1-\rho }}\right ) \right ] ^{\frac{1-\rho }{1-\gamma }}}{V_{t+1}}\right \} ^{\frac{\gamma -\rho }{1-\rho }}\left [ \frac{1-\chi (1-\rho )n_{t+1}^{1+\frac{1}{\eta }}}{1-\chi (1-\rho )n_{t}^{1+\frac{1}{\eta }}}\right ] ^{\rho }\left ( \frac{C_{t}}{C_{t+1}}\right ) ^{\rho },\ 0\lt \rho \lt 1 \end{equation}
or by:
 \begin{equation} M_{t+1}=\beta \left \{ \frac{\left [ \mathbb{E}_{t}\left ( -V_{t+1}\right ) ^{\frac{1-\gamma }{1-\rho }}\right ] ^{\frac{1-\rho }{1-\gamma }}}{-V_{t+1}}\right \} ^{\frac{\gamma -\rho }{1-\rho }}\left [ \frac{1-\chi (1-\rho )n_{t+1}^{1+\frac{1}{\eta }}}{1-\chi (1-\rho )n_{t}^{1+\frac{1}{\eta }}}\right ] ^{\rho }\left ( \frac{C_{t}}{C_{t+1}}\right ) ^{\rho },\ \rho \gt 1. \end{equation}
If the labor market is in equilibrium,
 $H_{t}n_{t}=L_{t},$
while
 $K_{t}=K_{d,t}$
is necessary to clear the capital market. Market general equilibrium requires these two conditions to be respected, together with the technology of production (1), the optimality conditions for the representative firm (4) and (5), and for the representative household (9), (10) and (12)-(15).
3. Calibration and results
After calibrating the model and solving it using a second-order perturbation method as in Van Binsbergen et al. (Reference Van Binsbergen, Fernández-Villaverde, Koijen and Rubio-Ramírez2012), we will present the results for our baseline calibration and discuss their implications.Footnote 13 Next, we will do a sensitivity analysis to see what happens when we change some critical parameters. This will help us learn more about how the primitives of the model affect our results with a focus on preferences, in particular, risk aversion, the intertemporal elasticity of substitution in consumption and the Frisch elasticity of labor supply.
3.1. Calibration
To carry out the simulations, we calibrate the model by assuming a constant population and normalizing its size to one. This normalization ensures that all macroeconomic variables are expressed in per capita terms. We set the individual discount rate,
 $\beta$
, equal to
 $0.95$
, which means that the duration of a period is equal to one year. For our benchmark simulation, we will set the IES,
 $\psi =\rho ^{-1}$
, equal to
 $1.73,$
as estimated by Van Binsbergen et al. (Reference Van Binsbergen, Fernández-Villaverde, Koijen and Rubio-Ramírez2012). This value is in between the one adopted by Bansal and Yaron (Reference Bansal and Yaron2004) and the one used in Croce et al. (Reference Croce, Kung, Nguyen and Schmid2012) and Kung and Schmid (Reference Kung and Schmid2015). As far as it concerns the parameter measuring RA,
 $\gamma$
, we fix it at 20, which is an intermediate value between the standard value in the literature dealing with EZ preferences (e.g. Bansal and Yaron, Reference Bansal and Yaron2004, Croce et al. Reference Croce, Kung, Nguyen and Schmid2012 and Kung and Schmid, Reference Kung and Schmid2015 who set it to 10 and the estimated value found in Van Binsbergen et al. Reference Van Binsbergen, Fernández-Villaverde, Koijen and Rubio-Ramírez2012, which is around 66).Footnote 14 Finally, the Frisch elasticity,
 $\eta$
, is set equal to one, which is an intermediate value in the range of macro and micro data estimates.
Turning to the production side of the economy, we set the capital share,
 $\alpha$
, to
 $0.33,$
while, as in Jones et al. (Reference Jones, Manuelli, Siu and Stacchetti2005), the depreciation rate of physical and human capital are set to
 $0.1$
and
 $0.04$
, respectively. In our benchmark case, we want to achieve a steady-state growth rate for output, say
 $g^{Y}$
, equal to
 $2\%$
, and a labor supply,
 $n$
, equal to
 $0.17$
. Note that
 $g^{Y}$
is close to the annual growth rate of GDP per capita observed in US data for the period 1960-2019, which is 1.97%, according to World Bank data.Footnote 15 To match these desired values we set
 $A$
equal to
 $0.75$
and
 $\chi$
equal to
 $32.32$
. Finally, we assume that the standard deviation of the shock is equal to
 $\sigma =0.011$
and its persistence equal to
 $\varphi =0.9$
. With these values, we can fairly match the annual standard deviation of GDP per capita growth for the US in the period 1960-2019, which is around 1.94%, and its autocorrelation coefficient, which is around 0.14, while in the model, output growth exhibits a standard deviation of 1.938 and an autocorrelation coefficient of 0.122.Footnote 16 The calibration is summarized in Table 1.
Benchmark calibration

3.2. Results
To analyze the effects of higher dispersion of the TFP shocks on growth, we adopt the standard procedure in the literature, that is, we calculate the unconditional mean of output growth,
 $E(g^{Y})$
implied by the model and compare
 $E(g^{Y})$
with its deterministic counterpart.Footnote 17 In our benchmark simulation, we observe that the mean growth rate of the output is
 $1.86\%$
, which is 14 basis points lower than in a deterministic environment, where it is
 $2\%.$
This is a remarkable result since, in traditional expected utility models, a mean-preserving spread in the TFP shocks leads to a higher mean and standard deviation of growth. With CRRA preferences, the intensity of the effect depends on the curvature of the utility function but is always positive for reasonable values of the intertemporal elasticity of substitution (see Jones et al. Reference Jones, Manuelli, Siu and Stacchetti2005). However, we show that this is a direct consequence of the artificial limitation the CRRA assumption imposes on preferences by constraining risk aversion to be the inverse of the elasticity of intertemporal substitution. With EZ preferences, this constraint, which lacks any clear rationale, is removed, and the negative relationship between growth and its volatility suggested by the data can be obtained.
Volatility of shocks, growth, labor, and welfare costs. Note: The figure plots the unconditional means for output growth, its standard deviation (S.D.), the unconditional means for labor, and the welfare cost of volatility for different values of the technological shock volatility
 $\sigma$
. The vertical lines refer to the baseline value set for
 $\sigma$
. At the deterministic steady state,
 $g^Y=2\%$
and
 $n=0.17$
.

In Figure 3, we plot the unconditional mean of output growth, its standard deviation, and mean labor
 $E(n)$
for different values of the standard deviation of the innovation
 $\sigma$
and of the autocorrelation coefficient
 $\varphi$
. We also plot the welfare cost of increases in
 $\sigma$
, which, following Epaulard and Pommeret (Reference Epaulard and Pommeret2003), is defined as an equivalent variation and, specifically, as the percentage of physical capital, say
 $\kappa$
, an agent in a deterministic world is willing to give up at period
 $t=0$
to avoid moving to a stochastic one.Footnote 18 In our benchmark calibration, this cost is around
 $1.7\%$
. This cost represents a substantial welfare loss, consistent with the findings of Epaulard and Pommeret (Reference Epaulard and Pommeret2003) and Barlevy (Reference Barlevy2004). As can be seen from Figure 3, the loss of economic growth and welfare can be significant in the face of economic perturbations of the order of magnitude recently experienced in many countries.Footnote 19
To explain our finding, we isolate five different effects: (i) the mean effect, (ii) the risk aversion effect, (iii) the labor welfare effect, (iv) the substitution effect, and (v) the income effect. The first two effects combine to determine how the certainty equivalent return to saving changes with uncertainty. The third effect captures the welfare cost of the fluctuations through changing labor supply. The last two effects determine the impact of the first three effects on investment (saving) decisions.
The mean effect arises as the expected return to savings increases in the standard deviation of the shocks. To understand why this may be the case, consider that a favorable realization of
 $s_{t}$
makes output increase one-for-one, given the inputs. In addition, if agents adjust their choices depending on the realization, for instance, by working more when it is more productive to do so, output can increase further. Hence, an increase in productivity will raise output more than proportionally: the reduced form (equilibrium) production function and its first derivatives are then convex with respect to the shocks.Footnote 20 Through Jensen’s inequality, the expected return to savings will then increase in the volatility of the shocks.Footnote 21
The risk aversion effect works in the opposite direction. Risk aversion means that the certainty equivalent of a gamble of a given expected value is lower, the higher the variance of the payoffs across states. Or, equivalently, uncertainty has a negative effect on the expected utility of future resources of a given expected value. As long as the risk aversion effect prevails over the mean effect, the certainty equivalent of returns to savings will decrease with the standard deviation of the shocks, reducing both welfare and the relative price between current and future consumption.
The labor welfare effect arises from the changes in the mean and variance of labor that a rise in uncertainty may induce, as the period utility is strictly increasing and strictly concave in leisure.
Finally, the relative force of the substitution and income effects will decide how the change in the certainty equivalent return to savings and the change in welfare through labor influences saving decisions. The substitution effect discourages saving when the certainty equivalent return to saving is lower. A negative income effect works in the opposite direction. When RA is high enough, the certainty equivalent return to saving is negatively affected by uncertainty. When the IES exceeds one, the substitution effect prevails over the negative income effect. This leads to higher initial consumption and lower savings, on average. It also leads to a lower mean labor supply. An intuitive explanation for this latter outcome is that, as shown before, when
 $\rho \lt 1,$
labor disutility increases with consumption. This trumps the negative income effect, pushing the labor supply up.
3.3. Sensitivity
In this section, we conduct some sensitivity analysis to assess the robustness of our findings and to gain deeper insights into the role of various features of the model in shaping results. We will also stress the differences in results with respect to Epaulard and Pommeret (Reference Epaulard and Pommeret2003) and Jones et al. (Reference Jones, Manuelli, Siu and Stacchetti2005), and single out the mechanisms through which these differences emerge.
3.3.1. Risk aversion and intertemporal elasticity of substitution
Our first exercise consists of making the risk aversion
 $\gamma$
take different values (ranging from
 $0.5$
to
 $40$
) for six different values of the elasticity of substitution (from 0.1 to 2). Table 2 reports the unconditional means for output growth,
 $E(g^{Y})$
and labor,
 $E(n)$
, along with the welfare cost of fluctuations,
 $\kappa$
, for each parameterization. When changing the IES, the parameters
 $A$
and
 $\chi$
are adjusted so that the steady-state growth rate remains equal to
 $2\%$
and the labor supply equals
 $0.17$
.Footnote 22
Mean growth and labor, and welfare costs—the role of IES and RA

Note: The table reports the unconditional means for output growth and labor, and the welfare cost of volatility,
 $\kappa$
(in
 $\%$
) for different values of the risk aversion (RA)
 $\gamma$
and of the intertemporal elasticity of substitution (IES)
 $\psi$
. For the triplet of values of
 $\psi$
,
 $\{1.5, 1.73,2\}$
, the corresponding values of
 $\gamma$
, above which mean growth goes below its deterministic counterpart, are
 $\{6.82, 5.68, 5.15\}$
. At the deterministic steady state,
 $g^Y=2\%$
and
 $n=0.17$
.
From the table, we see that the negative effect of an increase in the volatility of the shocks on growth is possible only if the IES is higher than one and if the RA is high enough, while if the IES is lower than one the effect is always positive.
An intuitive explanation for these findings is the following: when RA is low, the certainty equivalent return to savings will increase with the volatility of the shocks, pushing toward more savings and growth through the substitution effect, whose size is increasing in the IES. When RA is high, the certainty equivalent return to savings will decrease with the volatility of the shocks, pushing toward less savings and growth through the substitution effect; however, when the IES is below one, the negative income effect will prevail and push towards lower initial consumption, that is more growth. We also observe that more volatility of the shocks tends to push average labor and average growth in the same direction.
Our finding that an IES higher than one does not rule out the possibility of a positive effect on growth (or even welfare) goes counter to Epaulard and Pommeret (Reference Epaulard and Pommeret2003). In fact, they adopt a streamlined AK model and conclude that as long as the IES is higher than one, mean growth (and welfare) will always be lower than in the deterministic counterpart of the model. Our analysis shows that their conclusion no longer holds when their assumptions are relaxed to allow for endogenous leisure and for human capital as a factor of production. This difference between our results and theirs can be simply explained by recalling that in our model, agents can activate two margins of choice that are assumed out in Epaulard and Pommeret (Reference Epaulard and Pommeret2003): agents can distribute labor supply intertemporally and can invest relatively more in physical or human capital at different times. This activation makes for a positive mean effect. Absent these two margins of choice, more volatility in the shocks will induce a lower certainty equivalent return to savings for all levels of RA, which discourages growth when the IES is higher than one because the negative substitution effect prevails over the negative income effect. In our model, instead, if RA is low, the mean effect can make for an increase in the certainty equivalent return to savings, leading to more savings and higher growth.
Another significant result from Table 2 is that, in most cases, uncertainty decreases welfare, whatever its effect on mean growth. The few exceptions occur when RA is very low. For higher RA, the certainty equivalent return to savings goes down with uncertainty, which directly negatively affects welfare. Moreover, the increased average and/or variance of labor also hurts welfare (the third effect we isolated). The fact that the changes in labor supply have a welfare cost may seem puzzling. If a higher and/or less stable path of labor hurts welfare, why choose it? The answer is that these labor choices are the best response to the underlying stochastic environment: without them, the certainty equivalent returns to saving would be lower. In other words, the welfare cost of fluctuations is not provoked by labor choices, but by the fact that the more volatile economic conditions induce those choices. Agents, given the uncertainty, will always be better off than they would be if their labor were constrained to stay at all times at the level that is optimal in a deterministic world. Still, this does not mean that uncertainty will make them better off.
Note that in Table 2 for
 $\psi =0.5(2)$
and
 $\gamma =2(0.5)$
, risk aversion and intertemporal elasticity of substitution are the inverse of each other so we are back to the standard CRRA specification of preferences. We can see that, as in Jones et al. (Reference Jones, Manuelli, Siu and Stacchetti2005), under this assumption, the economy features mean growth higher than its deterministic value. We complement their analysis by also showing the effects on welfare, and interestingly, we find that the effect is negative despite the positive impact on growth.
All in all, our results confirm the intuition of Jones et al. (Reference Jones, Manuelli, Siu and Stacchetti2005), that the parameters that govern the curvature of the utility function are crucial in determining the sign of the relationship between volatility and growth. However, with EZ preferences, we see that the relationship between volatility and growth depends on both the absolute values of RA and IES and on the ratio between the two values.
3.3.2. Labor-leisure choices
Our previous discussion highlighted the role of labor flexibility behind the mean effect. To clarify this role, we conduct two sets of exercises. First, we compute the unconditional means of output growth and labor when labor supply is fixed, second, we vary the Frisch elasticity of labor supply,
 $\eta$
beyond and above unity, the baseline value
 $.$
In both sets of exercises, we consider different values of risk aversion and the intertemporal elasticity of substitution.
We conduct our first set of exercises with the following question in mind. Does the mean effect only depend on the flexibility of the labor supply? To answer the question, we built Table 3, which presents results with a fixed labor supply, IES set to 1.73 or 0.5, and for the same range of values of RA as in Table 2. Comparing entries in Table 3 with those in the central columns of Table 2, we see that the impact of uncertainty on mean growth and welfare is always less favorable than when the labor supply can adjust. See also Figure A-6 of the online appendix. However, the effects can still be positive for growth and even for welfare (the latter case only arises for RA is 0.5). This implies that the difference in results with Epaulard and Pommeret (Reference Epaulard and Pommeret2003), described in the previous section, depends not only on the assumption in their model that labor is not a factor of production but also on the distinct assumption that there is only one kind of capital. Indeed, we have to qualify this statement. We have already seen that if the depreciation rate is the same for the two capitals, the optimal ratio between the two will be unaffected by uncertainty. However, when the capitals differ in terms of their rates of depreciation, uncertainty creates the possibility of exploiting this difference, for instance, by investing more in the capital which depreciates faster than one would in a deterministic environment, to make one’s choice “less irreversible.”Footnote 23
Mean growth and labor and welfare costs with inelastic labor

Note: The table reports the unconditional means for output growth and the welfare cost volatility,
 $\kappa$
(in
 $\%$
) for different values of the risk aversion
 $\gamma$
and of the intertemporal elasticity of substitution
 $\psi$
. For
 $\psi =1.73$
, the corresponding value of
 $\gamma$
, above which mean growth goes below its deterministic counterpart is 4.11. At the deterministic steady state,
 $g^Y=2\%$
and
 $n=0.17$
.
Mean growth and labor, welfare costs, and the frisch elasticity

Note: The table reports the unconditional means for output growth and labor, and the welfare cost of volatility,
 $\kappa$
(in
 $\%$
) for different values of the risk aversion
 $\gamma$
, of intertemporal elasticity of substitution
 $\psi$
and of the Frisch elasticity of labor supply
 $\eta$
. When
 $\psi =1.73$
for the triplet of values of
 $\eta$
,
 $\{0.5, 1,1.5\}$
, the corresponding values of
 $\gamma$
, above which mean growth goes below its deterministic counterpart, are
 $\{ 5.23, 5.68, 6.05 \}$
. At the deterministic steady state,
 $g^Y=2\%$
and
 $n=0.17$
.
In our second set of exercises, we vary the Frisch elasticity of labor supply,
 $\eta$
, and compute the unconditional means of output growth and labor for different values of risk aversion and two values of the IES. See Table 4. We see that as labor supply becomes more flexible, the impact of the volatility of the shocks on growth, whether positive or negative, is amplified. Interestingly, coeteris paribus, welfare is always increasing in the Frisch elasticity in the sense that the welfare gains of fluctuations are amplified and the welfare costs reduced with higher Frisch elasticity across all the parameterizations we consider.
Finally, the magnitude of the mean effect also depends on the elasticity of output to physical capital,
 $\alpha$
. As shown in Table A-1 of the online appendix, a higher
 $\alpha$
implies a production function that is more concave in labor. Consequently, the mean effect becomes weaker, requiring a lower risk aversion level to generate a negative impact on growth. In general, the higher
 $\alpha$
, the less favorable the effects of more uncertainty on growth and welfare, no matter whether the IES is higher or lower than one.
4. Conclusion
There is convincing evidence that higher frequency and amplitude of fluctuations are related to lower long-term growth. The theoretical literature has only been able to reproduce this evidence by relying on various kinds of institutional or market failures. However, this paper demonstrates that this stylized fact can be easily replicated in a frictionless endogenous growth model where agents have Epstein-Zin preferences.
Our simulations agree with the conclusion in Jones et al. (Reference Jones, Manuelli, Siu and Stacchetti2005) that the relationship between business cycles and long-term growth depends on the concavity of the utility function. However, adopting Von Neumann-Morgenstern preferences means constraining risk aversion and intertemporal elasticity of substitution to be the inverse of each other. As the former parameter is generally assumed to be above unity, this characterization of preferences may bias the results toward finding that business cycles are good for growth. Conversely, we have found that when risk aversion and elasticity of intertemporal substitution are disentangled, short-run fluctuations can be detrimental to growth. An interesting further result is that even when the effect of fluctuations on growth is positive, the impact on welfare will often be negative.
From this perspective, our results uncover a further potential channel for the observed negative relationship between business cycle and growth in addition to the various market failures already explored in the literature. We have adopted a deliberately streamlined model to allow a close analysis of the role of risk aversion and the elasticity of substitution in conditioning this relationship. In future work, we plan to use the results of this scrutiny to further investigate this issue by introducing in the model features such as downward wage rigidities and irreversible investments to improve the empirical properties of the model.
Supplementary material
The supplementary material for this article can be found at https://doi.org/10.1017/S1365100524000336.
Competing interests
The authors declare none.




















