Introduction
Graphene, as a two-dimensional nanoscale sheet with an extended sp 2 carbon network, has attracted much recent attention for both fundamental investigations and potential technological applications.Reference Li and Kaner1–Reference Luo, Liu and Zhi7 The optical properties of graphene and related carbon nanomaterials and nanocomposites have also been widely explored.Reference Nair, Blake, Grigorenko, Novoselov, Booth, Stauber, Peres and Geim8–Reference Wan, Huang and Chen14 Graphene sheets are generally produced either top-down by exfoliation of graphite,Reference Galande, Mohite, Naumov, Gao, Ci, Ajayan, Gao, Srivastava, Weisman and Ajayan12, Reference Novoselov, Geim, Morozov, Jiang, Zhang, Dubonos, Grigorieva and Firsov15–Reference Li, Muller, Gilje, Kaner and Wallace17 including an indirect route through oxidation into exfoliated graphene oxides (GOs) followed by reduction,Reference Galande, Mohite, Naumov, Gao, Ci, Ajayan, Gao, Srivastava, Weisman and Ajayan12, Reference Li, Muller, Gilje, Kaner and Wallace17 or bottom-up by techniques such as vapor deposition.Reference Obraztsov18, Reference Mattevi, Kima and Chhowall19 Pristine graphene is a zero-bandgap material, but to manipulate and control its optical and electronic properties, researchers have devoted much effort to producing nonzero bandgaps.Reference Yan, Xian and Chou20–Reference Nourbakhsh, Cantoro, Vosch, Pourtois, Clemente, van der Veen, Hofkens, Heyns, De Gendt and Sels23 Various approaches for opening energy gaps have been used in graphene materials by creating either defects or isolated nanoscale islands of graphene-like material.Reference Loh, Bao, Eda and Chhowalla9, Reference Eda, Lin, Mattevi, Yamaguchi, Chen, Chen, Chen and Chhowalla22, Reference Luo, Vora, Mele, Johnson and Kikkawa24–Reference Li, Wang, Zhang, Lee and Dai31 These approaches can be separated into two categories, depending on whether this modification is achieved by manipulating the π-electronic network to form sp 2domains in a graphene sample or breaking large graphene sheets into nanoscale pieces.
Linear and nonlinear optical properties of graphene-based materials offer the potential for highly attractive applications in photonics and optoelectrionics.Reference Loh, Bao, Eda and Chhowalla9, Reference Bonaccorso, Sun, Hasan and Ferrari10, Reference Wan, Huang and Chen14, Reference Bao, Zhang, Wang, Ni, Yan, Shen, Loh and Tang32, Reference Bao, Zhang, Yang, Wang, Tong, Jose, Ramakrishna, Lim and Loh33 For example, photoluminescence associated with induced bandgaps in graphene has been pursued as an alternative to fluorescent quantum dots (QDs). In addition, because of its extended π network, graphene exhibits an excellent nonlinear optical reponse.Reference Liu, Wu, Schuck, Salmeron, Shen and Wang34–Reference Liu, Zhao, Zhang, Yan, Wu, Chen and Tian36 Among the various nonlinear optical properties of graphene materials, one of the most widely pursued has been optical limiting, which is important in a number of technologies, from passive manipulation of optical beamsReference Lim, Chen, Clark, Goh, Ng, Tan, Friend, Ho and Chua35, Reference Sun and Riggs37–Reference Wang, Hernandez, Lotya, Coleman and Blau39 to protection against intense laser pulses.Reference Bass, Li and Van Stryland38 In this article, the optical absorption characteristics and photoluminescence properties due to various induced energy gaps and, in some cases, the creation of graphene quantum dots (GQDs) in graphene-based materials are highlighted. Nonlinear optical properties of these materials are reviewed with an emphasis on optical limiting through both nonlinear absorption and scattering mechanisms.
Absorption
Graphene sheets with sp 2-hybridized carbon atoms and associated π networks exhibit optical absorption over a broad spectral range from the ultraviolet to the near-infrared, although their insolubility has made solution-phase studies of optical absorption difficult.Reference Li, Muller, Gilje, Kaner and Wallace17, Reference Eda, Lin, Mattevi, Yamaguchi, Chen, Chen, Chen and Chhowalla22, Reference Pan, Guo, Zhang, Xi, Xue, Huang, Li, Zhang, Yu, Chen, Li and Wu28, Reference Niyogi, Bekyarova, Itkis, McWilliams, Hamon and Haddon40–Reference Robinson, Tabakman, Liang, Wang, Casalongue, Vinh and Dai42 As with other carbon nanomaterials, including carbon nanotubes and even carbon nanoparticles,Reference Itkis, Perea, Jung, Niyogi and Haddon43–Reference Xu, Sahu, Cao, Anilkumar, Tackett, Qian, Bunker, Guliants, . Parenzan and Sun47 π-plasmon absorption plays a major role in photon harvesting by graphene-based materials.Reference Loh, Bao, Eda and Chhowalla9, Reference Ohta, Bostwick, Seyller, Horn and Rotenberg48, Reference Eberlein, Bangert, Nair, Jones, Gass, Bleloch, Novoselov, Geim and Briddon49
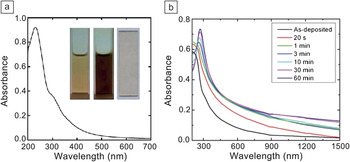
Graphene oxides (GOs) are graphene “derivatives” in which a substantial fraction of the sp 2-hybridized carbons are converted to sp 3 hybridization (up to 60% according to Ruoff and coworkers)Reference Cai, Piner, Stadermann, Park, Shaibat, Ishii, Yang, Velamakanni, An, Stoller, An, Chen and Ruoff50 upon typically harsh oxidative treatment such as the Hummers method.Reference Hummers and Offeman51 Aqueous suspensions of GOs (solution-like, Figure 1a) are readily prepared to allow quantitative optical absorption measurements.Reference Li, Muller, Gilje, Kaner and Wallace17, Reference Niyogi, Bekyarova, Itkis, McWilliams, Hamon and Haddon40, Reference Kong, Song, Meziani, Tackett, Cao, Farr, Anderson and Sun52 The solubilized GOs (with primarily single-layer sheets) also serve as excellent precursors in various conversion schemes for the preparation of graphene sheets containing different ratios (purposely or by default) of sp 2 and sp 3 carbons.Reference Eda, Lin, Mattevi, Yamaguchi, Chen, Chen, Chen and Chhowalla22, Reference Mkhoyan, Contryman, Silcox, Stewart, Eda, Mattevi, Miller and Chhowalla53 As a typical example, gradual changes in optical absorption can be used to monitor the transformation of a GO film at various stages of reduction (by hydrazine, in the case of Figure 1b).Reference Eda, Lin, Mattevi, Yamaguchi, Chen, Chen, Chen and Chhowalla22 The same strategy was applied to follow the conversion of GOs in a thermal treatment in supercritical fluids at relatively low temperatures.Reference Kong, Song, Meziani, Tackett, Cao, Farr, Anderson and Sun52
(a) Absorption spectrum of graphene oxides (GOs) in aqueous dispersion. Inset: Photographs of dispersions with low (0.05 mg/ml, left) and high (0.75 mg/ml, middle) GO concentrations and of a GO film on a quartz slide (right). Reproduced with permission from Reference Reference Kong, Song, Meziani, Tackett, Cao, Farr, Anderson and Sun52. ©2011, Elsevier. (b) Absorption spectra of GO thin films progressively reduced by exposure to hydrazine for total times noted in the legend. Reproduced with permission from Reference Reference Eda, Lin, Mattevi, Yamaguchi, Chen, Chen, Chen and Chhowalla22. ©2010, Wiley-VCH.

Many other methods of altering the ratios between sp 2 and sp 3 carbons have been explored, including the formation of isolated sp 2 islands in graphene sheets and/or the manipulation of defects (associated with sp 3 carbons), for the creation and tuning of electronic energy gaps. These nanoscale (often quantum-confined) domains in graphene materials, also referred to as graphene quantum dots (GQDs),Reference Loh, Bao, Eda and Chhowalla9, Reference Eda, Lin, Mattevi, Yamaguchi, Chen, Chen, Chen and Chhowalla22, Reference Pan, Guo, Zhang, Xi, Xue, Huang, Li, Zhang, Yu, Chen, Li and Wu28, Reference Pan, Zhang, Li and Wu29, Reference Peng, Gao, Gupta, Liu, Romero-Aburto, Ge, Song, Alemany, Zhan, Gao, Vithayathil, Kaipparettu, Marti, Hayashi, Zhu and Ajayan54 offer distinctive optical absorption and photoluminescence characteristics, as discussed in more detail in the next section. They also generally serve as the basis for nonlinear optical properties in graphene materials. For nonlinear absorption, as an example, GOs in N,N-dimethylformamide were investigated using 532-nm nanosecond and picosecond pulses in a Z-scan setup, where the nonlinear response is monitored as the sample is moved through the focus of a laser beam.Reference Liu, Wang, Zhang, Xu, Chen and Tian55 The results suggested significant two-photon absorption, especially with picosecond laser pulses. Other studies on nonlinear optical properties in graphene materials are highlighted and discussed later in this article.
Emission
Photoluminescence emission from graphene sheets has been reported and classified into several mechanism-based categories.Reference Gupta, Chaudhary, Srivastava, Sharma, Bhardwaj and Chand13, Reference Eda, Lin, Mattevi, Yamaguchi, Chen, Chen, Chen and Chhowalla22, Reference Luo, Vora, Mele, Johnson and Kikkawa24, Reference Pan, Zhang, Li and Wu29, Reference Lu, Yang, Wang, Lim, Wang and Loh30, Reference Liu, Wu, Schuck, Salmeron, Shen and Wang34, Reference Radovic and Bockrath56–Reference Li, Bao, Hou, Sun, Wang and Gu59 Among the more classical are those associated with bandgap transitions, where the bandgaps are mostly created by various theoretically established approaches. In fact, opening bandgaps has been a popular way to impart photoluminescence emission to graphene-based materials, for which several strategies have been developed.Reference Loh, Bao, Eda and Chhowalla9, Reference Bonaccorso, Sun, Hasan and Ferrari10, Reference Eda, Lin, Mattevi, Yamaguchi, Chen, Chen, Chen and Chhowalla22–Reference Li, Wang, Zhang, Lee and Dai31, Reference Peng, Gao, Gupta, Liu, Romero-Aburto, Ge, Song, Alemany, Zhan, Gao, Vithayathil, Kaipparettu, Marti, Hayashi, Zhu and Ajayan54, Reference Lu, Yeo, Gan, Wu and Loh60–Reference Jeon, Lee, Pollak, Moreschini, Bostwick, Park, Mendelsberg, Radmilovic, Kostecki, Richardson and Rotenberg63 One of the two primary approaches to opening bandgaps is to physically or chemically treat graphene sheets to reduce the connectivity in the π-electronic network,Reference Luo, Vora, Mele, Johnson and Kikkawa24–Reference Shukla and Saxena26 including the formation of electron-confined sp 2 islands in GOs.Reference Loh, Bao, Eda and Chhowalla9, Reference Eda, Lin, Mattevi, Yamaguchi, Chen, Chen, Chen and Chhowalla22, Reference Vogt, Gibson, Tune, Bissett, Voelcker, Shapter and Ellis27 The other approach is to break graphene sheets into nanoribbons or even small dots.Reference Pan, Guo, Zhang, Xi, Xue, Huang, Li, Zhang, Yu, Chen, Li and Wu28–Reference Li, Wang, Zhang, Lee and Dai31 Because of the expected confinement of electrons in these purposely created nanoscale domains, they are often called GQDs, as discussed above.
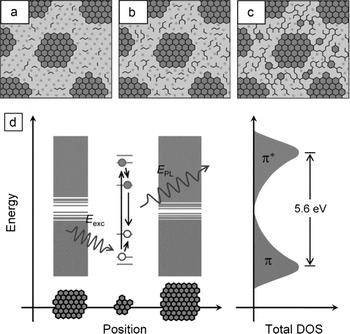
A typical example of the first approach is photoluminescence in GOs and reduced GOs (RGOs).Reference Eda, Lin, Mattevi, Yamaguchi, Chen, Chen, Chen and Chhowalla22 Specifically, GOs prepared using the Hummers oxidation method were reduced by exposure to hydrazine into RGOs, in which the graphene π network was disconnected, equivalent to the formation of isolated sp 2 domains (about 3 nm in size edge-to-edge) in the carbon–oxygen sp 3 matrix (Figure 2a–c). These quantum-sized sp 2 islands could localize electron–hole pairs and create energy bandgaps, resulting in fluorescence emission through radiative recombination of excitons (Figure 2d). The fluorescence intensities were found to depend on the degree of the reduction treatment in the conversion to RGOs, with significant quenching after extensive treatment. This quenching probably reflects the facilitation of nonradiative excited-state processes by some percolation among the sp 2domains.
(a–c) Structural models of GO at different stages of reduction. The larger sp 2 clusters of aromatic rings are not drawn to scale. The smaller sp 2 domains indicated by zigzag lines correspond not to any specific structure (such as olefinic chains) but rather to small and localized sp 2 configurations that act as luminescence centers. The photoluminescence intensity is relatively weak for (a) as-synthesized GO but increases with reduction due to (b) formation of additional small sp 2 domains between the larger clusters because of evolution of oxygen with reduction. After extensive reduction, the smaller sp 2 domains create (c) percolating pathways among the larger clusters. (d) Representative band structure of GO. Within each small fragment, confinement causes the energy levels to be quantized within the overall density of states (DOS) with a large energy gap that depends on the fragment geometry. A photogenerated electron–hole pair recombining radiatively is depicted. E exc, excitation energy; E PL, photoluminescence energy. Reproduced with permission from Reference Reference Eda, Lin, Mattevi, Yamaguchi, Chen, Chen, Chen and Chhowalla22. ©2010, Wiley-VCH.

For a typical example of the second approach, micron-sized graphene sheets were prepared by thermal reduction of GOs, followed by oxidization treatment in concentrated H2SO4 and HNO3 and then hydrothermal processing to yield GQDs of one to three layers and an average lateral size of 9.6 nm.Reference Pan, Zhang, Li and Wu29 Such small dots are known to have strong edge effects due to free zigzag sites commonly with a carbene-like triplet ground state.Reference Radovic and Bockrath56 The observed photoluminescence in these GQDs was attributed to bandgap transitions associated with the free zigzag sites in the dots.Reference Gupta, Chaudhary, Srivastava, Sharma, Bhardwaj and Chand13, Reference Pan, Zhang, Li and Wu29 Such a mechanism was supported experimentally by the pH dependence of the photoluminescence emission. The emission intensities were enhanced under alkaline conditions but almost completely quenched under acidic conditions as a result of the protonation of the free zigzag sites.
Photoluminescence due to induced bandgaps can also be excited by nonlinear optical processes.Reference Shen, Zhu, Chen, Yang and Li64–Reference Zhuo, Shao and Lee67 The multiphoton photoluminescence of GO nanoparticles (average sizes around 40 nm) was investigated using laser pulses at 810 nm (∼160 fs) and 1215 nm (∼160 fs) for two- and three-photon excitation, respectively.Reference Qian, Wang, Peng, Xi, Cai, Zhu, He, Hu and He66 The photoluminescence spectra were similar to those observed for linear excitation, suggesting that multiphoton excitation also caused electron–hole recombination with energies reflecting quantum confinement in graphitic islands in the GOs.
Shen et al. reduced GOs with hydrazine hydrate and then surface-passivated the reduced GOs with diamine-terminated oligomeric poly(ethylene glycol) to yield GQDs with sizes of 5–19 nm.Reference Shen, Zhu, Chen, Yang and Li64 They attributed the up-conversion fluorescence in these GQDs to the anti-Stokes process, such that the π electrons are photoexcited to a higher-energy state (lowest unoccupied molecular orbital) and then transition back to a lower-energy state (σ orbital).Reference Shen, Zhu, Chen, Yang and Li64 Nanocomposites of GQDs with TiO2 were investigated for their photocatalytic activities based on up-conversion and down-conversion fluorescence emission.Reference Zhuo, Shao and Lee67 It was proposed that the fluorescence was associated with bandgaps in tiny nanoribbons from the protruding edges in the GQDs.
Photoluminescence observed in GQDs with average lateral diameters of 3–5 nm and an average height of 0.95 nm (thus mostly single- or double-layer species), including that from up-conversion by multiphoton excitation, was attributed to surface energy traps and zigzag sites in the dots.Reference Zhu, Zhang, Liu, Li, Wang, Tang, Meng, Li, Shi, Hu and Yang65
Other photoluminescence mechanisms in graphene-based materials that are associated with nonlinear optical processes include plasmon emission,Reference Stohr, Kolesov, Pflaum and Wrachtrup57 nonequilibrium electron-energy distributions,Reference Liu, Wu, Schuck, Salmeron, Shen and Wang34, Reference Lui, Mak, Shan and Heinz68 and hot-carrier recombination.Reference Li, Bao, Hou, Sun, Wang and Gu59 It has been suggested that the nonlinear up- and down-converted luminescence emission in graphene and thin graphite species in response to picosecond infrared laser pulses can be attributed to laser-created electron–hole plasmas in these nanomaterials.Reference Stohr, Kolesov, Pflaum and Wrachtrup57 The nonlinear nature of the observed optical properties was confirmed by the quadratic power dependence of the luminescence emission before saturation at higher laser powers.
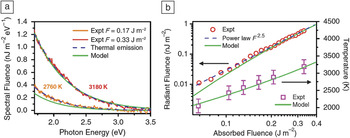
As an example of the nonequilibrium electron distribution mechanism, observation of unusually strong broadband nonlinear photoluminescence in graphene upon femtosecond pulsed laser irradiation has been reported.Reference Liu, Wu, Schuck, Salmeron, Shen and Wang34 The broad distribution of nonequilibrated electrons and holes, whose radiative recombination was responsible for the photoluminescence emission, was attributed to rapid (within tens of femtoseconds after optical excitation) scattering between photoexcited carriers.Reference Liu, Wu, Schuck, Salmeron, Shen and Wang34 The photoluminescence following excitation of single-layer graphene (exfoliated from graphite) by ultrafast laser pulses (30 fs) was found to exhibit a nonlinear dependence on laser excitation power with an exponent of 2.5 (Figure 3).Reference Lui, Mak, Shan and Heinz68 The nonlinear process was rationalized mechanistically in terms of the electron distribution being driven strongly out of equilibrium by the ultrafast laser excitation.Reference Lui, Mak, Shan and Heinz68
(a) Spectra of light emission from graphene upon excitation with 30-fs pulses of absorbed fluences of F = 0.17 J/m2 and 0.33 J/m2. The spectra are compatible with the predictions for thermal emission (dashed blue lines) for T em = 2760 K and 3180 K, respectively. (b) Light emission as a function of absorbed fluence F. The red circles display experimental values for the total radiant fluence for photons from 1.7 eV to 3.5 eV. The emission can be described phenomenologically by F 2.5 (dashed blue line). The magenta squares correspond to the emission temperatures deduced from the experimental spectra, T em. The solid green lines represent a full calculation using a two-temperature model.Reference Lui, Mak, Shan and Heinz68 The predicted emission fluence was multiplied by a factor of ∼0.2 to match the scale of the experimental data. Reproduced with permission from Reference Reference Lui, Mak, Shan and Heinz68. ©2010, American Physical Society.

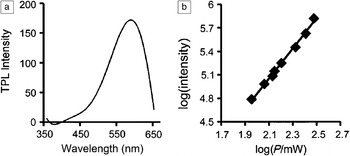
Hot carriers in graphene-based materials can be generated under intense pulsed laser irradiation, with their recombination resulting in luminescence emission. For example, two-photon luminescence emission (peaking at ∼590 nm) from GO nanoparticles (around 30 nm) with ultrafast laser excitation has been observed.Reference Li, Bao, Hou, Sun, Wang and Gu59 The emission intensity was found to vary with the incident laser power on a logarithmic scale, and the slope from curve fitting was around 2, as expected (Figure 4).
Characterization of graphene oxide nanoparticles (GONs). (a) Two-photon luminescence (TPL) spectrum of GONs (cut off at 660 nm by cascading filters), (b) base-10 logarithmic plot of TPL intensity as a function of laser power (P), giving a slope of approximately 2. Reproduced with permission from Reference Reference Li, Bao, Hou, Sun, Wang and Gu59. ©2012, Wiley-VCH.

Optical limiting
Optical-limiting materials, or optical limiters, exhibit linear transmittance at low incident light fluences but become opaque at high incident light fluences.Reference Sun and Riggs37, Reference Tutt and Boggess69–Reference Wang and Blau71 Widely pursued limiting mechanisms have included nonlinear absorption (multiphoton, reverse-saturable, or free-carrier absorption) and nonlinear scattering.Reference Sun and Riggs37, Reference Tutt and Boggess69–Reference Riggs, Walker, Carroll and Sun72 Various carbon nanomaterials have been developed as optical limiters using both mechanisms, with examples of fullerenes for nonlinear absorption and carbon black suspensions for nonlinear scattering.Reference Sun and Riggs37, Reference Sun, Riggs and Liu73–Reference Vincent, Petit and Chin78 The recent exploration of graphene-based materials for optical limiting can also be categorized in terms of these mechanisms.Reference Lim, Chen, Clark, Goh, Ng, Tan, Friend, Ho and Chua35, Reference Wang, Hernandez, Lotya, Coleman and Blau39, Reference Wang and Blau71, Reference Zhao, Cao, Zhou, Li and Zhao79–Reference Zhang, Zhao, Liu, Shi, Zhou, Tian, Xu and Chen86
Excellent broadband (450–1064 nm) optical-limiting properties were found for graphene sheets prepared from substoichiometric GOs (sub-GOs, obtained by partially oxidizing graphite using a modified Staudenmaier method).Reference Lim, Chen, Clark, Goh, Ng, Tan, Friend, Ho and Chua35 When dispersed in heavy-atom solvents such as chlorobenzene or film matrixes, these graphene sheets exhibited optical-limiting thresholds down to 10 mJ/cm2 at 70% linear transmittance for nanosecond laser pulses. These thresholds are well below the pulse fluences required for microbubble or microplasma formation. Unlike fully oxidized stoichiometric GOs, sub-GOs contain a significant fraction of sp 2 carbon atoms known to be responsible for bandgap opening and related optical properties and, thus, for the observed nonlinear absorption.Reference Lim, Chen, Clark, Goh, Ng, Tan, Friend, Ho and Chua35 Mechanistically, this optical limiting was apparently related to the environment surrounding the graphene sheets rather than being an intrinsic property of the absorbing domains in the sheets, according to a comparison between two film matrixes, namely, poly(methyl methacrylate) and polycarbonate. The formation of localized and highly absorbing triplet-like states due to solvent/matrix effects in sub-GOs was proposed.Reference Lim, Chen, Clark, Goh, Ng, Tan, Friend, Ho and Chua35
Graphene dispersions in organic solvents that were populated by single- and few-layer sheets were prepared for studies of their optical-limiting properties.Reference Wang, Hernandez, Lotya, Coleman and Blau39 Using open-aperture Z-scan measurements, which show the transmittance decrease arising from nonlinear loss when the focus of a probe laser is moved through a sample, broadband optical-limiting responses to nanosecond laser pulses at 532 nm and 1064 nm were observed. The limiting mechanism was primarily nonlinear scattering associated with the formation of solvent bubbles and microplasma in the graphene dispersions, so the performance was affected by the solvent surface tension, with lower surface tension corresponding to higher scattering intensity and a lower limiting threshold. The solvent surface tension effect was similar to that reported previously for the optical-limiting performance of dispersed carbon nanotubes.Reference Wang and Blau71 Another study also suggested that the solvent polarity could affect the optical-limiting performance of graphene materials, by modifying their bonds to solvent molecules.Reference Zhao, Cao, Zhou, Li and Zhao79
Optical-limiting properties of various graphene nanostructures, including GO nanosheets (GONSs) and nanoribbons (GONRs) and graphene nanosheets (GNSs) and nanoribbons (GNRs), were investigated using an open-aperture Z-scan system with nanosecond laser pulses at 532 nm and 1064 nm.Reference Feng, Zhan and Chen80 The optical-limiting performances of the GNSs, GONRs, and GNRs were exceptional, and chemical reduction of these nanostructures to enhance the integrated crystalline structure and electronic conjugation was found to improve their performances even further. The results were explained in terms of both two-photon absorption and nonlinear scattering in the graphene nanostructures.Reference Feng, Zhan and Chen80
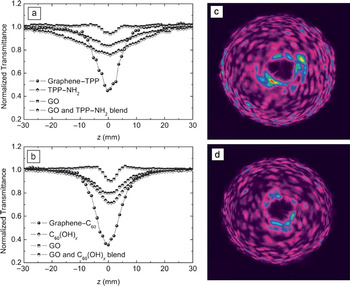
Graphene-based nanocomposites have also been explored for optical-limiting applications.Reference Feng, Zhan and Chen80–Reference Zhang, Zhao, Liu, Shi, Zhou, Tian, Xu and Chen86 For example, graphene–porphyrin composite materials were examined for their limiting responses toward nanosecond laser pulses at 532 nm, in comparison with those of porphyrin and of graphene.Reference Krishna, Kumar, Venkatramaiah, Venkatesan and Rao81, Reference Krishna, Venkatramaiah, Venkatesan and Rao82 The improved performance in the nanocomposites was rationalized in terms of enhanced excited-state absorption and multiphoton absorption, as well as nonlinear scattering.Reference Krishna, Kumar, Venkatramaiah, Venkatesan and Rao81, Reference Krishna, Venkatramaiah, Venkatesan and Rao82 In a pair of similar studies,Reference Xu, Liu, Zhang, Wang, Tian, Huang, Ma, Zhang and Chen83, Reference Liu, Xu, Zhang, Zhang, Chen and Tian84 optical-limiting properties of graphene–porphyrin and graphene–fullerene nanohybrids were probed using the open-aperture Z-scan technique. The results showed that both nanohybrids performed better than porphyrin, fullerene, or GOs alone, with the graphene–fullerene nanohybrid exhibiting the best performance (Figure 5).Reference Liu, Xu, Zhang, Zhang, Chen and Tian84 The proposed optical-limiting mechanism in the nanohybrids was a combination of photoinduced electron and/or energy transfer, reverse saturable absorption, two-photon absorption, and strong nonlinear scattering (the fast growth of hot carbon vapor bubbles due to incandescence and sublimation of graphitic particles) (Figure 5).Reference Liu, Xu, Zhang, Zhang, Chen and Tian84
(a–b) Open-aperture Z-scan curves showing the transmittance decrease arising from nonlinear loss as the focus of a probe laser (532 nm, 5-ns pulses) is moved through the sample for (a) graphene–poly[2-(3-thienyl)ethoxy-4-butylsulfonate] (TPP), TPP–NH2, graphene oxide (GO), and a controlled blend sample of TPP–NH2 with graphene oxide (1:1 w/w) and (b) graphene–C60, pyrrolidine fullerene, graphene oxide, and a controlled blend sample of pyrrolidine fullerene with graphene oxide (1:1 w/w). (c–d) Images of strong nonlinear scattering of light when samples of (c) graphene–C60 and (d) graphene–TPP were fixed on the focus (z = 0 mm). Reproduced with permission from Reference Reference Liu, Xu, Zhang, Zhang, Chen and Tian84. ©2009, American Chemical Society.

In another study, GNSs were decorated with CdS quantum dots, and the resulting nanocomposites were investigated for their optical-limiting properties.Reference Feng, Sun, Zhan and Chen85 Limiting thresholds of ∼0.88 J/cm2 at 532 nm and >6.4 J/cm2 at 1064 nm were obtained. Similarly, it has been reported that, in GO–Fe3O4 nanocomposites, the two-photon coefficients and nonlinear refraction coefficients were enhanced by about a factor of three in comparison with those in pristine GOs.Reference Zhang, Zhao, Liu, Shi, Zhou, Tian, Xu and Chen86 The observed optical-limiting threshold of 3.7 J/cm2 at 87% linear transmittance was also better than those of pristine GOs and C60at high input fluence, which was attributed to strong nonlinear scattering in combination with negative nonlinear refraction and two-photon absorption.
Other nonlinear optical properties
Beyond their use for optical limiting, nonlinear optical absorption and scattering in graphene-based materials have also been investigated with respect to other nonlinear optical phenomena, including nonlinear refraction, spatial self-phase modulation, four-wave mixing, and second-harmonic generation.Reference Liu, Zhao, Zhang, Yan, Wu, Chen and Tian36, Reference Nalla, Polavarapu, Manga, Goh, Loh, Xu and Ji87–Reference Glazov92 For example, GOs synthesized from graphite with a controlled degree and location of oxidation were found to have spatially heterogeneous nonlinear optical responses.Reference Liu, Zhao, Zhang, Yan, Wu, Chen and Tian36 In Z-scan measurements, the increased pump power resulted in enhanced two-photon absorption of the sp 3 domains in the GOs. It was suggested that the nonlinear optical properties could be altered by changing the relative sp 2 and sp 3 fractions in the GO sheets.Reference Liu, Zhao, Zhang, Yan, Wu, Chen and Tian36 Composites of GOs with the sodium salt of poly[2-(3-thienyl)ethoxy-4-butylsulfonate] (TPP) were also studied for their nonlinear optical response to femtosecond laser pulses at 800 nm in Z-scan measurements.Reference Nalla, Polavarapu, Manga, Goh, Loh, Xu and Ji87 The results suggested enhanced nonlinear absorption (20 cm3/GW2) and nonlinear refraction coefficients (0.05 cm2/GW) in the GO–TPP composite films. Negative nonlinear refraction due to the self-defocusing effect was also observed. These nonlinear optical enhancements in the GO–TPP films were attributed to multiphoton absorption, excited-state absorption, and charge transfer.Reference Nalla, Polavarapu, Manga, Goh, Loh, Xu and Ji87
Spatial self-phase modulation (SSPM) was observed in a dispersion of exfoliated graphene sheets in organic solvents using various laser sources (ultraviolet, visible, and near-infrared).Reference Wu, Zhang, Yan, Bian, Wang, Bai, Lu, Zhao and Wang88 The apparently coherent light-scattering phenomenon was attributed to the large broadband and ultrafast third-order nonlinearity (χ(3)) originating from the Dirac-cone band structure in graphene sheets.
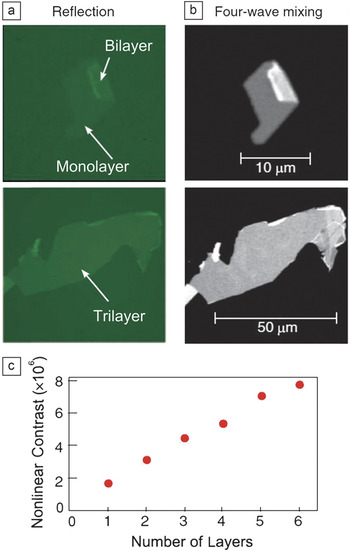
Four-wave mixing measurements were performed to study the coherent nonlinear response of single- and few-layer graphene flakes.Reference Hendry, Hale, Moger, Savchenko and Mikhailov89 An exceptionally large third-order optical susceptibility (|χ(3)| ≈ 10–7 esu) was observed in the near-infrared region, which might be due to interband electron transitions in the graphene sheets, as in SSPM. In a comparison of optical microscopy images of graphene flakes by reflection and four-wave mixing, the nonlinear optical contrast increased with the number of layers (up to six, Figure 6), which was explained in terms of constructive interference of the radiated fields from different graphene layers. Dark nonlinear images were also obtained for graphene flakes with many more layers (≫20), which can be ascribed to the reflection of the incident light and the reabsorption of the nonlinear signals in the thick graphene flakes.
(a) Standard green-light (550-nm) reflection images of two graphene flakes. (b) Nonlinear optical images of the same flakes measured with pump wavelengths of 969 nm and 1179 nm. (c) Measured contrast in four-wave mixing images as a function of the number of graphene layers. Reproduced with permission from Reference Reference Hendry, Hale, Moger, Savchenko and Mikhailov89. ©2010, American Physical Society.

Finally, graphene-based materials have also been explored both theoretically and experimentally for second-harmonic generation (SHG).Reference Dean and van Driel90–Reference Glazov92 For example, SHG signals (400-nm light) were observed from exfoliated graphene and multilayer graphite films on an oxidized silicon surface when an incident pump pulse laser (800 nm, 150 fs) was applied.Reference Dean and van Driel90
Conclusions
In summary, optical properties of graphene sheets and related nanomaterials are mostly associated with induced energy bandgaps. Therefore, relevant research efforts have been centered on the creation and, in some cases, the manipulation of the bandgaps. Mechanistically, however, further understanding is necessary to clarify the roles of and relationships between isolated (or quantum-confined) π-electronic islands and defects in graphene sheets and derivatives for the observed linear and nonlinear optical responses, as well as the similarities and any fundamental differences in optical properties among graphene materials, carbon nanotubes, and carbon dots. The investigation of the linear and nonlinear optical properties of these graphene-based carbon nanomaterials will facilitate the study of their potential applications in photonics and optoelectronics.
Acknowledgments
Financial support from the Air Force Office of Scientific Research (AFOSR) through the program of Dr. Charles Lee is gratefully acknowledged. L.C. was supported by a Susan G. Komen for the Cure Postdoctoral Fellowship, and C.Y.K. was a visiting scholar from the Department of Materials Science and Chemical Engineering at Shizuoka University in Japan, with a fellowship provided by the Excellent Young Researchers Overseas Visit Program of the Japan Society for the Promotion of Science (JSPS).