Introduction
With the rapid development of the global economy, drastic climate change, depleting fossil fuels, and increasing environmental pollution, there is a crucial need to explore efficient, clean, and sustainable nanomaterials for energy conversion and storage. Many transition metal oxides (MOs) and mixed transition MOs, such as TiO2, Cu2O, CuO, Fe2O3, NiO, RuO2, Co3O4, FeCo2O4, MnCo2O4, and ZnCo2O4, have been studied for their application in energy conversion and storage [Reference Tajik, Dubal, Gomez-Romero, Yadegari, Rashidi, Nasernejad and Asiri1, Reference Endut, Hamdi and Basirun2, Reference Dubal, Gund, Holze, Jadhav, Lokhande and Park3, Reference Wang, Zhang and Zhang4]. Among them, copper oxide–based nanomaterials have gained distinct interest as a promising electrode material beside various other applications, such as gas sensors, biosensors, enzyme-free glucose sensors, photodetectors, nanofluids for heat transfer applications, catalyst for water gas shift reactions, photocathodes for photoelectrochemical water splitting applications, and solar cells because of its peculiar properties [Reference Vidyadharan, Misnon, Ismail, Yusoff and Jose5, Reference Mallick and Sahu6, Reference Zhu, Wang and Xu7, Reference Zhou, Nie, Yao, Dong, Yang and Huang8, Reference Zhang, Liu, Peng, Wang and Li9, Reference Zhang, Wang, Zhang, Wei and Fang10]. Performance of the MOs primarily depends on the in-depth understanding of size, structure, composition, oxygen partial pressure, and morphology-controlled properties. Compared with the single-phase material, the hierarchical nanostructure (HNS) and nano-heterojunctions can provide thermodynamically favorable charge transport from multiple active components, leading to an enhanced performance, including charge storage [Reference Zhao, Jin, Xiang, Jin, Ding, Wu, Jia and Sun11, Reference Zhao, Huang, Wang, Xiang, Sun, Wu, Tang, Sun, Zang and Sun12, Reference Sun, Huang, Hossain, Li, Adams and Wang13, Reference Kuang, Li, Chen, Zhang, Zhang and Zhang14, Reference Xiang, Zhao, Tan, Ye, Wu, Zhang and Sun15]. Thus, development of a reliable and cost-effective method for a large-scale Cu2O and CuO production, which may also provide Cu(I)–Cu(II) transitions or require broad absorption band, is therefore highly desirable [Reference Ulyankina, Leontyev, Maslova, Allix, Rakhmatullin, Nevzorova, Valeev, Yalovega and Smirnova16]. Numerous methods, such as wet chemical method, anodization, thermal transformation, electrospinning, solvothermal process, chemical bath deposition, and electrodeposition, have been adopted for the development of different nanostructured copper oxides [Reference Endut, Hamdi and Basirun2, Reference Dubal, Gund, Holze, Jadhav, Lokhande and Park3, Reference Vidyadharan, Misnon, Ismail, Yusoff and Jose5, Reference Harilal, Vidyadharan, Misnon, Anilkumar, Lowe, Ismail, Yusoff and Jose17, Reference Shinde, Dubal, Ghodake and Fulari18, Reference Navathe, Patil, Jadhav, Awale, Teli, Bhise, Kolekar, Karanjkar, Kim and Patil19, Reference Vidhyadharan, Misnon, Aziz, Padmasree, Yusoff and Jose20, Reference Dubal, Gund, Lokhande and Holze21, Reference Hsu, Chen and Lin22]. However, these methods require a template, surfactant, or high temperature steps [Reference Ulyankina, Leontyev, Maslova, Allix, Rakhmatullin, Nevzorova, Valeev, Yalovega and Smirnova16]. Electrodeposition is one of the few inexpensive techniques that is used to obtain uniform coatings/film by varying the deposition parameters, such as bath conditions and applied potential or current. Several electrolytes have been successfully applied for the electrodeposition of Cu2O, such as cupric sulfate (with lactic acid and ethylene glycol), cupric sulfate solution, cupric nitrate solution, and sodium acetate (with cupric acetate) [Reference Wijesundera23]. Similarly, CuO nanostructures of different morphologies, like nanowires, nanoshuttles, nanobelt/ribbons, nanosheet, scrolls, nanowhiskers, and nanoflowers, have been obtained by solution-based processes utilizing different reactants. Among the various methods, solution-based method has gained significant interest, as it is a simple process ensuring low cost, high yields, and promising growth approach with considerable chemical flexibility [Reference Endut, Hamdi and Basirun2, Reference Vidyadharan, Misnon, Ismail, Yusoff and Jose5, Reference Hsu, Chen and Lin22, Reference Zhang, Feng, Qin, Zhang, Cui, Chai and Zheng24, Reference Li, Yamahara, Lee, Tabata and Delaunay25, Reference Fan and Li26].
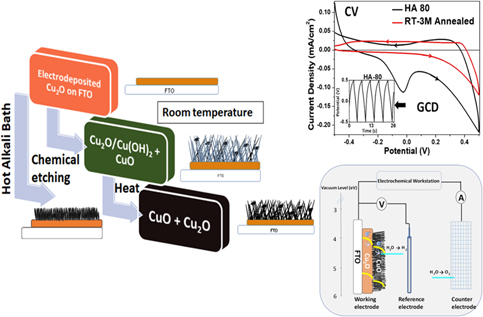
In the present work, we report low temperature–controlled synthesis of randomly oriented tussock-like nanostructures, such as nanowhiskers, nanorods, and interconnected nanoflakes of cupric oxide (CuO). The high surface area mixed valent copper oxide—hydroxide nanostructures were obtained by simple and cost-effective two-step wet-chemical process over electrodeposited Cu2O. Variation in process parameters, like pH, concentration, and temperature, of the chemical bath and its effect on the nucleation and growth, resulting in the formation of the different nanostructures, is investigated. The obtained CuO:Cu(OH)2/Cu2O—HNS with large active surface area is demonstrated with efficient pseudocapacitive charge storage and photoelectrochemical properties.
Results and discussion
Electrodeposition of cuprous oxide
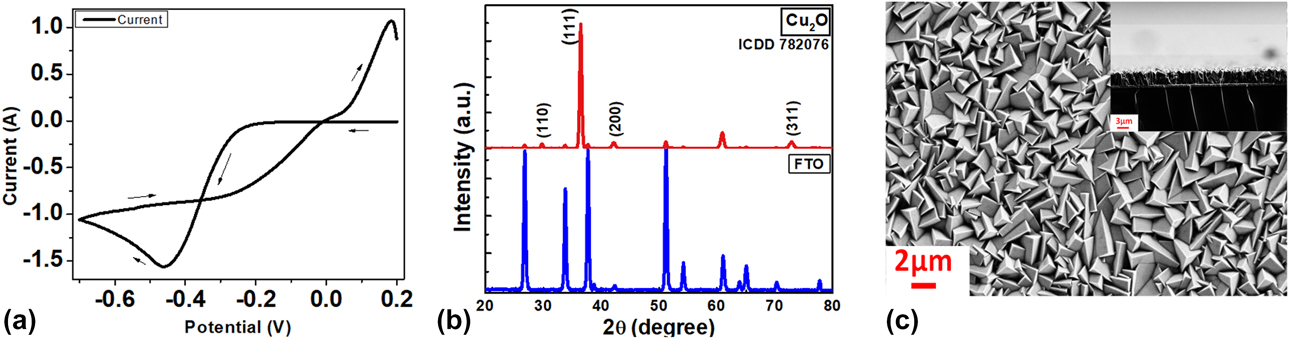
Electrodeposition was preferred over other techniques for the development of cuprous oxide film, as it is a scalable, simple, and reliable method, providing good homogeneity over large areas [Reference Govindaraju, Wheeler, Lee and Choi27]. For the synthesis of cuprite film, lactate stabilized copper sulfate precursor buffered to pH 11 by 4 M NaOH was used. Deposition potential was determined by recording the cyclic voltammogram over cleaned fluoring doped tin oxide (FTO), in the potential window of 0.2 to −0.7 V with respect to Ag|AgCl reference electrode, as shown in Fig. 1(a). Electrodeposition of Cu2O mainly involves two steps: reduction of Cu2+ ions to Cu+ ions, followed by formation of Cu2O, as reported in the literature [Reference Izaki, Shinagawa, Mizuno, Ida, Inaba and Tasaka28]; electrodeposition of Cu2O involves following reaction:
 $$2{\rm{C}}{{\rm{u}}^{2 + }} + 2{{\rm{e}}^ - } + 2{\rm{O}}{{\rm{H}}^ - } \to {\rm{C}}{{\rm{u}}_2}{\rm{O}} + {{\rm{H}}_{\rm{2}}}{\rm{O}}\quad .$$
(a) Cyclic voltammogram prior to the electrodeposition, (b) X-ray diffractogram, and (c) SEM image showing cubic morphology of electrodeposited cuprous oxide (Cu2O).

The obtained film was polycrystalline with a predominant (111) orientation among the characteristic peaks (110), (111), (200), and (311) at 2θ = 29.61, 36.42, 42.15, and 72.9, respectively, which can be indexed to cuprite mineral (JCPDS #78-2076) with lattice parameter a = 4.26 Å. Fig. 1(b) shows X-ray diffraction (XRD) pattern of electrodeposited Cu2O thin film over FTO. Cathodically electrodeposited Cu2O film has cubic morphology and a uniform thickness of 2.7 μm, as shown in Fig. 1(c).
Development of copper oxide–hydroxide nanostructures
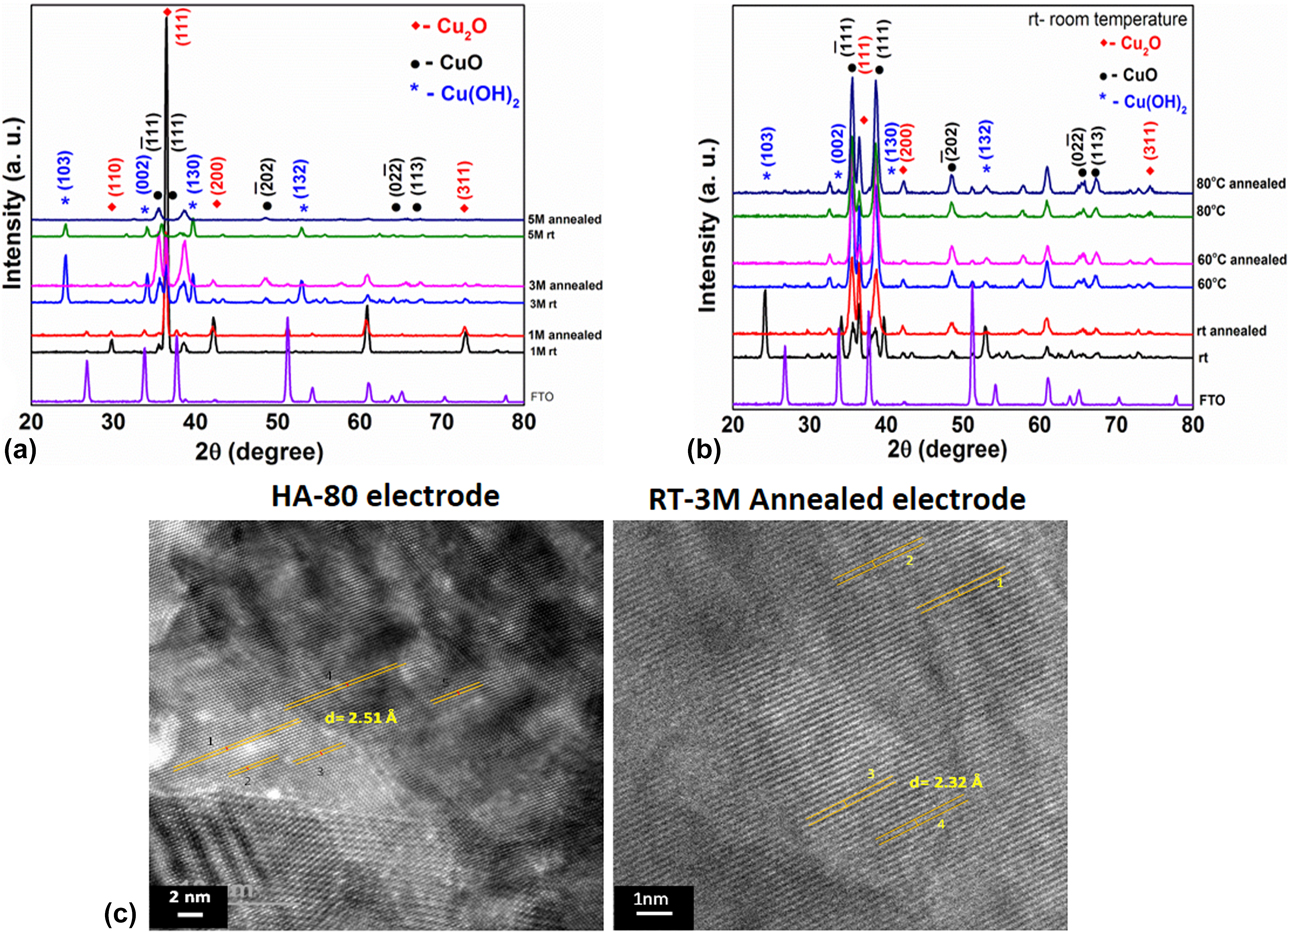
Copper(II) hydroxide [Cu(OH)2] and cupric oxide (CuO) nanostructures were developed on cuprous oxide film under alkaline and oxidative conditions, involving inorganic polycondensation reactions. The pH of reactant solution plays a crucial role in controlling the growth and morphology of copper oxide–hydroxide nanostructures. For room temperature (RT) reactions, it has been observed that at low pH values (acidic medium), oxides are formed but get dissolved by forming a blue solution. The oxides start forming above the neutral pH range (pH 8–10), but no significant growth of CuO was observed. However, at higher alkaline pH (i.e., greater than 10) and NaOH concentration more than 1 M, growth and formation of cupric oxide along with copper hydroxide took place [Reference Zhang, Wen and Yang29]. Oxidation of electrodeposited cuprous oxide was carried out with different NaOH concentrations at RT. Fig. 2(a) shows the XRD patterns of the oxidized samples before and after annealing, which are indexed to the orthorhombic copper(II) hydroxide with lattice constants a = 2.94 Å, b = 10.59 Å, and c = 5.25 Å, vide JCPDS #00-013-0420, and monoclinic cupric oxide having lattice parameters a = 4.66 Å, b = 3.41 Å, and c = 5.11 Å, vide JCPDS #03-065-2309, along with the cuprous oxide diffraction peaks. For samples prepared in 1 M NaOH alkali bath, no significant oxidation of Cu2O was noticed, whereas in 5 M NaOH alkali bath concentration, complete oxidation of Cu2O → CuO took place. However, oxidation carried out in alkali bath having 3 M NaOH leads to partial oxidation of the cuprous oxide, resulting in the development of mixed valent copper oxide–hydroxide forming CuO:Cu(OH)2/Cu2O/FTO hierarchal structure. After air annealing the as-prepared samples at 250 °C for 4 h in muffle furnace, the intermediate orthogonal Cu(OH)2 phase present got dehydrated to form monoclinic CuO, which results in CuO/Cu2O/FTO hierarchal structure. As partial oxidation was desired, the alkali bath concentration was fixed at 3 M NaOH, and a further optimization of parameters and characterization were performed for the samples prepared at this concentration to form this hierarchal structure. Fig. S1(a) shows the morphological evolution of CuO:Cu(OH)2/Cu2O nanorods and crumbled CuO/Cu2O nanorods for oxidation carried out at RT with three different NaOH concentrations. Fine nanowhiskers with 1 M NaOH and nanorods with 3 M and 5 M NaOH were developed over the electrodeposited cubic Cu2O. Annealing leads to crumbling and curling of the nanorods, as the internal stress is released, leading to the development of cracks and deformations.
XRD patterns of Cu(OH)2 and CuO nanostructures developed over electrodeposited cuprous oxide (a) for 1 M, 3 M, and 5 M NaOH; (b) at RT and HA bath (60 and 80 °C) for 3 M NaOH; and (c) HRTEM images of HA-80 and RT-3M annealed electrodes.

When oxidation was carried out in hot alkali (HA) bath, i.e., at slightly elevated temperatures, 60 and 80 °C, topotactic transformation took place, where cubic Cu2O directly formed monoclinic CuO, forming CuO/Cu2O hierarchal structure, as confirmed from the XRD. Fig. 2(b) shows XRD pattern of the samples prepared in 3 M NaOH at RT and 60 and 80 °C, before and after air annealing at 250 °C for 4 h. It was observed that intermediate copper(II) hydroxide phase was absent and only cupric and cuprous oxides were present in the samples prepared at elevated temperatures, which can be indexed to monoclinic cupric oxide having lattice parameters a = 4.66 Å, b = 3.41 Å, and c = 5.11 Å, vide JCPDS #03-065-2309, and cubic cuprous oxide, vide JCPDS #78-2076. Fig. S1(b) illustrates the morphological evolution of CuO/Cu2O nanoflakes, when alkali bath temperature was increased to 60 and 80 °C from RT. Due to faster reaction kinetics in HA bath, dense assembly of randomly oriented interconnected nanoflakes of monoclinic cupric oxide with high lateral aspect ratio was obtained. Lateral dimensions can be estimated to be 800 nm–1 μm × 20–30 nm for nanoflakes (developed in 80 °C HA bath).
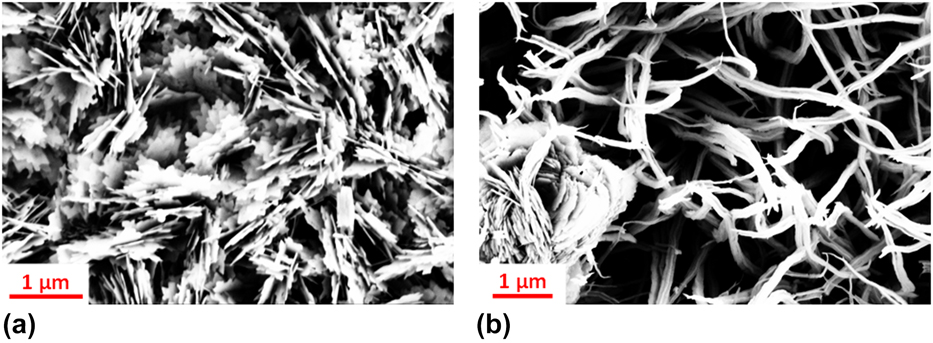
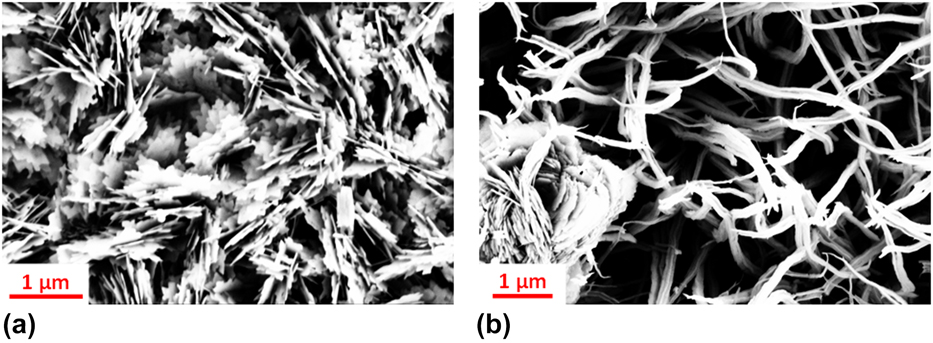
Well-defined lattice fringes were observed in the transmission electron microscopic (HRTEM) image shown in Fig. 2(c), indicating good crystallinity with an interplanar spacing of 2.51 Å corresponding to  $\left( {\bar{1}11} \right)$ planes of CuO in HA-80 sample [prepared in 3 M NaOH HA bath (bath temperature 80 °C)] and resolved lattice fringes with interplanar spacing of 2.32 Å, which corresponds to (111) planes of CuO in RT-3M annealed sample (prepared in 3 M NaOH at RT and annealed at 250 °C). Scanning electron micrographs of HA-80 electrode having nanoflake and RT-3M annealed electrode having crumbled nanorod morphology are shown in Figs. 3(a) and 3(b), respectively.
Scanning electron micrograph of (a) HA-80 and (b) RT-3M annealed electrodes.
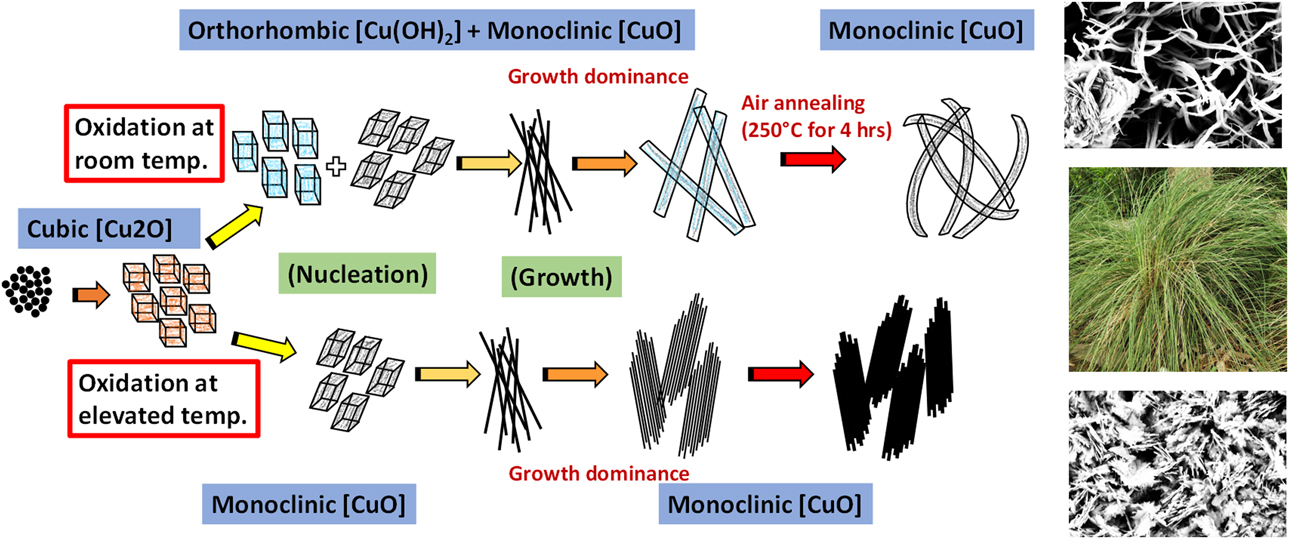
Growth mechanism for the formation of CuO:Cu(OH)2/Cu2O and CuO/Cu2O hierarchal structure having nanorod and nanoflake morphologies at RT and at elevated temperatures before and after air annealing is illustrated in Fig. 4. As a key reagent, NaOH is used to supply OH− ions, whereas (NH4)2S2O8 helps controlling the supply of OH− ions to form Cu(OH)2. Ammonium persulfate is a well-known catalyst providing free radicals to initiate the radical polymerization in acrylamides [Reference Cho, Yoon and Song30]. In the present case, the persulfate ions (S2O82−) control the oxidation of Cu2O through the available OH− ions to form Cu(OH)2 (at RT) and CuO (at elevated temperature) through different routes of nucleation and growth, as presented in Fig. 4. Overall reaction at RT and in HA bath can be summarized as below:
Proposed growth mechanism of Cu(OH)2 and CuO nanostructures under different reaction conditions.

At RT,
 $${\rm{C}}{{\rm{u}}_{\rm{2}}}{\rm{O}} + {{\rm{S}}_2}{{\rm{O}}_8}^{2 - } + {{\rm{H}}_{\rm{2}}}{\rm{O}} + 2{\rm{O}}{{\rm{H}}^ - } \to 2{\rm{Cu}}{\left( {{\rm{OH}}} \right)_2} + 2{\rm{S}}{{\rm{O}}_4}^{2-}\quad ,$$
 $${\rm{C}}{{\rm{u}}_{\rm{2}}}{\rm{O}} + {{\rm{S}}_2}{{\rm{O}}_8}^{2 - } + 2{\rm{O}}{{\rm{H}}^ - } \to 2{\rm{CuO}} + {{\rm{H}}_{\rm{2}}}{\rm{O}} + 2{\rm{S}}{{\rm{O}}_4}^{2-}\quad .$$
In HA bath,
 $${\rm{C}}{{\rm{u}}_{\rm{2}}}{\rm{O}} + {{\rm{S}}_2}{{\rm{O}}_8}^{2 - } + 2{\rm{O}}{{\rm{H}}^ - } \to 2{\rm{CuO}} + {{\rm{H}}_{\rm{2}}}{\rm{O}} + 2{\rm{S}}{{\rm{O}}_4}^{2-}\quad .$$
Both on annealing and in HA bath,
 $${\rm{Cu}}{\left( {{\rm{OH}}} \right)_2}\buildrel {{\rm{Heat}}} \over \scale 140%\longrightarrow {\rm{CuO}} + {{\rm{H}}_{\rm{2}}}{\rm{O}}\quad .$$
At RT, cuprous oxide gets oxidized by the OH− ions to form Cu(OH)2 nuclei. It is a well-known fact that the crystallographic orientation of the nuclei during the nucleation process dictates their subsequent growth and is the key parameter determining the final shapes of the nanocrystals [Reference Zhang, Zhang, Xu, Yang, Huang, Nie, Liu and Yang31, Reference Dar, Ahsanulhaq, Kim, Sohn, Kim and Shin32]. Since Cu was present in divalent oxidation state in Cu(OH)2 and CuO, the copper(II) hydroxide having (020) and (130) as dominant planes leads to the formation of nanowires initially. The fine CuO + Cu(OH)2 nanowires eventually resulted in the growth of nanorods that are randomly oriented, consequently forming tussock-like structures. During the topotactic transformation of Cu2O → CuO at elevated temperatures, primarily fine nanowires were formed, which readily got arranged in a typical manner to form flake-like tenorite nanostructures having  $\left( {\bar{1}11} \right)$ and (111) as the dominant planes, owing to faster reaction kinetics at elevated temperatures [Reference Zheng, Van, Pawar, Kim and Kang33].
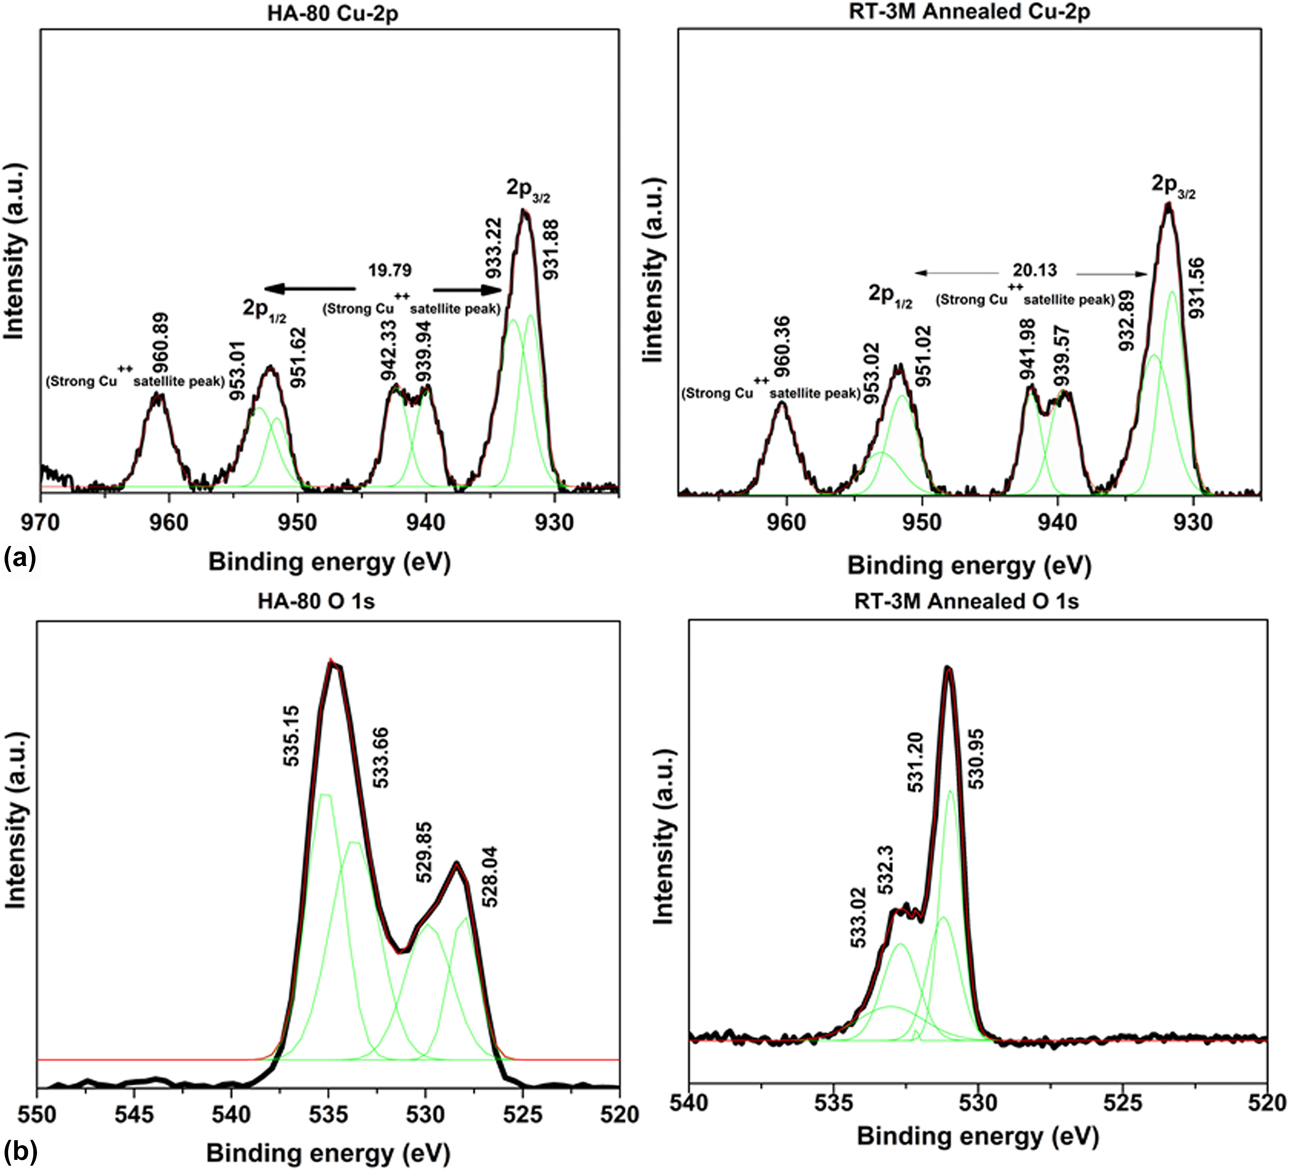
To further investigate the surface of the developed CuO nanostructures over electrodeposited Cu2O, X-ray photoelectron spectroscopy (XPS) was carried out. The XPS, being a surface sensitive technique, is capable of characterizing multilayers in thin films by selective layer etching by sputtering ion beams and collects localized valence d orbitals of transition metal compound [Reference Cao, Monnell, Matranga, Wu, Cao and Gao34]. Spectra for the Cu 2p 3/2 and Cu 2p 1/2 core-level and shake-up satellites for electrodes HA-80 and RT-3M annealed are shown in Fig. 5(a). The peaks corresponding to Cu(2p 3/2) are located at binding energies 933.22 eV and 932.89 eV and those corresponding to Cu(2p 1/2) are located at binding energies 953.01 eV and 953.02 eV, respectively, for HA-80 and RT-3M annealed electrodes. The core-level primary excitation peaks at ∼933 and ∼953 eV are the characteristics of Cu++, and the shake-up satellite peaks represent the evident existence of divalent state having unoccupied 3d 9 shell, corresponding to the presence of Cu++ [Reference Yin, Wu, Lou, Burda, Koberstein, Zhu and O’Brien35]. The satellite peaks are detected at higher binding energies of ∼9.1 eV and ∼7.3 eV than that of the Cu 2p 3/2 and Cu 2p 1/2 peaks. It has been previously reported that binding energy separation of ≤19.8 eV was observed in either pure metallic Cu or Cu2O and energy separation of ≥19.8 eV was observed in CuO [Reference Shaikh, Pawar, Devan, Ma, Salvi, Kolekar and Patil36]. The oxygen core-level 1s spectra are shown in Fig. 5(b), corresponding to HA-80 and RT-3M samples. The peaks corresponding to the binding energies 531.2 eV and 530.9 eV in RT-3M annealed sample corresponds to oxygen in Cu(OH)2 and Cu2O, respectively. On the other hand, the deconvoluted peak position at 529.85 eV corresponds to a major coordination of oxygen in CuO in the HA-80 sample. The O-1s primary excitation around 534 eV in the HA-80 is expected to have appeared from the oxygen due to the presence of NaOH in the sample through its processing. Moreover, a broad O-1s peak characteristics in HA-80 sample indicate a multiple coordination of oxygen existing by the nature of its processing route.
(a) The Cu 2p spectra (core-level and shake-up satellites) and (b) oxygen core-level 1s spectra corresponding to HA-80 and RT-3M electrodes.

Electrochemical investigation/performance: Study of charge interaction kinetics and electrode–electrolyte interface
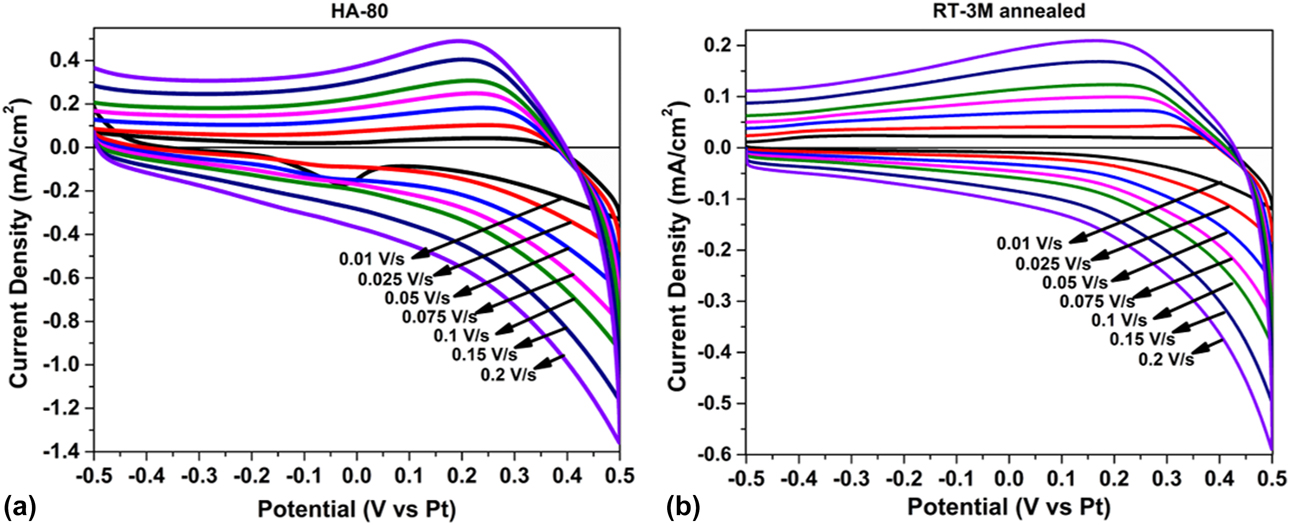
Cyclic voltammetry (CV) was performed to extract the qualitative information and the electron stoichiometry involved in the electrochemical process. Varying the sweep rates provides information about the coupled homogeneous reactions, adsorption and diffusion process, involved within the electrochemical system [Reference Skoog, Holler and Crouch37, Reference Carriedo38, Reference Kissinger and Heineman39]. The CV for HA-80 and RT-3M annealed electrodes was carried out in a typical three electrode setup with platinum as counter and reference electrodes at different scan rates, using 6 M KOH as electrolyte in the potential window of −0.5 to 0.5 V, as shown in Fig. 6. An asymmetric CV curve without mirror image characteristic and cathodic peak suggests considerable contribution of involved irreversible redox reactions. A clear understanding of the charge adsorption/diffusion kinetics in the prepared HA-80 and RT-3M annealed electrodes may be obtained by quantifying the contributions from more dynamic surface-controlled reactions and a rate-limiting or diffusion-controlled processes. Conventionally, this can be done by establishing the relationship between the response current [i(v)] and the potential sweep rate (v) [Reference Liu, Wang, Xu, Jiang, Li, Zhang, Lin and Shen40]. The total measured current in the CV may be expressed in terms of the sum of current required to initiate a faradaic process (capacitive part) and a slow diffusion-controlled part, as described by the following equations [Reference MacArthur41]:
 $$i\left( v \right) = {i_{{\rm{cap}}}} + {i_{{\rm{diff}}}} = a{v^b}\quad ,$$
 $$\log \;i\left( v \right) = \log \;a + b\;\log \;v\quad .$$
CV of (a) HA-80 and (b) RT-3M annealed electrodes performed at different scan rates.
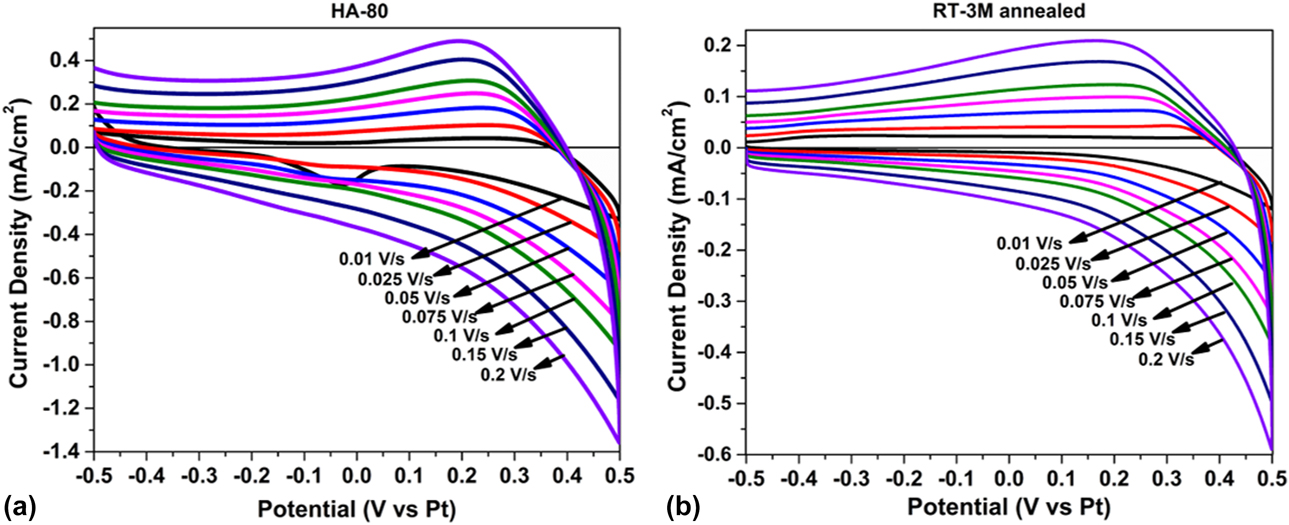
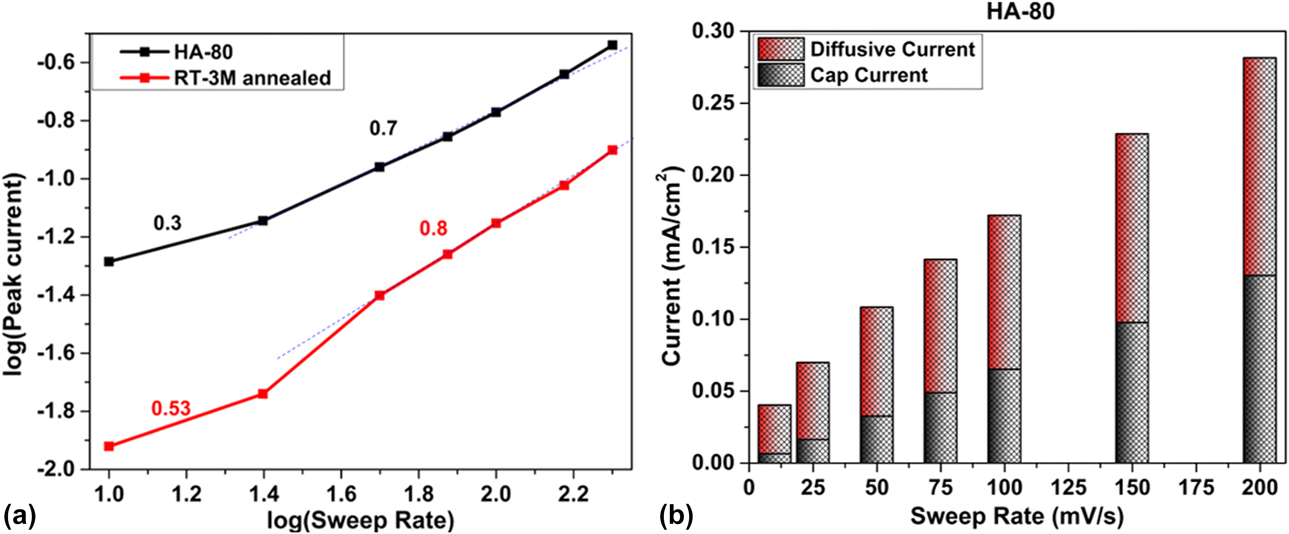
As the total current follows an empirical relation, i(v) = av b [Eq. (6)], parameter “b” signifies the demarcation between above two processes over various sweep rates. An ideal surface-controlled process or faradaic charge/discharge leads to b = 1.0, whereas a diffusion-controlled process should restrict it to b = 0.5. The involvement of diffusion-controlled and surface-controlled reactions was thus segregated for different sweep rates for both the electrodes. Both HA-80 and the RT-3M annealed electrodes show linear variation of log i(v) versus log(v) [Eq. (7)] in two regions of the sweep rates, as shown in Fig. 7(a). Below the sweep rate of 25 mV/s, both show diffusion-controlled behavior, whereas the capacitive behavior was prominent at higher sweep rates. Interestingly, RT-3M annealed electrode shows a higher b ∼ 0.8 than HA-80 electrode (b ∼ 0.7). The nanorod morphology of the CuO (RT-3M annealed) therefore facilitates a faster faradaic contribution to the charge/discharge, which may be revealed from the galvanostatic charge–discharge (GCD) characteristics, as shown in Fig. S2. As morphology plays a key role in charge interaction kinetics (i.e., transfer and alignment of charges), the contribution of both diffusion-controlled (having steeper slope) and surface-controlled charge organization was more in HA-80 electrode having nanoflake morphology, as shown in Figs. 7(a) and 7(b). Nanoflake morphology having greater interconnectivity, higher surface area of 85.82 m2/g, and higher porosity compared with nanorod morphology (as shown in Fig. 3) contributes to better ions diffusion with shorter diffusion lengths. A reasonably good charge–discharge cycle stability of the supercapacitor developed from HA-80 electrode was also tested for 500 cycles, as shown in Fig. S2(c).
(a) Kinetic information about the electrochemical reactions depending on the linear relation between log(i) versus log(ν). (b) Contribution of capacitive current and diffusive (redox) currents in HA-80 electrode.

According to literature, the CV of nanostructured CuO in alkaline electrolyte undergoes redox reactions involving transition between Cu(I) and Cu(II) as follows [Reference Sharma, Singh and Chandra42]:
 $${\rm{C}}{{\rm{u}}_{\rm{2}}}{\rm{O}} + 2{\rm{O}}{{\rm{H}}^ - } \rightleftharpoons 2{\rm{CuO}} + {{\rm{H}}_{\rm{2}}}{\rm{O}} + 2{{\rm{e}}^ - }\quad ,$$
 $${\rm{C}}{{\rm{u}}_{\rm{2}}}{\rm{O}} + {{\rm{H}}_{\rm{2}}}{\rm{O}} + {\rm{O}}{{\rm{H}}^ - } \rightleftharpoons {\rm{Cu}}{\left( {{\rm{OH}}} \right)_2} + {{\rm{e}}^ - }\quad ,$$
 $${\rm{CuO}} + {{\rm{H}}_{\rm{2}}}{\rm{O}} + {{\rm{e}}^ - } \rightleftharpoons {\rm{CuOH}} + {\rm{O}}{{\rm{H}}^ - }\quad ,$$
 $${\rm{CuOH}} + {\rm{O}}{{\rm{H}}^ - } \rightleftharpoons {\rm{Cu}}{\left( {{\rm{OH}}} \right)_2} + {{\rm{e}}^ - }\quad .$$
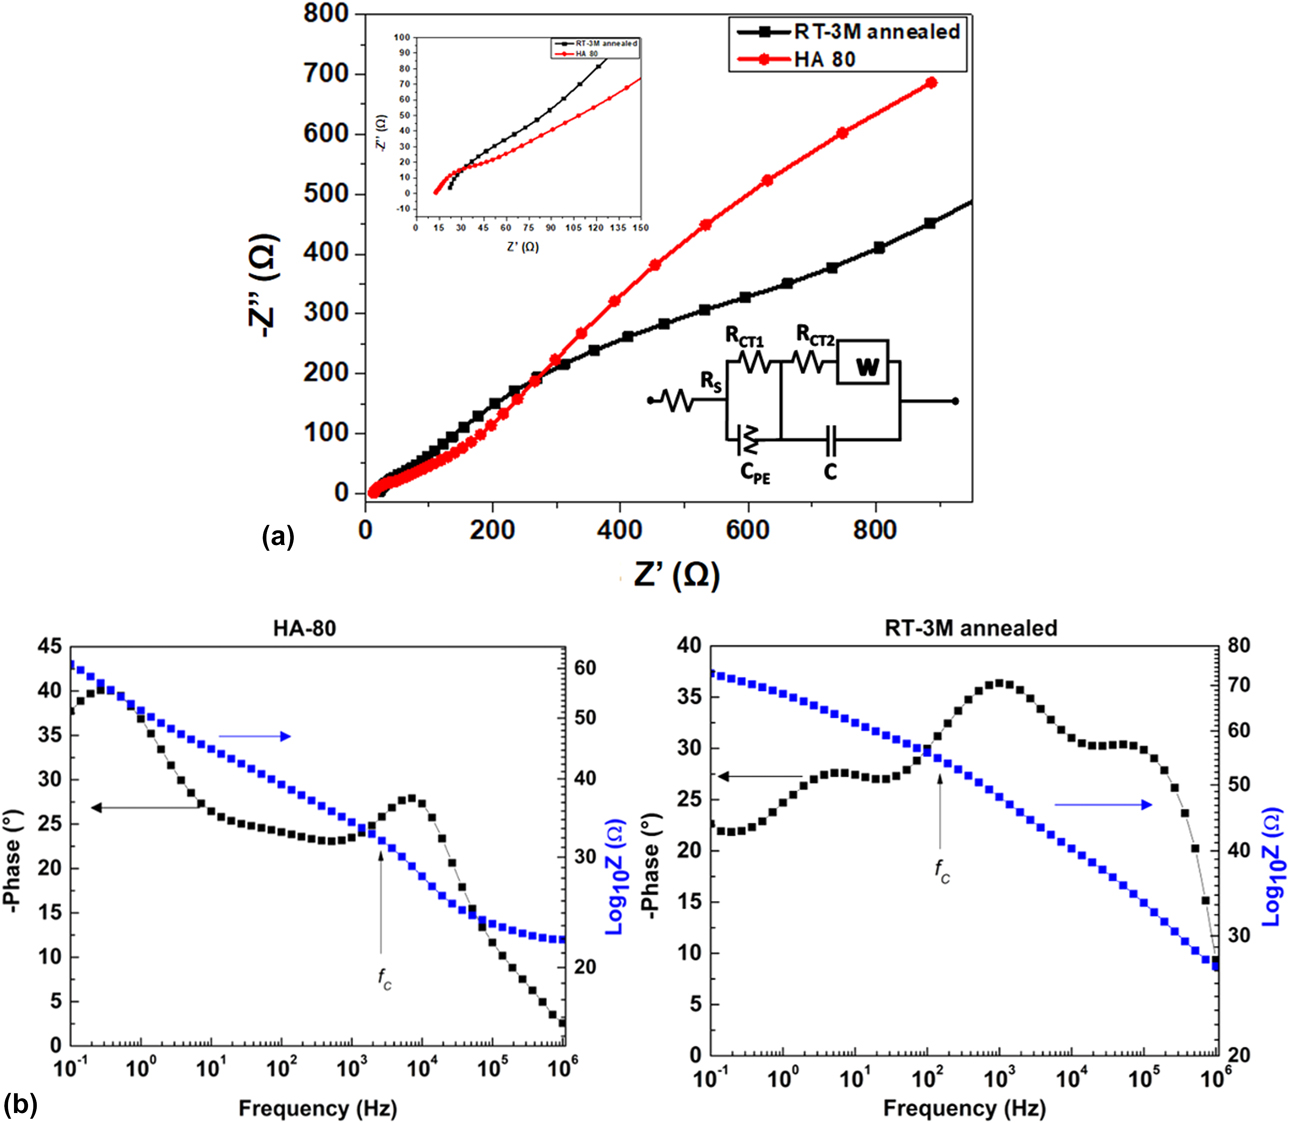
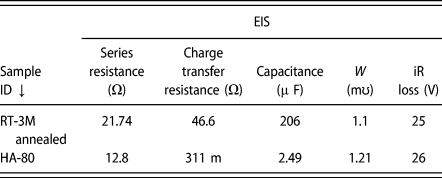
Semiconductor electrode–electrolyte interface is studied by electrochemical impedance spectroscopy (EIS). It is a powerful tool to characterize solid–liquid interfaces for their charge transfer and diffusion characteristics [Reference Orazem and Tribollet43, Reference Chang and Park44]. The EIS technique has long been used to study electrochemical capacitors electrode–electrolyte interface to understand their charge relaxation and transfer behaviors [Reference Macdonald and Barsoukov45, Reference Taberna, Simon and Fauvarque46]. During electrochemical measurements, not just the charge organization or redox processes occurs on the active material but also there is significant influence of the diffusion of electrolytes, jointly affecting the charge transfer characteristics. The EIS imposes alternating voltage to vary the frequency and measure impedance of the system to extract the resistive and capacitive components in a convenient manner. The Nyquist plot of the measured complex impedance, Z″(ω) versus Z′(ω) as shown in Fig. 8(a), may be fitted with the equivalent circuit as shown in the inset. Both the series (R s) and charge transfer resistances (R ct1, R ct2) are a key factor controlling the impedance response. The Warburg component (W) in combination corresponds to diffusion contribution. The constant phase element is provided by any charge depletion across the inhomogeneity in the electrode/Cu2O interface. Table I lists all the parameters of the above circuit impedance when fitted with the observed impedance in the Nyquist plot for HA-80 and RT-3M annealed samples. First of all, the series resistance in HA-80 electrode was almost half of that in RT-3M annealed sample. In addition, it was observed that in high-frequency region, the electrolyte resistance increases with the increase in ion traveling distance between the electrodes, which was inferred from the intercept on the real axis in the Nyquist plot shown in Fig. 8(a). For electrode HA-80, a small semicircle at higher frequency region and slope of −1/2 and −1 in the lower frequency region were observed, signifying the existence of small charge transfer resistance (at higher frequency), larger diffusion (as evident from the Warburg component), and the real capacitive behavior (at lower frequencies). The relaxation time constant of charge organization within the nanostructures may be obtained from the equation, τ0 = R ct2C, which is seen to be 9.6 ms and 0.8 µs for the RT-3M annealed and HA-80 electrodes, respectively. A transition from the resistive to the capacitive behavior is therefore possible [Reference Taberna, Simon and Fauvarque46] for a frequency lower than 1/τ0, which are approximately 104 Hz and 1.3 MHz, respectively. The Bode amplitude (Z versus f) and phase (ϕ versus f) plots, as shown in Fig. 8(b), on the other hand, provide a clearer understanding of the nature of inhomogeneity associated with the nanostructured electrode contact, which is the CuO rod or flakes forming interface with the Cu2O in the present study [Reference Patel and Ray47]. A larger slope of the Bode amplitude plot at high frequencies indicates reduced inhomogeneity, which is clearly seen in the case of HA-80 with a larger value of characteristic center frequency (f c, where the break point signifies a change in slope). The high-frequency maxima of the phase angle indicate inhomogeneous surface layers, while the low-frequency maximum corresponds to that of ideal kinetic behavior (phase angle close to 90°, the ideal capacitors) [Reference Morad48]. The larger value low-frequency phase angle in HA-80 clearly demonstrates a better capacitive behavior. The surface inhomogeneity is also large in RT-3M annealed electrode.
(a) The Nyquist plot with equivalent circuit and (b) the Bode plot of HA-80 and RT-3M annealed electrodes.

Electrochemical impedance parameters obtained from the Nyquist plot for HA-80 and RT-3M annealed electrodes.

Optical absorption and photoelectrochemical performance of the HNS electrode
Both Cu2O and CuO are semiconducting materials with direct and indirect band gap, respectively. Literature shows that bulk forms of CuO exhibit absorption edge near 950 nm (∼1.3 eV), whereas Cu2O shows sharp absorption edge around 550 nm (∼2.25 eV) [Reference De Jongh, Vanmaekelbergh and Kelly49, Reference Marabelli, Parravicini and Salghetti-Drioli50]. As expected, their hierarchical structure shows typical optical absorption behavior characterized by both layers. Fig. S4 shows absorption spectra of electrodeposited Cu2O and HA-80 electrode (having CuO/Cu2O configuration). It is evident from the absorbance curve that the hierarchal structure has broadened the absorption range from ultraviolet (UV) to IR, completely covering the visible range, compared with the electrodeposited Cu2O. The broad-range visible photon absorption is especially useful in many optoelectronic devices, including solar energy conversions. Copper oxide thin films and their nanostructures, on the other hand, have been well established as visible photoactive semiconductors in various applications, including the photoelectrochemical mode of solar fuel generation [Reference Ray, Mukhopadhyay, Pati, Hattori, Prakash, Ishii and Kawasaki51, Reference Patel, Pati, Marathey, Kim, Mukhopadhyay and Ray52, Reference Paracchino, Laporte, Sivula, Grätzel and Thimsen53]. Photoelectrochemical cells (PECs) are expected to convert incident solar radiation into hydrogen (a zero-emission, storable fuel having high calorific value) with a relatively high energy conversion efficiency. However, in most of these photocathodes, the efficiency of the PEC process (e.g., the solar fuel generation) is limited by the semiconductor’s band alignment with respect to the water redox levels. Although the valence band of CuO is more positive than the O2/H2O level, its conduction band is only slightly negative than the H+/H2 level, resulting in a very low water reduction efficiency. On the other hand, the conduction band of Cu2O is more negative than the H+/H2, but its valence band is only slightly positive than the O2/H2O level, resulting in a very low water oxidation efficiency. On the other hand, their hierarchical structures help align these band edges with respect to the water redox level, which is most favorable to over water splitting (i.e., a conduction band lying more negative than the H+/H2 and a valence band more positive than O2/H2O level), as shown in Fig. S5. CuO/Cu2O hierarchal structure is therefore highly favorable for PEC application, improving the solar absorption spectra compared with a single semiconductor, because of (i) the broadened absorption band (leading to efficient use of solar energy), (ii) efficient electron–hole separation (because of favorable band edge positions), (iii) the faster charge transportation rate, and (iv) protection against Cu2O photocorrosion [Reference Niveditha, Fatima and Sindhu54, Reference Zhang and Wang55, Reference Liu, Chen, Liu, Zhang, Li, An and Zhao56, Reference Lim, Chua, Lee and Chi57]. Photoresponse of HA-80 electrode was compared with that of the electrodeposited Cu2O and CuO electrode by examining the dark and light envelope of J–V [versus reversible hydrogen electrode (RHE)], as shown in Figs. S5(b) and S5(c). Photocurrent densities of 1.5 mA/cm2 and 1.1 mA/cm2 were obtained at −0.25 V potential (versus RHE) for CuO/Cu2O and Cu2O configurations, respectively, under illumination, whereas current densities of 0.54 mA/cm2 and 0.6 mA/cm2 were obtained at 0 V potential (versus RHE) for Cu2O and CuO electrodes, respectively. Enhancement in the photocurrent may be attributed to the favorable band alignment as mentioned above. Since the conduction band minimum (CBM) of Cu2O is more negative than that of CuO and the valence band maximum (VBM) of CuO is lower than that of Cu2O, electrons are thermodynamically more favorable to reach the electrolyte interface to perform necessary reduction process. The PEC measurements also revealed that sample having flake-like morphology exhibited almost double photocurrent compared with that in nanorod morphology [as shown in Fig. S5(d)]. It is worth mentioning that a fast electron diffusion such as obtained in HA-80 electrode with characteristic time of 0.8 μs is ideal for photocathode, which prohibits the possibility of photocorrosion in the electrode. The durability test has been carried out for electrodeposited cuprous oxide and the hierarchical CuO/Cu2O structure, at 0 V for 6 h, as shown in Fig. S5(e). The chronoamperometric plot reveals that there is significant degradation in the cuprous oxide sample (red) and a substantial improvement was observed in the hierarchical CuO/Cu2O structure (black). The internal photoconversion efficiency (IPCE) measurement was conducted in the pristine electrodeposited Cu2O, the annealed sample (CuO), and hierarchical electrodes (RT-3M and HA-80) to understand the photon-to-charge carrier generation in them. As shown in Fig. S6, the IPCE of pristine electrode (Cu2O) has higher quantum yield than the fully annealed (CuO) electrodes and its hierarchical structures. A higher quantum yield of the pristine electrode stems from its direct band gap, whereas a lower quantum yield may be attributed to the indirect band gap CuO and its nanostructures developed over Cu2O. This observation for all photon energies (UV and visible) indicates that the photoconversion in the hierarchical structures takes place only near to the surface, except for the low-energy photons, which get absorbed deeper in the layer irrespective of the microstructure.
As the charge transfer resistances arise mainly due to a mismatch in the electronic conductivity and the ionic conductivity at the electrode–electrolyte interface [Reference Dubal, Gund, Holze and Lokhande58], the morphology played a vital role in determining the charge transfer kinetics. A lowest charge transfer resistance was obtained for HA-80 electrodes, which suggests that dense assembly of closely packed, nearly vertically aligned nanoflakes provides better open pathways and better conductivity for a faster ion diffusion in storage applications. It can also facilitate a faster transport of photogenerated electrons to the electrolyte in the case of the PEC application.
Conclusion
HNS of Cu oxides were developed by a simple and scalable low-temperature process, including electrodeposition and annealing. The development of nanostructures involved partial oxidation of electrodeposited cuprous oxide leading to transformation of Cu+ to Cu2+, forming copper(II) hydroxide and oxides. Variation in process parameters resulted in the development of different morphologies, like nanowhiskers, nanorods, and nanoflakes, leading to the formation of tussock-like structures, which are suitable for different applications demanding large surface area. The electrochemical measurements provided in-depth understanding of the charge organization mechanism and the interface kinetics involved in the obtained cupric oxide/cuprous oxide system. It was observed that morphology played a key role in the charge interaction process. The electrode fabricated under controlled preparation conditions, with chemical bath temperature maintained at 80 °C ± 5 °C, resulted in nanoflake morphology (surface area of 85.82 m2/g), having higher ion conductivity and percolation pathways. Electroanalytical study demonstrates that the developed HNS ensures both better redox charge transfer pathways for fast charging–discharging cycle in supercapacitor and thermodynamically favorable band alignment, leading to higher photocurrent for photoelectrochemical water splitting applications.
Experimental section
Electrodeposition of cuprous oxide was carried out in a standard three-electrode setup, where FTO was used as a working electrode, Ag|AgCl as a reference electrode, and platinum as the counter electrode. Before deposition, FTO (∼1 × 1.5 cm) was cleaned with trichloroethylene, deionized (DI) water (resistivity 18 MΩ cm), and acetone in an ultrasound bath for 15 min each. A 2.7 µm thick Cu2O film was deposited on cleaned FTO using bulk electrolysis with coulometry at a cathodic potential of −0.4 V versus Ag|AgCl at 60 °C ± 5 °C from an aqueous solution containing 0.4 M anhydrous copper sulfate and 3 M lactic acid buffered to pH 11 with 4 M NaOH solution.
Nanostructured cupric oxide (CuO) and copper(II) hydroxide [Cu(OH)2] were developed over electrodeposited cuprous oxide film by immersing the cuprous oxide films in an aqueous solution containing sodium hydroxide (NaOH) (concentration varied from 1 to 5 M) and ammonium persulfate [(NH4)2S2O8, 0.2 M]. The chemical reaction was carried out at ambient conditions and at elevated temperatures (60 and 80 °C) for 20 min. The chemically treated films were rinsed in DI water and ethanol, followed by drying in oven at 60 °C for 2 h. All the chemicals used were of analytical grade and no further treatment was done. The further oxidation of the electrodeposited Cu2O was carried out in a scheme as reported elsewhere [Reference Marathey, Pati, Mukhopadhyay and Ray59].
XRD studies for structural analysis were carried out in (Panalytical X'pert pro, Almelo, The Netherlands), employing Cu Kα radiation (λ = 1.54 Å) having 2θ range from 20° to 80° with a step size of 0.05 s/step. XPS analysis was carried out in AXIS Supra, Kratos Analytical using a monochromatic Al Kα X-ray source with the analysis chamber pressure maintained <2.0 × 10⁻⁷ Pa to determine the composition of developed copper oxide nanostructures. Morphology of nanostructures was investigated in field emission scanning electron microscopy (FE-SEM; Zeiss ultra 55, Carl Zeiss Group, Oberkochan, Germany) with an operating voltage of 5 kV. High-resolution lattice images were obtained using an HRTEM operating at 300 keV (FEI, Tecnai, Hillsboro, Oregon). BET surface area measurements were conducted in Quantachrome AutosorbiQ (Quantachrome instruments, Boynton Beach, Florida). Electrochemical processes (electrodeposition, CV, and GCD measurements) were carried out in potentiostat–galvanostat (CHI 608E; CH Instruments, Inc., Austin, Texas). Optical absorption spectra were recorded in a UV visible spectrophotometer (UV-2600; Schimadzu, Kyoto, Japan). For electrochemical measurements, 6 M KOH in aqueous solution was used as electrolyte. CV was performed with voltage scan rates of 10, 25, 50, 75, 100, 150, and 200 mV/s. The interface and frequency response were studied by EIS, which was carried out at a frequency range between 0.1 Hz and 1 MHz at an AC amplitude of 10 mV. The photoelectrochemical measurements were conducted in a standard three electrode setup as shown in the schematic of Fig. S5(a), with CuO/Cu2O as the working electrode, Ag|AgCl as the reference electrode, and platinum gauge as the counter electrode, under AM1.5 illumination produced by solar simulator (model SS80; Photo Emission Tech, Inc., Moorpark, California). Linear sweep voltammetry was performed at a scan rate of 10 mV/s in 1 M Na2SO4 aqueous solution having pH 5.87. The applied potential was further converted in terms of RHE according to Eq. (S3) (Supplementary material). IPCE spectra were acquired using an Optosolar SR 300 (Optosolar GmbH, Merdingen, Germany) spectral response measurement setup. A lock-in amplifier (SR 830; Stanford Research, Stanford Research Systems, Sunnyvale, California) with a current preamplifier under short circuit conditions was used for photocurrent measurement. The electrodes were illuminated with approximate spot size of 2.5 mm × 2.5 mm by monochromatic light produced by a double grating monochromator in combination with a xenon lamp. Calibrated silicon photodiode with known spectral response was used for reference spectrum.
Supplementary material
To view supplementary material for this article, please visit https://doi.org/10.1557/jmr.2019.231.
Acknowledgments
One of the authors (PM) gratefully acknowledges and appreciates the Council of Scientific and Industrial Research (CSIR), New Delhi, for providing financial assistance through Senior Research Fellowship (via Grant Nos. 9/1074 (0001)/2017-EMR-1); Dr. C Balasubramanian, Facilitation Centre for Industrial Plasma Technologies, Institute for Plasma Research, Gandhinagar, for TEM analysis; and the Central Surface Analytical Facility of IIT Bombay for XPS analysis.