Was Thomas Robert Malthus correct in his belief that while untold millions of European lives had been blighted by malnutrition, “perhaps in some … states an absolute famine may never have been known?”Footnote 1 It is a view endorsed by Robert Fogel, who argues that in early modern England and France hunger was commonplace but starvation rare, with scarcities arising more from “failures in the system of food distribution” than from natural calamities per se.Footnote 2 For Fogel, the real problem was the inelasticity of demand, which magnified modest harvest shortfalls into massive price swings so that staple foodstuffs were rendered unaffordable by those most in need.Footnote 3 Karl Gunnar Persson disagrees: he claims that “in early modern Europe, the magnitude of harvest ‘defects’ was very large indeed.”Footnote 4 His estimates of the elasticity of demand are higher than Fogel's, implying that distributional dysfunction was more likely to aggravate than cause bad subsistence situations.
Did real supply-side failures pose scant threat to preindustrial England, as Malthus and Fogel both supposed? Or is Persson correct in believing that England was little different from France, Sweden, and other European countries in its periodic exposure to harvest shortfalls, the worst of them big enough to precipitate the heavy excess mortality characteristic of major famines? If the latter, did both the variability of harvests and the price elasticity of demand fall in advance of the Industrial Revolution, so that famine receded as a threat? Or did they fail to change until agriculture and the international trade in foodstuffs were transformed by the technological innovations of the nineteenth century? Hitherto, historians have lacked the combination of good premodern yield and price evidence necessary to address these issues and resolve the contrasting positions of Fogel and Persson. This article redresses that deficiency and analyses the frequency and magnitude of harvest shortfalls and associated price elasticity of demand in England during the three periods 1268–1480, 1750–1850, and 1884–1939.
THE PRICE AND YIELD DATA
For want of reliable early evidence, Fogel and Persson both drew mainly on nineteenth- and early twentieth-century crop yield data—English, French, and Swedish—in their analyses of food supply variability in early modern Europe.Footnote 5 Thus Fogel's English grain price elasticity estimates are based on wheat yield data for 1884–1913 and price data for 1540–1840. This article removes the need for such improvisations by combining new high-resolution price and crop yield data sets for late medieval England. The price data set has been constructed by Gregory Clark and incorporates and supersedes earlier ones produced by Henry Phelps Brown and Sheila Hopkins and by David Farmer.Footnote 6 The yield data set has been assembled by Bruce Campbell and combines the work of several other historians.Footnote 7 Both provide annual data from 1268 until 1480, (when the yield data end). Not until the 1750s does an equivalent, though thinner, data set of farm-specific yields become available. These data have been assembled from farm accounts by Michael Turner, John Beckett, and Bethanie Afton and extend to the mid-nineteenth century (Figure 1).Footnote 8 To facilitate comparison between the two yield datasets and control for changing patterns of geographical coverage, national time series have been reconstructed using a common methodology and system of regional weights.Footnote 9 The period from 1480 to 1750 could not be covered because the available sources on yields (probate inventories or tithe records) do not provide a direct and price-independent measure of harvest quality.Footnote 10
MEAN ANNUAL NUMBERS OF GRAIN YIELD OBSERVATIONS FROM MANORIAL ACCOUNTS AND FARM ACCOUNTS

With its continuous span of more than 200 years, the medieval crop yields data set is the single largest body of English yield observations prior to the inclusion of yield information in the official agricultural statistics from 1884 (Figure 1). It contains almost 30,000 individual yield observations for over 200 seigniorial demesnes concentrated within the core regions of grain production in southern and eastern England. Data are fullest for the period c.1280 to c.1430, when making and keeping annual manorial accounts was most widespread and before leasing had become the almost universal practice of landlords. The raw data provide precisely dated yields per seed and yields per unit area of specific grains on specific demesne farms. These were invariably large-scale enterprises, which differed from smallholdings in terms of their cultivation techniques, capital investment, crop choice, and labor process. Nevertheless, although absolute levels of yield may have been different between the seigniorial and non-seigniorial sectors, high correlations between demesne yields and aggregate tithe receipts from all grain producers indicate that crop-specific year-to-year fluctuations in yields were broadly similar under both regimes.Footnote 11 It should be emphasized that these data relate exclusively to the rates of return per units of seed and land sown. Output variation arising from changes in the area under crop is not observable.Footnote 12
THE FREQUENCY AND SCALE OF BAD GRAIN HARVESTS
Beginning with W. G. Hoskins's pioneering attempt to infer harvest quality from English grain prices, historical analysis of “bad years” has typically focused upon wheat, the most commercialized and consequently best recorded of the major grains.Footnote 13 This, however, fails to do full justice to the agronomic reality, for oats and barley were also significant crops in medieval and early modern England. Both were staple ingredients of the coarser and cheaper grades of bread and were widely consumed as pottage by the poorer classes. Hence they are fully relevant to issues of subsistence. Moreover, both were better suited to brewing than wheat, and oats in particular was a staple fodder crop. Together, by value they consistently accounted for between a third and a half of all grain produced between 1300 and 1850.Footnote 14
Whereas wheat was invariably sown in the autumn, most barley and virtually all oats were sown in the spring. These spring grains were therefore largely unaffected by a bad autumn or winter and might even be sown as a replacement for wheat or rye if the latter seemed to have been severely damaged by harsh winter conditions. Since these grains differed in their nutrient demands upon the soil, they also formed complementary components of the more elaborate rotations as exemplified by the classic three-course rotation of winter crops, spring crops, and then a full year's recuperative fallow. Of these three staple grains, wheat may have been the most expensive and widely traded but only oats was capable of being grown in virtually all farming regions since it was tolerant of the widest range of growing conditions. In fact, in many upland areas it was almost the only grain grown.Footnote 15 To overlook oats is therefore to ignore the nation's most universal cereal. Oats was also far more affordable than wheat and its harvest was consequently more material to the nutrition of the poor.
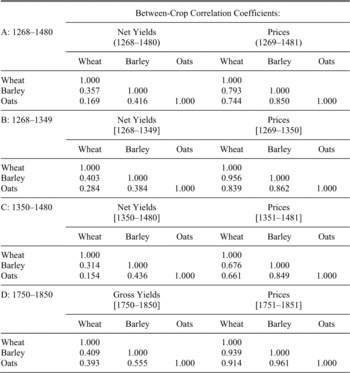
Sowing wheat in the autumn and almost all oats in the spring offered a good deal of insurance to cultivators and consumers, as captured by the relatively low, albeit positive, correlation between wheat and oats yields (Table 1). The correlation between first differences in net yields was +0.06. As is to be expected, year-to-year changes in oats and barley yields were more highly correlated (+0.30). The yield variability of a composite cereal (W-B-O) based on weights of 0.5 for wheat and 0.25 each for barley and oats (weighting the winter- and spring-sown grains equally and, within the spring sector, barley and oats equally) was considerably less than that of wheat alone.Footnote 16 Evidently, growing and harvesting conditions had to be exceptionally good or bad for the yields of winter and spring grains to have been similarly affected. This mattered little when both did well, but a lot when both fared badly, since in these cases cultivating both types of grain provided no insurance. Tellingly, the correlation coefficient between oats and wheat yields reaches +0.391 over the watershed period 1314–1351 when positive and negative environmental forcing of harvests was exceptionally strong, compared to only +0.169 over the entire period 1269–1480.Footnote 17
ENGLAND, 1268-1480 AND 1750-1850, BETWEEN-CROP YIELD AND PRICE CORRELATIONS

Note:
The yield data are from Campbell, “Three Centuries;” and Turner, Beckett, and Afton, Farm Production; the price data are from http://www.iisg.nl/hpw/data.php.
As Table 1 reveals, movements in the prices of the three crops were normally much more highly correlated, suggesting the integration of markets across, and interchangeability of demand between, cereals.Footnote 18 By the period 1750–1850 all correlations are higher but the wide differential between intercrop correlations of yields and prices nonetheless remained.
For all grains, yield variability seems to have shifted after 1350, although not in a simple or consistent way (Figures 2a and 2b). Wheat yields were most unstable in the half-century 1350–1399, when a succession of below-average harvests from 1350 to 1375 was followed by a run of the most bountiful harvests on record. In contrast, barley and oats yields both fluctuated most after 1450, when the data are thinnest (Figure 1) and least representative and the accuracy with which harvests were recorded may be declining.Footnote 19 These differences also reflect the subtle but profound shifts in weather conditions highlighted by recent environmental research.Footnote 20 Yet climate differences alone can hardly account for the fact that, as reconstructed from farm-level data, medieval yields of wheat and barley were three times, and medieval oats yields more than four times, as variable as modern (post-1884) English/British yields documented by the official agricultural statistics.Footnote 21
Across the entire period 1268–1480, using gross yields per acre, the detrended data indicate that the probabilities of a harvest shortfall of one-tenth or more in a given year were 0.23 for wheat, 0.22 for barley, and 0.19 for oats.Footnote 22 Using yields net of seed, the respective probabilities were 0.27, 0.29, and 0.26. The probabilities of a far greater shortfall of one-fifth or more were significantly lower: for wheat, barley, and oats, they were 0.10, 0.08, and 0.08 (gross), and 0.17, 0.15, and 0.12 (net). The insurance offered by sowing a range of crops is indicated by shortfall probabilities for W-B-O: for yield shortfalls of one-tenth and one-fifth, these were 0.16 and 0.05 (gross) and 0.22 and 0.11 (net). In other words, on average, one grain harvest in nine delivered a net yield at least 20 percent below trend. For wheat, however, shortfalls of this magnitude occurred at least once every six years. Prudent farmers therefore spread their risks and grew a mix of winter- and spring-sown grains.
Historically, the worst famines as well as the episodes of most acute dearth have been the product of back-to-back harvest failures.Footnote 23 Considered as random events, such repeat failures are bound to have been rare, but there are three reasons why harvest outcomes might be serially correlated. First, there could be some autocorrelation in environmental conditions, as in the case of the major climate anomaly responsible for the Great European Famine of 1315–1321 and concurrent European cattle panzootic of 1316–1321, and/or plant diseases such as the repeated mildew attacks recorded in Kent between 1365 and 1375 or, most notoriously, the blight-induced Irish Potato Famine of 1845–1851.Footnote 24 Second, a poor harvest, indicated by a low yield ratio, might mean thinner sowings and deficient yields or smaller sown areas and diminished output the next year (note, on the demesne farms represented in the medieval crop yields database, it was the seeded area rather than seeding rate that was most likely to be sacrificed). Third, any reductions in fertilizer and draught power following a bad year, whether because animals were dead or malnourished, or because farmers themselves were suffering, could reduce yield ratios. It turns out, however, that autocorrelations in yields, though generally positive, were small and never statistically significant either in the medieval period or in 1750–1850.Footnote 25
ENGLAND, 1268–1480, DEVIATIONS FROM TREND IN NET WHEAT-BARLEY-OATS (W-B-O) YIELDS

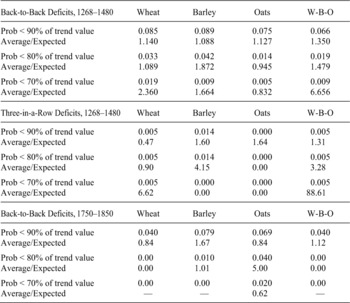
The top two panels of Table 2 are derived from fitting the medieval yield data to a Hodrick-Prescott filter (which extracts the cyclical component from a time series) and identifying those years with gross and net yields at least 10, 20, and 30 percent below trend. Focusing on net yields, between 1268 and 1480 back-to-back shortfalls of over 10 percent for individual cereals were not unusual. They were also somewhat more common than might be expected on the basis of squaring once-off probabilities. For example, the statistical probability of a back-to-back shortfall in net wheat yield of 10 percent or more was one in twelve (0.085), but such shortfalls occurred 14 percent more often than “expected.” Note that a serious shortfall was less likely for oats, the buffer crop of the poor, than the other two cereals. Unsurprisingly, the chance of all three major cereals simultaneously doing badly was lowest of all: the probability of a 10 percent back-to-back shortfall in the net W-B-O yield was one in fifteen (0.066). A failure on such a scale across all crops would almost certainly have led to genuine hardship and malnutrition for many, though hardly classic famine conditions. Back-to-back shortfalls sufficient to result in major famines were much rarer, especially those affecting all three major grains. For wheat and barley, consecutive net reductions of a fifth or more occurred only about once every three or four decades, although in this period they happened somewhat more often than might be expected if harvests were purely random (as indicated by the values of the average/expected entries in Table 2). The most dangerous shortfalls of all were double back-to-back (i.e., three-in-a-row) failures of this magnitude, but they were “out-of-the-blue” events likely to occur once in every two or three centuries.Footnote 26 Evidence on their randomness is mixed; they were more frequent in the case of wheat (gross yield), barley (net yield), and W-B-O (net yield), but not otherwise (Table 2).
LIKELIHOOD OF “BACK-TO-BACK” HARVEST FAILURES, ENGLAND, 1268–1480 AND 1750–1850

Note:
The W-B-O column is a weighted average of the net cereal yields of wheat, barley, and oats, using the ratio 2:1:1. “Average/Expected” is the ratio of the actual to predicted frequency. The predicted frequency is set at the once-off probability of such a shortfall squared or cubed. The yield data are from Campbell, “Three Centuries,” and Turner, Beckett, and Afton, Farm Production, (the annual series have been reconstructed from original data supplied by the authors).
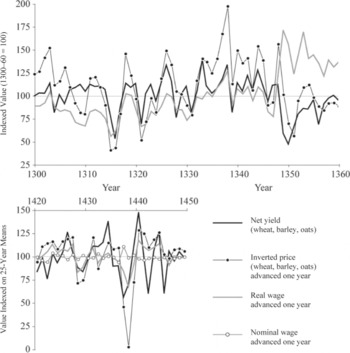
Across the entire period, 1268–1480, three episodes registered back-to-back reductions in the net W-B-O yield in excess of 25 percent (Figures 2a, 2b, 3a, and 3b): 1315/16, 1349–1351 (the only three-in-a-row failure of this magnitude), and 1437/38. In 1315 and 1316 the yield reductions exceeded 25 and 47 percent, respectively, and they exceeded 30 percent in 1349, 1350, and 1351, and also in 1437. The greatest yield reductions of all occurred in 1316 (47 percent), 1350 (47 percent), 1464 (46 percent, but based upon little data), and 1349–1351 (over 30 percent in all three years) and provide a yardstick against which all other serious shortfalls can be measured.Footnote 27 In climatically temperate England, this was as bad as it could get. The years 1315 and 1316 thus stand out as having witnessed the sharpest and deepest yield reduction during the period under review, with winter-sown wheat and rye exceptionally hard hit, and 1349–1351 the most prolonged, when, although wheat again fared worst, deficient crops of barley and oats greatly exacerbated the crisis.
Other things being equal, of course, the disastrous three- and four-year failure of 1349–1351/52 should have presented producers and consumers with a greater challenge of survival than the marginally more extreme two-year failure of 1315/16. That, paradoxically, this was not the case is brought out by the movement of prices and wages. Figures 3a and 3b plot the combined net yield per seed of W-B-O, a combined price for these same three grains (inverted and advanced one year to bring out the coincidental movement between yields and prices), and Clark's farmworker's real wage rate (also advanced one year). In a period notable for the variability of its yields, the pronounced back-to-back supply-side shocks of 1315/16 and 1349–1351 stand out clearly. Not only was the latter the more prolonged event, recovery from it was also slower, since it was not until the late 1370s that yields were restored to the levels recorded on the eve of the crisis.Footnote 28 Nevertheless, it was the harvest failure of 1315/16 which triggered by far the greater and more immediate price response, initiating an inflation of grain prices that was as unparalleled as it was unprecedented.Footnote 29 In contrast, even making allowance for the substantial reduction which had taken place in the amount of money in circulation, the price response to the 1349–1351 shortfall was slower and disproportionately slighter and it was not until the second successive serious failure that prices belatedly began to rise.Footnote 30
ENGLISH HARVESTS, GRAIN PRICES, AND FARMWORKERS’ REAL WAGES DURING THE CRISES OF 1315–1317, 1349–1351, AND 1437/38

During the earlier of these two crises, the scarce grain, reduced agricultural employment, and sky-high food prices had squeezed incomes of wage earners hard, and the real wage rate of English farmworkers sank to its lowest recorded point ever.Footnote 31 Excess mortality probably thinned the ranks of laborers, as is implied by the modest rise in nominal wages in the wake of the crisis.Footnote 32 Contemporary accounts leave no doubt that England and much of northern Europe were in the grip of dire famine.Footnote 33 In addition, all the classic economic symptoms of famine are observed during these grim years: rural credit arrangements collapsed triggering a wave of petty land sales, and many also traded parcels of land for food; crimes against property soared, as individuals were driven to seek food by any means; rural-to-urban migration increased in a desperate quest for food and alms; marriages were postponed for want of the means to establish new households; and there are clear signs that death rates rose.Footnote 34
That the consecutive harvest failures of 1315 and 1316 resulted in a genuine famine with great economic hardship and significant excess mortality is clear. Why, then, did the three-in-a-row failure of 1349–1351, so much greater in its cumulative incidence, not produce a subsistence crisis of similar or superior magnitude? The explanation lies in its coincidence with an even greater demand-side shock: the Black Death. In fact, the massive mortality of workers and managers—reckoned to have been in excess of 40 percent—is likely to have compounded the harvest failure and may well explain why on this occasion the cheaper spring grains of barley and oats together with peas and other legumes fared particularly badly, since priority was given to harvesting and threshing the more highly valued wheat.Footnote 35 Had this been an “ordinary” harvest failure—as in 1315/16 and again in 1437/38 (Figures 3A and 3B)—farmworkers’ real wages should have collapsed. Instead, in 1349 real wage rates rose dramatically and, paradoxically, remained high in 1350 notwithstanding a second consecutive bad harvest.Footnote 36 For the real wage rate of the most economically marginal group to have registered such striking gains during one of the worst back-to-back harvest failures on record highlights the unique nature of this, the greatest (in relative terms) of all major historical mortality crises. Famine on this occasion had been forestalled by plague, and the windfall economic gains bestowed upon survivors of the pandemic and its repeated visitations meant that it would be a long time before England's population would again be so vulnerable to harvest failure.
Although the Black Death is the most dramatic example of the capacity of epidemic disease to transform a potentially dire subsistence situation into a crisis of an entirely different nature and order, historically it is not unique.Footnote 37 On this occasion, however, the abject poverty of such a large proportion of the population clearly worsened the situation. Incomplete economic and nutritional recovery from the earlier back-to-back harvest failure of 1315–1317 and its ensuing cattle panzootics and Scottish raids further exacerbated the situation, especially in the worst affected regions.Footnote 38 It was fortunate, therefore, that the next serious back-to-back harvest failure of 1437/38 (Figure 3B) occurred at a time when population levels were low, poverty much reduced, and the purchasing power of wage earners substantially improved.Footnote 39 Once again, it was prevailing socioeconomic conditions which largely determined the impact of, and responses to, a major exogenously determined food-availability decline. Rural prosperity had certainly not granted immunity to the consequences of harvest failure but it greatly mitigated the hardship that resulted. It follows that the risk of serious famine was greatest at times of greatest economic austerity, as in 1315–1317 and 1349–1351.Footnote 40
DECLINING YIELD VARIABILITY OVER TIME?
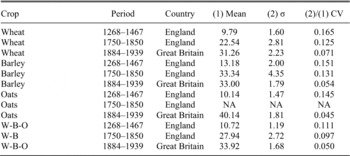
Did the high variability of medieval yields persist into modern times? The bottom panel of Table 2 above, which reports the likelihood of back-to-back deficits in 1750–1850, shows, that by the eighteenth century, things had changed. Table 3 addresses the question more directly, by comparing the coefficients of variation calculated on detrended annual series of gross wheat and barley yields for the three periods 1268–1467, 1750–1850, and 1884–1939, and the coefficients of variation of oats yields for 1268–1480 and 1884–1939.Footnote 41 Significantly, the table highlights a key unsung achievement of English farmers and their seed suppliers between the Middle Ages and the late eighteenth century. The reduction in the year-to-year variability of yields is substantial compared to 1268–1467, the coefficients of variation for wheat and barley are respectively a quarter and an eighth lower in 1750–1850. Unfortunately, the lack of intervening data means little can be said about the timing of the reduction in yield variability. Given that the medieval data employed here are “thicker” than those for 1750–1850 (Figure 1), the comparison, if anything, understates the achieved reduction in variability.
The claim that yield variability fell in the early modern era is not entirely novel. Over three decades, ago Hugues Neveux and Anne-Marie Tits-Dieuaide concluded, on the basis of an analysis of Flemish and southern English yields, that yield variability on the eve of World War II was only a third what it had been in the later Middle Ages.Footnote 42 Certainly, the range of solutions proposed in print to crop damage caused by rain, fungi, weeds, and pests grew from the sixteenth century onwards.Footnote 43 Fogel and Persson's claim that postmedieval technological change greatly improved grain yields but had little impact on their variability may therefore be incorrect.Footnote 44 On the evidence of Table 3, a modest lowering in the coefficient of variation of wheat yields from 0.165 between 1268–1467 to 0.125 between 1750–1850 would have meant a reduction from roughly 12 percent to 5 percent in the chance of harvests falling short in any year by a fifth or more.Footnote 45 The socioeconomic implications of such an improvement would have been significant. It likely also made a significant contribution to the postmedieval marked dampening down of price fluctuations and must be one of several reasons why famines in England became less common. Moreover, comparison with a corresponding set of coefficients calculated using national output statistics for the period 1884–1939 (Table 3) implies that yield variability declined further during the nineteenth century, although the differing construction of the two data sets may exaggerate the scale of that decline.Footnote 46
ENGLAND/GREAT BRITAIN, ANNUAL VARIATIONS IN GROSS GRAIN YIELDS

Notes:
The standard deviations were estimated after the chronologies had been detrended using the Hodrick-Prescott filter. CV is the coefficient of variation. W-B-O is a weighted average of wheat, barley, and oats yields, using the ratio 2:1:1. W-B is a weighted average of wheat and barley yields, using the ratio 1:1. The yield data are from Campbell, “Three Centuries;” Turner, Beckett, and Afton, Farm Production (the annual series have been reconstructed from original data supplied by the authors); and Mitchell, British Historical Statistics, pp. 90–91.
HARVESTS AND PRICES
Investigation of the relationship between proportionate harvest shortfalls and resultant increases in the price of grain began with Charles Davenant's celebrated table purporting to describe the market for wheat in seventeenth-century England.Footnote 47 The schedule implies a price elasticity of demand of −0.403.Footnote 48 Since Davenant lacked aggregate agricultural data to build upon, his table must be considered no more than at best an informed conjecture. Fogel, working from non-coterminous yield and price data has proposed a substantially lower elasticity figure of −0.183 for early modern England, from which he infers that very high prices in Europe in the early modern era did not result from huge harvest shortfalls. In the specific case of England, he concludes that “there does not appear to have been a single year after c.1500 in which aggregate supply of food was too low to avoid a subsistence crisis.”Footnote 49 He further buttressed his case for a low demand elasticity with demographic data from E. A. Wrigley and R. S. Schofield, which suggested that mortality in preindustrial England was high but not subject to large year-to-year fluctuations.Footnote 50 Since low elasticities meant that high prices were generated more by poor access to, than inadequate supplies of, grain, scope was left for public action to redistribute available food stocks. This led Fogel to argue (in the spirit of Amartya Sen's Poverty and Famines) that any major European subsistence crises and famines in the early modern era were less due to food-availability declines than to distributional deficiencies, including public inaction or misgovernance.
Rafael Barquin Gil has replicated Fogel's method and data and revised the result upwards to −0.36, which is fairly close to the value implied by Davenant.Footnote 51 Also using the same method but working from French and Swedish data, Persson has derived an even higher elasticity estimate of −0.6.Footnote 52 Price elasticities of this magnitude imply that serious harvest shortfalls were a reality in early modern Europe, and so resuscitate the historical significance of subsistence crises and rationalize the need for proactive public policy in a context where markets still functioned slowly and natural hazards sporadically had a major impact upon the output of staple foodstuffs.
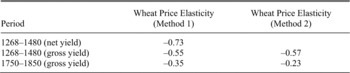
In late medieval England, price elasticities for wheat calculated using the data set of yields described above were even higher than those obtained by Persson and Barquin using postmedieval data. Thus, applying the elasticity measure (Method 1) ε = −δq/δp employed by Fogel [where ε is the price elasticity of demand, and the δs are the standard deviations of output (q) and price (p)] to the coefficients of variation of net wheat yield and price for the years 1268–1480 produces an elasticity estimate of −0.73 for wheat.Footnote 53 Using gross yields generates the lower value of −0.55 (Table 4).Footnote 54 These estimates are substantially above those based upon nineteenth-century Swedish and French data offered by Persson and higher, too, than Barquin's revised estimate for early modern/nineteenth-century Britain.Footnote 55 They also exceed an estimated elasticity of −0.35 obtained by applying the same method to Turner, Beckett, and Afton's gross wheat yield data for 1750–1850 (Table 4). In short, they imply that in preindustrial England at least price elasticities were far from constant and tended to decline over time.
A simple alternative method of calculating price elasticities when coterminous annual price and yield data exist may be obtained by estimating equation (Method 2): ln(qt) = a + bln(pt) where p and q are price and yield, a is a constant term, and b is the elasticity to be estimated.Footnote 56 Estimating this equation in first differences of ln(q) and ln(p) gives a very similar price elasticity of −0.57 for gross wheat yields, indicating that in the thirteenth and fourteenth centuries a doubling of wheat prices meant a harvest shortfall of somewhat less than one-half. These results are consistent with the evidence of the yield data, which confirm that in the worst harvests of all—in the case of wheat, 1316, 1339, 1349, 1350, 1351, 1420, 1438, and 1477—less than three-fifths the trend value of the net yield were returned. Such dismal harvests must have been felt throughout the economy and impacted in different ways upon all social classes. Breaking the data set at the Black Death (1349) reveals no striking difference between the two periods.Footnote 57
ENGLAND, 1268–1480 AND 1750–1850, ESTIMATED WHEAT PRICE ELASTICITIES OF DEMAND

Note:
The yield data are from Campbell, “Three Centuries;” and Turner, Beckett, and Afton, Farm Production; and the price data are from http://www.iisg.nl/hpw/data.php and Clark, “Long March of History.”
Method 1: ε = −δq/δp [for explanation, see the text]
Method 2: ln(qt) = a + b.ln(pt) [for explanation, see the text]
Applying the same formula to the Turner, Beckett, and Afton yield data set for the period 1750–1850 produces a much lower elasticity of −0.23. This is well below Davenant's estimate of −0.403 for the seventeenth century and lower too than Barquin's figure of −0.36 for the period 1540–1840. Rising living standards could help explain the reduced demand elasticity for a non-inferior good such as wheat. Fogel's elasticity formula implies that the reduction in crop yield variations discussed above would have operated in the same direction, but that an increase in market integration, by reducing price volatility, would have increased elasticities.Footnote 58
THE “ULTIMATE CHECK” IN PREINDUSTRIAL ENGLAND
Whereas England was haunted by famine in the Middle Ages, and was probably hit harder by the Great European Famine of 1315–1321 than any subsequent harvest crisis, it had already largely banished that specter by the time it embarked upon its Industrial Revolution and Malthus wrote his Essay.Footnote 59 What has usually been seen as England's last significant subsistence crisis was confined to the upland north-west of the country in the 1620s and had only a modest national demographic impact.Footnote 60 Yet a run of bad harvests again brought England to the brink of famine in 1647–1650 and a case can be made for the recurrence of genuine subsistence problems in both 1727–1729 and 1740–1742.Footnote 61 The latter, in fact, was the last occasion in English demographic history when a surplus of deaths over births produced a negative rate of population increase at a time of acute food scarcity. Marriage and birth rates, too, were depressed—a sure sign of economic hardship.Footnote 62 Thereafter, although extreme weather events recurred, England, and a growing number of European countries, remained effectively famine-free (with Ireland one of the last to join the club).Footnote 63 When, in 1800/01, at the height of the Napoleonic blockade and to the immense concern of the government, the English harvest failed and grain prices soared, no major mortality crisis ensued. Instead, the government's emergency measures, local poor relief, and voluntary fertility controls took most of the strain.Footnote 64
The eradication of famine was a signal achievement that contributed materially to the wellbeing of the humblest members of society. Why did it happen? It may have owed something to an exogenous dampening down of the environmental instability that had been such a feature of the fourteenth and fifteenth centuries during the transition from the Medieval Climate Anomaly to the Little Ice Age.Footnote 65 Human agency was also material, via the increasing capacities of governments, markets, welfare institutions, and society at large to cope with environmental hazards and their ensuing harvest shortfalls. The more effective functioning of grain markets, as a result of better arbitrage between markets and between good and bad years (a process in which governments themselves were active agents), is well documented, and consistent with the halving in the magnitude of year-to-year variations in the price of wheat which took place between the fourteenth and nineteenth centuries in England, paralleling a similar secular reduction elsewhere in much of western Europe.Footnote 66 Year-on-year price changes (measured as absolute values) averaged about 25 percent during the thirteenth and fourteenth centuries, declined to 15–16 percent in the following two centuries, and eventually shrank to 13 percent between the seventeenth and nineteenth centuries.Footnote 67 Impressively, much of this was achieved before, first, the canal and, then, the railway and steamship revolutions transformed the economics of transporting and transshipping grain in bulk.
Lower interest rates, by reducing the costs of storage and thereby encouraging larger carryovers, probably aided and abetted the effects of growing market efficiency.Footnote 68 Adoption, at the instigation of central government, of a nationwide system of public poor relief following the run of bad harvests in the 1590s must also have helped to alleviate distribution problems and protect the food entitlements of the most vulnerable members of English society during crises.Footnote 69 Very likely this had the secondary benefit in years of acute scarcity of restraining the pressure on food prices that would otherwise have arisen from inelastic demand. The lack of any pronounced upward demographic dynamic between 1650 and 1750 may also have taken some of the heat out of annual grain price variations, a development reinforced by the rising productivity of domestic agriculture manifest in England's emergence after 1700 as a net grain exporter on a significant scale.Footnote 70 The result of these changes was reduced sensitivity of prices to harvests. The magnitude of grain price variations during the “cold” seventeenth century was significantly less than that during the “unstable” fourteenth century, and during the eighteenth and nineteenth centuries it fell still further.Footnote 71
These changes are reflected in the reduction in grain price elasticities documented in this study. Because genuine food-availability declines long remained an inescapable agronomic fact of life, preindustrial European price elasticities of grain were not low. In fact, they were 50 percent higher than in England in the era of the Industrial Revolution and twice or three times as high as at the end of the nineteenth century. Progressively and with gathering momentum, reduced storage costs and better access to foreign grain markets had reduced the response of prices to domestic harvest shocks. Given that wheat was not an “inferior” good (in the economic sense), any ensuing increase in incomes will also have reduced demand elasticity. However, the reduction was not all due to improved market integration. This article has also drawn attention to another reason why the risk of famine fell: a reduction in the annual variability of grain harvests. A decline in yield variability of the order indicated above—one-quarter or so between the fourteenth and eighteenth centuries (Table 3)—would have reduced the elasticity of demand by about the same amount. It remains to be established how precisely this was achieved but most likely it was linked to increased specialization according to comparative advantage by individual producers combined with the biological innovation of selecting and sowing sounder seed.Footnote 72 Through trial and error and a process of social learning, farmers somehow succeeded in limiting the variability of harvests and, thus, the magnitude of annual price variations.Footnote 73
From the seventeenth century on, major harvest shortfalls in England gradually ceased to present a serious economic and demographic threat and became more a source of public disorder than of excess mortality. The frequent “moral economy” food riots of this later period arose in large part from the growing share of English households lacking any direct involvement in food production and reflected temporary scarcities rather than imminent famine. Agitation, once quelled, was usually accompanied by concessions and conciliation. Meanwhile, a combination of economic development, better governance, and, perhaps, biological innovation were making subsistence more secure. It was paradoxical, therefore, that, as the threat of genuine famine receded, harvest shortfalls grew to assume an importance to civil authorities and political representatives that they had never possessed during the far hungrier Middle Ages.Footnote 74