


Introduction
The Greenland ice sheet is losing mass at rates of 150– 250 Gt a–1 (Reference Rignot, Box, Burgess and HannaRignot and others, 2008; Reference Van den BroekeVan den Broeke and others, 2009) and there is growing concern that this rate will increase because of climate change (Reference SolomonSolomon and others, 2007). Fuelling these concerns are mass budget estimates showing a decreasing trend of the surface mass balance (–13 Gt a–2) due to a steady increase in surface runoff, as well as increasing discharge of ice to the ocean (9.0 Gt a–2) by ocean-terminating outlet glaciers (Reference Rignot, Velicogna, Van den Broeke, Monaghan and LenaertsRignot and others, 2011). Increased runoff is directly related to atmospheric forcing (Reference Ettema, Van den Broeke, Van Meijgaard, Van de Berg, Box and SteffenEttema and others, 2010), and there is good overall consistency between estimates of runoff from different types of models (Reference BougamontBougamont and others, 2007). The quantity of ice discharged to the ocean through fjord-terminating outlet glaciers, i.e. tidewater glaciers, varies less than runoff, but is problematic because glacier dynamics affect the mass budget of ice sheets on timescales ranging from years to many decades (Reference Price, Payne, Howat and SmithPrice and others, 2011).
Kangerdlugssuaq Glacier (KG), East Greenland, is one of the largest tidewater glacier systems in the world. During its well-documented retreat of 7 km between July 2004 and April 2005 (Reference JoughinJoughin and others, 2008a; Reference Seale, Christoffersen, Mugford and O’LearySeale and others, 2011), the glacier doubled its speed from 20 md–1 to 40 md–1 (Reference Luckman, Murray, de Lange and HannaLuckman and others, 2006; Reference Howat, Joughin and ScambosHowat and others, 2007). This speed change resulted in a loss of 80 Gt of ice between September 2004 and January 2008 (Reference Howat, Ahn, Joughin, Van den Broeke, Lenaerts and SmithHowat and others, 2011). This is ~350% higher than the loss would have been if it had occurred at the pre-retreat rate (~6.5 Gt a–1). Although net annual losses returned to lower rates after 2008 (~10 Gt a–1), the immediate loss is only the beginning of the ice sheet’s dynamical contribution to higher sea levels. Reference Price, Payne, Howat and SmithPrice and others (2011) show that by 2100 the long-term mass loss from slow diffusive thinning could be three times that of the glacier’s immediate response.
The abrupt retreat of KG and other Greenlandic tidewater glaciers during the last decade was first thought to be due to increased runoff caused by atmospheric warming (Reference Rignot and KanagaratnamRignot and Kanagaratnam, 2006). But whereas air temperature and ice-sheet runoff continued to increase in the 2000s, the glaciers have been more stably positioned since 2005 (Reference Howat, Joughin and ScambosHowat and others, 2007; Reference MurrayMurray and others, 2010). The dynamic change is now thought to be due to subtropical waters, flowing into fjords via coastal currents. Reference StraneoStraneo and others (2010) show that circulation in Sermilik Fjord is strongly influenced by high wind speed during intermittent storms. Reference ChristoffersenChristoffersen and others (2011) show that winds are also important on a synoptic scale and that the position of the Icelandic low, a semi-permanent atmospheric low-pressure system in the North Atlantic, has a strong effect on the transport of subtropical water towards Greenland.
Although the transport of subtropical waters into Greenland fjords is far from simple, a characteristic behaviour is seen in the recent widespread change of Greenlandic tidewater glaciers. Reference Seale, Christoffersen, Mugford and O’LearySeale and others (2011) show that glaciers flowing into East Greenland fjords south of 69˚N experienced widespread retreat in 2000–05, whereas glaciers in fjords north of this latitude experienced little or no retreat during the same period. This relatively sharp boundary of glaciological behaviour is not related to atmospheric conditions, but to the presence (south) and absence (north) of warm subtropical water from the Irminger Sea.
Here we use the well-documented retreat of KG in 2004/ 05 and observations from within and near KF to partition effects from the glacier’s interactions with atmosphere and ocean. Although the retreat occurred when the fjord contained relatively warm water, we document warmer properties in a previous year when the glacier remained relatively unchanged. While flow of subtropical waters into fjords provides a setting in which rapid glacier retreat can occur, the triggering of retreat seems to depend on additional factors. The climatic factors that stand out are air temperature and katabatic winds during winter months. We show that proglacial ice melange was absent during the retreat and that the fjord did not freeze-up until 11 April 2005 because of warm and windy conditions. The exposure to open water prolonged the period when calving occurs at a high rate, resulting in significant retreat, speed-up and intensified interaction with fjord waters.
Kangerdlugssuaq Fjord
Environment and setting
Kangerdlugssuaq Fjord (KF) is 70 km long and 5–10km wide (Fig. 1). Water depths range from 450m over a sill 10 km from KG’s calving front to 870m near the mouth (68.1˚ N, 31.9˚ W) (Reference Dowdeswell, Evans and Ó CofaighDowdeswell and others, 2010). Icebergs are the main freshwater source in the fjord due to the high rate of discharge from KG, currently ~30 Gt a–1 (Reference Howat, Ahn, Joughin, Van den Broeke, Lenaerts and SmithHowat and others, 2011). The fjord is typically ice-free between July and December, and ice-covered from January to June. An area extending ~5 km from the front of KG comprises a semipersistent melange of icebergs and shore-fast sea ice known as sikussak (Fig. 1c) (Reference Syvitski, Andrews and DowdeswellSyvitski and others, 1996; Reference Dowdeswell, Evans and Ó CofaighDowdeswell and others, 2010).
(a) Potential temperature profiles from conductivity– temperature–depth measurements in upper KF. Blue, green and red lines denote measurements from 1991, 1993 and 2004, respectively. (b) Plot showing potential temperature and salinity of water masses. PSW is polar surface water, PSWw is warm polar surface water, AW is Atlantic water and RAW is recirculating Atlantic water. Colour denotation is identical to (a). Numbers 20– 28 refer to σt = (ρ – 1000) kgm–3 where ρ is density. (c) Landsat image from 16 August 2002 showing KG and its proglacial sikussak (S). The coloured dots show approximate station locations for measurements shown in (a) and (b). White box outlines subset of MODIS scenes shown in Figure 4.

Fjord waters
The bathymetry of KF and the properties of fjord waters have been established from scientific cruises in September 1993 (Reference Azetsu-Scott and SyvitskiAzetsu-Scott and Syvitski, 1999) and September 2004 (Reference Dowdeswell, Evans and Ó CofaighDowdeswell and others, 2010; Reference ChristoffersenChristoffersen and others, 2011). Here we use these datasets together with additional data from an earlier cruise in September 1991 (Reference Andrews, Milliman, Jennings, Rynes and DwyerAndrews and others, 1994). Two important water masses inside the fjord are polar surface water (PSW) and subtropical Atlantic water (AW) (Fig. 1), with properties governed by the corresponding water masses found in the East Greenland Current and the Irminger Sea (Reference Sutherland and PickartSutherland and Pickart, 2008). PSW in the upper fjord has low salinity (S < 32 psu) but variable temperature. The potential temperature, θ, was up to 1.3˚C in 1991 and up to 2.8˚C in 2004, therefore falling into the category referred to as ‘warm’ PSW (PSWw) (Reference Rudels, Fahrbach, Meincke, Budéus and ErikssonRudels and others, 2002). PSW in 1993 was fresh as well as cold (–1.5˚C) (Fig. 1a). The salinity, S, of AW is high (S~34.9 psu), and potential temperature in the upper fjord was ~1.8˚C in 1991 and ~1.5˚C in 2004. AW in 1993 was colder (<1.1˚C), suggesting it was recirculating AW from the Nordic Seas, i.e. RAW when using the water mass class of Reference Rudels, Fahrbach, Meincke, Budéus and ErikssonRudels and others (2002), rather than the warmer AW from the Irminger Sea. The θ–S composition of the different water masses is shown in Figure 1b.
A third important water mass is the deeper ambient fjord water, which was warm in 1991 (θ ~1.4˚C) relative to 1993 as well as 2004 (Fig. 1). The temperature difference of <0.4˚C suggests more vigorous mixing with AW or that it was formed by warm AW from the Irminger Sea rather than the colder RAW.
Atmospheric conditions
The atmospheric conditions in KF are seen in the station record from Aputiteq at the western side of KF mouth, ~80 km from KG (see Fig. 1c for location). Figure 2 shows mean monthly air temperature in 1987–2008, together with seasonal averages for the extended summer (June–September) and winter (December–March) periods. The extended periods are used because the inclusion of June and March helps identify summer and winter characteristics. Although the temperature record from Aputiteq is not complete, we use it because of its close proximity to KF and KG. To fill the missing data points, we use surface air temperature from the equivalent location in the European Centre for Medium-Range Weather Forecasts Interim Re-analysis (ERA-Interim) climatology (Reference Simmons, Uppala, Dee and KobayashiSimmons and others, 2006) (Fig. 2). A good correlation (r = 0.92) for the overlapping data (n = 182) shows that this procedure is satisfactory (data not shown). Between 1997 and 2008, mean summer temperatures increased gradually from –1.3˚C below the period mean (~2.0˚C) to an anomaly of +1.2˚C. The mean winter air temperature differs in that two very large peaks occurred: one in 2002/03 (+4.3˚C), the other in 2004/05 (+3.1˚C).
Plot showing changes in the position of KG’s calving front (open blue circles); mean monthly air temperature, as measured in Aputiteq (solid black dots) or as represented in the ERA-Interim climatology (black asterisk); and runoff in the KG drainage basin (open red circles). The bold blue line shows the 12 month moving average of mean monthly frontal positions; the thin dashed line in black shows mean summer air temperatures averaged for June–September; and the bold dashed line in black shows mean winter air temperatures averaged for December–March.
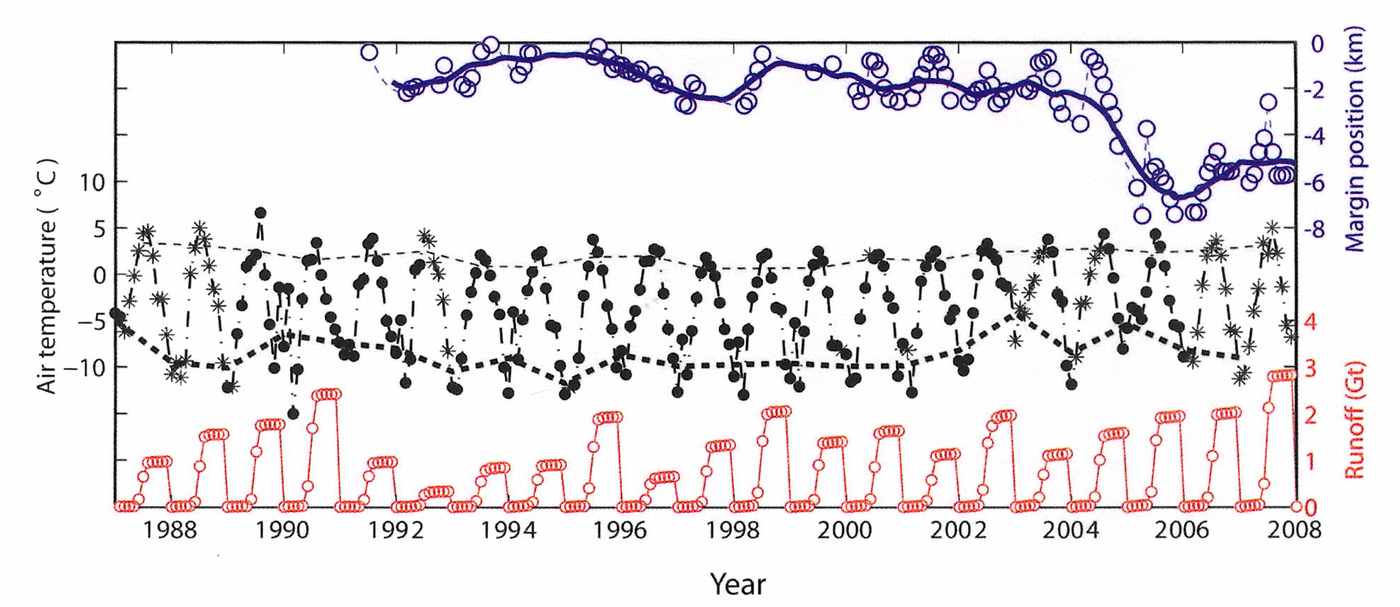
Melting of ice is controlled by the surface energy budget and not simply air temperature. We therefore calculate the cumulative runoff in the Kangerdlugssuaq drainage basin using outcomes from the RACMO2.1/GR regional atmospheric climate model, adapted from the Royal Netherlands Meteorological Institute (KNMI) regional climate model RACMO2.1 (Reference Van MeijgaardVan Meijgaard and others, 2008) and extended with a multilayer snow model to better represent the conditions on Greenland (Reference Ettema, Van den Broeke, Van Meijgaard, Van de Berg, Box and SteffenEttema and others, 2010). The runoff was very close to the period mean in 2004, when KG started its rapid retreat (Fig. 2).
Ice/Ocean Interactions
An explicit cause of the KG retreat is not found in the runoff calculated in RACMO. This implies that retreat did not occur because surface meltwater production was high (as shown earlier by Reference Luckman, Murray, de Lange and HannaLuckman and others, 2006). Furthermore, the hydrographic data from 1991 show that the presence of warm water in KF does not necessarily result in a rapid glaciological response. The lack of response of KG to warm fjord conditions in 1991 is corroborated by a Landsat image acquired on 21 June 1991 (Fig. 2) and other Landsat scenes dating back to 1978 (Reference DwyerDwyer, 1995). The climatic variable that stands out during the retreat is the mean winter air temperature in 2004/05, which was the second highest anomaly in the period investigated (1987–2008). While warm AW in fjords clearly provides a setting in which rapid retreat can occur, the retreat of KG may have occurred because warm atmospheric conditions intensified the interaction between the glacier and the fjord waters. Below we discuss this further.
The atmospheric effect
The atmospheric conditions near KF in 2004/05 are seen in Figure 3 together with the front position of KG during its prolonged retreat. The warm surface conditions during the retreat, which started in July 2004 and lasted 10 months, are clearly visible as an increasing trend in air temperature between December 2004 and March 2005. The daily mean temperature occasionally exceeded 0˚C during this warm winter. The temperature anomaly is ~2σ and therefore unusual. The retreat was unusual, not because it was fast (the rate of retreat was similar to other years), but because it lasted 10 months and continued throughout the winter months (December–March) and well into April 2005 (Reference JoughinJoughin and others, 2008a), i.e. it was prolonged compared to other years. The transition from retreat to advance typically occurs in January or February (Reference Luckman, Murray, de Lange and HannaLuckman and others, 2006; personal communication from A. Luckman, 2011).
Plot showing variation in daily air temperature in Aputiteq (solid red line) and positions of KG’s calving ice front during the retreat in 2004/05 (open black circles), as seen in daily MODIS imagery. Data are plotted from April to next March.
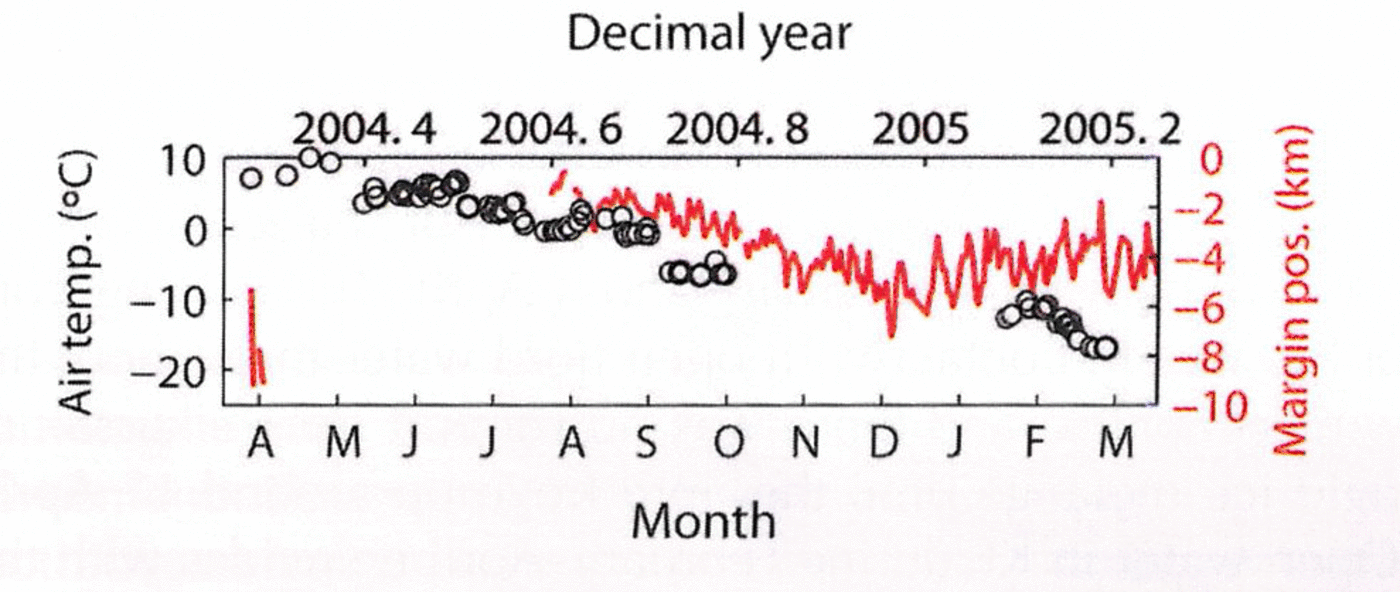
The margin positions shown in Figure 3 were derived from an automated method utilizing the high (daily) temporal resolution of Moderate Resolution Imaging Spectroradiometer (MODIS) imagery (Reference Seale, Christoffersen, Mugford and O’LearySeale and others, 2011). Subsets of MODIS scenes illustrating sea-ice conditions in KF are shown in Figure 4. The image sequence shows that sea-ice conditions in February–April 2005 were unusual relative to other years in the MODIS record. The fjord is typically covered by shore-fast sea ice in February, when solar illumination returns after a blackout period. In 2005, however, there was an absence of sea ice and even sikussak between 4 February and 4 April. The calving front of KG was in contact with open fjord water throughout the winter months, and there was no support from sikussak or rigid ice melange until the fjord froze up around 11 April. Open water in KF during February–April coincides with the retreat of KG and is, as far as we know, a rare occurrence.
Subsets of MODIS scenes illustrating sea-ice conditions in KF. The image sequence shows that freeze-up in the fjord typically takes place prior to the return of solar illumination in February. The exception is winter 2004/05, when freeze-up did not occur until 11 April 2005. Solid white lines outline coastal polynya in front of KG. ‘S’ denotes effect of shadow. An animation of the MODIS subset is available in the auxiliary material of Reference Seale, Christoffersen, Mugford and O’LearySeale and others (2011).

The two principal factors governing the formation of polynya in regions of shore-fast sea ice are air temperature and wind speed. We have already shown that the mean winter air temperature anomaly in 2004/05 was positive and high (+3.1˚C). This seasonal anomaly is primarily a result of very warm atmospheric conditions in February and March 2005, when the anomaly exceeded +5˚C. (December 2004 was cold relative to the December mean.) Because February and March is the main period of sea-ice formation and because the monthly anomaly was high relative to the monthly means (–8 to –9˚C), we expect that a decreased rate of sea-ice formation from high air temperature contributed to the formation of the proglacial polynya.
The second factor responsible for polynya formation is wind speed, and our data show that winds may also have influenced the polynya in front of KG. Figure 5 shows 10 m winds from RACMO2.1/GR averaged from December to March. The seasonally averaged wind speeds in 2004/05 are ~4ms–1 in KF and up to ~8ms–1 over the upper part of KG. The directional constancy is close to 1, which indicates that winds are governed almost exclusively by the katabatic pressure gradient force, which is strong in winter due to surface cooling and the absence of solar radiation (Reference Van Angelen, Van den Broeke and Van de BergVan Angelen and others, 2011). The katabatic winds were much weaker in 2002/03 (Fig. 5), the only other winter in our record with higher air-temperature anomaly (+4.3˚C). This may explain why a coastal polynya did not form at this point in time. In winter 1991/92, when warm water was also present in the fjord, the mean air temperature was +1.1˚C, but runoff reached only 0.97 Gt, compared to 1.6 Gt in 2004. The katabatic winds during this winter were furthermore weak (Fig. 5).
Maps showing direction and speed of 10m winds from RACMO2.1/GR when averaged from December to March in 1991/92 (left), 2002/03 (middle) and 2004/05 (right). The winds are predominantly katabatic, and the strongest katabatic pressure gradient force is found over KG.

The glaciological effect
We have shown that warm atmospheric conditions and strong winds in winter 2004/05 caused open water to form in front of KG, and that prolonged retreat, lasting until April 2005, occurred under this unusual condition. Previous studies show that seasonal strengthening of sikussak or ice melange may suppress the calving rate (Reference Reeh, Thomsen, Higgins and WeidickReeh and others, 2001), helping tidewater glaciers to advance in winter (Reference Sohn, Jezek and Van der VeenSohn and others, 1998; Reference JoughinJoughin and others, 2008a; Reference Amundson, Fahnestock, Truffer, Brown, Lüthi and MotykaAmundson and others, 2010). For Jakobshavn Isbræ, this advance is accompanied by reduced speeds due to changes in geometry and stress distribution, with the additional effect of increasing friction along the fjord side-walls (Reference JoughinJoughin and others, 2008b; Reference Amundson, Fahnestock, Truffer, Brown, Lüthi and MotykaAmundson and others, 2010). The advance and retreat of other glaciers in West Greenland show similar correspondence to proglacial sea-ice conditions (Reference Howat, Box, Ahn, Herrington and McFaddenHowat and others, 2010). The same but opposite effect may explain why KG doubled its speed in 2004/05, when a prolonged period of active calving caused the front to retreat by 7 km (Fig. 3). While this inferred mechanical influence of rigid proglacial ice melange on calving is consistent with previous studies, it does not explain why significant calving retreat occurred mainly in a region where fjords contain warm AW (Reference Seale, Christoffersen, Mugford and O’LearySeale and others, 2011). The latter implies an interaction with fjord waters.
The link between KG and the ocean during its retreat may lie in a large input of subglacial meltwater to the proglacial environment, as speed-up caused increased frictional heating at the bed. Since the speed-up occurred in winter, this additional water would have entered the fjord when the basal water system did not carry surface meltwater. Very little is known about the basal environment of KG, but a simple calculation of the basal heat budget based on information from similar glaciers nonetheless indicates that a large meltwater volume was produced by the speed change. The basal heat budget is G + τU – K∂T/∂z – ρṁ L = 0, where G is the geothermal heat flux; the second term is frictional heat, calculated from basal drag, τ, and velocity, U; the third term is the conductive heat loss, calculated from basal ice temperature gradient, ∂T/∂z, and the thermal conductivity of ice, K; and the fourth term is latent heat of fusion, calculated from ice density, ρ, the basal melt rate, ṁ , and the coefficient for latent heat of fusion, L (Reference Christoffersen and TulaczykChristoffersen and Tulaczyk, 2003). The basal drag of KG is not known, so we assume it is of similar magnitude to the drag calculated for Jakobshavn Isbræ, ~200 kPa (Reference Iken, Echelmeyer and Harrison Wand FunkIken and others, 1993; Reference Funk, Echelmeyer and IkenFunk and others, 1994). With speeds ~20md–1 or higher, frictional heat would be around two orders of magnitude higher than G as well as K∂T/∂z, suggesting that τU= ρṁ L is a reasonable approximation of the heat budget. Basal melting up to several metres per year may have occurred beneath the lower part of the glacier where the speed is highest, and, with speed change occurring over a distance of >30 km (Howat and others, 2007), increased frictional heating could have increased the discharge of basal melt-water by ~1km3 a–1 when speeds peaked.
There are two ways in which meltwater from increased frictional heating could have affected the flow and dynamics of KG. The first is an increase in basal lubrication, and the second is an increase of calving in response to plume-induced ice-front melting. Reference Nick, Vieli, Howat and JoughinNick and others (2009) show that the speed change of Helheim Glacier in 2000–05 is consistent with a prescribed retreat of the calving ice front rather than basal lubrication, so we assume that the latter is more likely. To illustrate this, we use melt estimates based on a simple convection-driven model of plume flow and velocity-based parameterizations of melt similar to those underneath Antarctic ice shelves (Reference Jenkins, Nicholls and CorrJenkins and others, 2010). A full description of this model is beyond the scope of this study. We therefore refer to Reference O’LearyO’Leary (2011) who shows that this model can be applied to tidewater glacier fronts, yielding results consistent with observations from West Greenland. These melt rates include strong dependencies on both ocean temperature and stratification. The flux of water in the subglacial water system beneath the glacier is also important, as shown by Reference JenkinsJenkins (2011), as the rate of frontal melting has a cube-root dependence on the subglacial discharge to the fjord. Here we apply a model similar to that used by Reference JenkinsJenkins (2011) to KG, assuming that its ice front is ~600m high. Using hydrographic data from 1991, 1993 and 2004, as shown in Figure 1, and runoff, as shown in Figure 6a, we estimate plume-induced ice-front melting at rates up to 3md–1 in the melt season (Fig. 6b). When frictional melting beneath the glacier is excluded, the melt rate on the ice front drops to low values in winter months, when runoff does not feed the subglacial water system. We find the highest melt rate in July 1991 because fjord waters at depths greater than 400m were 0.4˚C warmer than in 1993 and 2004 (Fig. 6b). The melt rate in July 2004 is nevertheless almost as high because runoff in July 2004 was 0.80 Gt compared to 0.42 Gt in July 1993 and 0.51 Gt in July 1991 (Fig. 6a).
Plots showing (a) runoff in the Kangerdlugssuaq drainage basin from RACMO2.1/GR, (b) maximum rates of ice-front melting calculated with plume model, and (c) depth of plume when reaching neutral buoyancy with ambient fjord water. Blue, green and red dots mark data for 1991, 1993 and 2004, respectively. Data are plotted from April to next March.
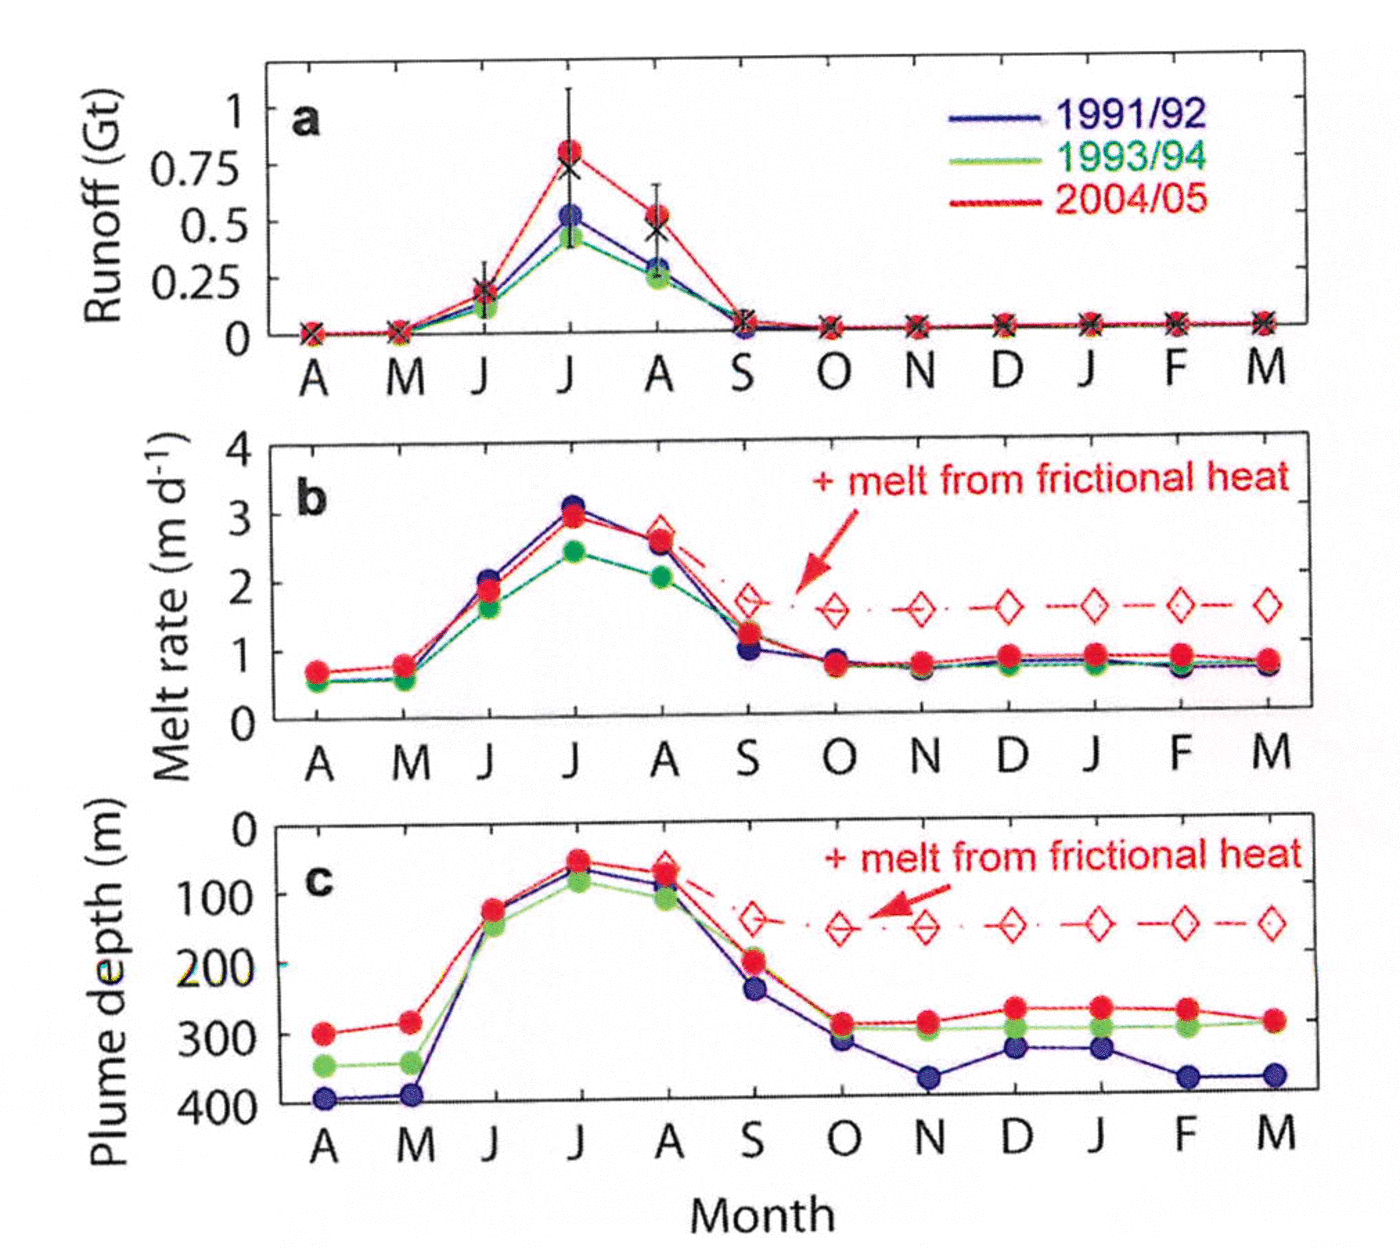
When melting from frictional heat released during the speed-up is included in the model, we find little effect in summer months because the flux of meltwater from the basal water system is already high due to runoff. The effect is proportionally higher in winter, when runoff is nil. With frictional meltwater added, the winter melt rate doubles from ~0.7md–1 to ~1.5md–1 (Fig. 6b). We also find that the plume becomes substantially more buoyant when frictional basal melting is included. The depth of neutral buoyancy with the surrounding fjord water increases from >280m to <160m (Fig. 6c). The speed-up of KG due to its retreat may thus have prolonged the period of strong ice/ ocean interactions.
Summary and Conclusions
The flow of tidewater glaciers in Greenland is influenced by ocean as well as atmosphere, but the significance of these forcings relative to each other is not well understood. Furthermore, whereas tidewater glaciers according to the classic theory should respond to climate change through the alteration of mass balance, i.e. indirectly, the Greenland-type tidewater glacier differs in that it responds sensitively to external forcing. The sudden increase in discharge from Greenland tidewater glaciers in the early 2000s was originally thought to be a response to atmospheric warming, which was sustained in the southeast where many glaciers retreated (Reference Rignot, Braaten, Gogineni, Krabill and McConnellRignot and others, 2004; Reference Howat, Joughin, Fahnestock, Smith and ScambosHowat and others, 2008; Reference MurrayMurray and others, 2010). Recent studies have shown that this region is also influenced by warm subtropical waters, entering coastal currents and fjords after transportation to the Irminger Sea from the Atlantic (Reference Holland, Thomas, de Young, Ribergaard and LyberthHolland and others, 2008; Reference MurrayMurray and others, 2010; Reference ChristoffersenChristoffersen and others, 2011; Reference Seale, Christoffersen, Mugford and O’LearySeale and others, 2011).
The widespread recent retreat of tidewater glaciers in Greenland offers a window of opportunity to identify the relevant environmental forcing. While warm subsurface conditions in KF were a significant factor in the retreat of KG (Reference ChristoffersenChristoffersen and others, 2011), additional data show that KG remained relatively unaffected by warm subsurface conditions in 1991. The driver of warm subsurface conditions in 1991 is the same as that causing warm subsurface conditions in 2004, i.e. a western position of the Icelandic low, inducing weak northeasterly airflow along East Greenland and inflows of AW from the Irminger Sea towards the coast (Reference ChristoffersenChristoffersen and others, 2011). The cold subsurface conditions in 1993 were a consequence of colder and stronger winds from the northeast, occurring when the Icelandic low has an eastern position. Periods when synoptic atmospheric conditions in the North Atlantic caused coastal warming offshore of KF include 1985–87, 1991–92, 1996 and 2001–06 (Reference ChristoffersenChristoffersen and others, 2011).
The warm subsurface conditions observed in KF in 1991 show that tidewater glaciers do not necessarily retreat when fjords are warm. We therefore contend that while warm AW in fjords provides a setting in which rapid glacial retreat can occur, the triggering of retreats depends on additional factors. The climatic factors that stand out in this study of KG and KF are winter air temperature and katabatic winds, which both have strong positive anomalies when averaged from December 2004 to March 2005, the period when KG retreated by more than twice its seasonal average. Satellite images show that freeze-up of the fjord did not occur until 11 April 2005, which is about 3 months later than any other year examined. We attribute the ice-free condition to (1) reduced sea-ice production due to mild air temperature, and (2) transport of sea ice away from the calving front by strong katabatic winds.
We have shown that a plume fed by ice-sheet runoff should melt the front of KG at rates up to 3 md–1, but this rate should drop to small values in winter, when the subglacial drainage system does not carry surface meltwater. However, the plume may have remained active in winter 2004/05, with melt rates around half those in summer, due to meltwater produced by frictional heating associated with the glacier's speed-up. The latter occurred because the calving front retreated, as demonstrated by Reference Nick, Vieli, Howat and JoughinNick and others' (2009) modelling of Helheim Glacier, and the retreat was a result of ice-free conditions, which prolonged the period of fast calving and strong ice/ocean interactions.
Our study of KG and KF implies that tidewater glaciers in Greenland may respond sensitively to the combined effect of oceanic and atmospheric warming. Whereas the ocean effect is modulated by the North Atlantic Oscillation (NAO; Reference Holland, Thomas, de Young, Ribergaard and LyberthHolland and others, 2008; Reference ChristoffersenChristoffersen and others, 2011), a recurring regional pattern of atmospheric variability, the latter is directly related to climate change. We conclude by hypothesizing that tidewater glaciers will become (or have become) more sensitive to warming of fjords after periods of weak NAO because atmospheric warming is intensifying and prolonging their interactions with fjord waters. A potentially important aspect not included in this study is the long-term effect of mass imbalance. Reference ThomasThomas and others (2000) report thinning of KG by ~50m in 1995–98, and Reference Howat, Ahn, Joughin, Van den Broeke, Lenaerts and SmithHowat and others (2011) show that the glacier was losing mass at a rate of ~6.5 Gt a–1 in 2000. It is possible that thinning in the 1990s and early 2000s caused the ice front to become less stable and more susceptible to retreat.
Acknowledgements
This study was funded by research grant NE/G00692X/1 awarded by the UK Natural Environment Research Council. The authors are grateful to the scientific editor, Ted Scambos, and two anonymous reviewers.



