Infectious diarrhea is an intestinal infectious disease with the main clinical characteristics of diarrhea (3 or more daily bowel movements and abnormal fecal traits), accompanied by nausea, vomiting, abdominal pain, fever, loss of appetite or general discomfort. 1 It can be caused by a variety of bacterial, viral and parasitic organisms. 2 The total number of deaths from diarrhea was 1.57 million in 2017, at a rate of 21.6 deaths per 100000, with deaths showing an increase of 15.0% for adults older than 70 years. In 2017, the estimated years of life lost (YLLs) of diarrhea was 1009.1 per 100000, ranked fifth in terms of total YLLs. 3
In recent years, the relationship between meteorological factors and infectious diseases has received attention. Meteorological factors such as temperature, relative humidity, and rainfall are linked to the replication, persistence, and transmission of pathogens in the environment, and are considered to be closely related to the spread of infectious diseases. Reference Rajtar, Majek, Polański and Polz-Dacewicz4-Reference Lowen, Mubareka, Steel and Palese6 Infectious diarrhea occurrence in humans also displays strong seasonal patterns. Reference Chao, Roose, Roh, Kotloff and Proctor7 Provinces of China in intermediate latitudes, demonstrate that the prevalence of infectious diarrhea usually has 2 peaks; autumn-winter and spring are the high incidence periods of viral diarrhea, while summer is the high incidence period of bacterial infectious diarrhea. Reference Guang, Sha, Feng, Qianqian and Yong8,Reference Tan, Zhang and Xu9
Available research in this area has focused mainly on the relationship between bacterial dysentery and meteorological factors, Reference Hao, Liao and Ma10,Reference Wen, Zhao and Cheng11 however despite the availability of a few studies exploring the relationship between infectious diarrhea caused by a single pathogen such as norovirus, rotavirus and meteorological factors, Reference Wang, Goggins and Chan12 other studies used models that could not reflect the lag effect. Reference Fang, Ai and Liu13,Reference Azage, Kumie, Worku and Bagtzoglou14 There is therefore, limited understanding of the relationship, especially the exposure-lag response, between the infectious diarrhea caused by pathogens other than parasites, and meteorological factors. In view of the current disease burden and deficiencies of research on infectious diarrhea, we introduce the distributed lag non-linear model (DLNM) to illuminate the influence of temperature on infectious diarrhea and diarrhea-like illness, based on the surveillance and laboratory data from 2013 to 2018 in Wuxi, China.
Wuxi is a prefecture-level city in Jiangsu province, which is located in the middle of China, with an area of 4627.47 km2 and a resident population of approximately 6.57 million people in late 2018. Wuxi has 5 administrative districts and 2 county-level cities. It belongs to the north humid subtropical monsoon climate zone, with 4 distinct seasons, sufficient heat, abundant rainfall, and rain and heat in the same season. 15
METHODS
Data Sources
According to the comprehensive monitoring program for infectious diarrhea in Jiangsu province (2018 edition), diarrhea-like illness cases are defined as an increase in the number of daily stool movements (children aged 1 and over, adolescents and adults: ≥ 3 times/day, babies breastfed within 6 months: ≥ 6 times/day, infants artificially fed within 6 months and infants between 6 months and 1 year old: ≥ 4 times/day), accompanied by changes in stool characteristics, such as loose stool and watery stool. Diarrhea-like illness cases are reported weekly through a monitoring system by the sentinel hospitals. At least 40 stool specimens are collected monthly from the sentinel hospitals, with priority given to cases who have not been treated with antibiotics.
We collected the time series daily data from 2013 to 2018, including diarrhea-like illness cases from the monitoring system, and average ambient temperature, relative humidity and rainfall from Wuxi Meteorological Service Center. Diarrhea-like illness case data were standardized based on diarrhea-like illness cases per 10000 outpatient visits.
DATA ANALYSIS
A quasi-Poisson generalized linear model combined with a distributed lag non-linear model (DLNM) was applied to explore the potential exposure-lag response association between diarrhea-like illness cases, positive bacteria and virus cases and daily average ambient temperature. The modeling framework was based on the definition of a cross-basis, which defined the conventional exposure-response relationship and the additional lag-response relationship respectively. Reference Gasparrini, Guo and Hashizume16 Relative humidity and rainfall as the potential confounders, which were reported as the predominant environmental factors on survival of the enterovirus, Reference Rajtar, Majek, Polański and Polz-Dacewicz4 were introduced into the model. The final model was:
 $$\displaylines{
Log\left[ {E\left( {Yt} \right)} \right] = \alpha + cb\left( {Tmean{\rm{,}}\;lag} \right) + ns\left( {Humt{\rm{,}}\;df} \right) \cr
+ ns\left( {Rainfallt,\;df} \right) + ns\left( {Timet{\rm{,}}\,{7 \over {year}}} \right) + \gamma Dowt \cr} $$
Where Yt respectively denoted the reported daily proportion of diarrhea-like illness cases, bacterial positive rate, virus positive rate and norovirus positive rate at day t; cb(Tmean, lag) indicated the cross-basis matrix of temperature included to explore the daily mean temperature cumulative and delayed effects; ns(Humt, df) and ns(Rainfallt, df) represented the natural spline function for confounding relative humidity and rainfall;
 $ns\left( {Timet{\rm{,}}\,{7 \over {year}}} \right)$
denoted the natural spline function of time to adjust the long-term trend and seasonality (7/year); and Dow (the day of the week) was to control any deviation from the weekly pattern with a reference day of Sunday. According to the incubation periods and previous studies, the days of lag in the model were estimated at 21 days to cover all possible lag effects.17 The final composition of the function was a natural cubic spline of temperature with 4 df and relative humidity and rainfall with 3 df.17 The mean temperature value with the lowest risk was selected as the reference to calculate the relative risk (RR).
Sensitivity Analysis
We performed sensitivity analysis to test the robustness of results by varying df for temperature, relative humidity, rainfall and time. R software (version 3.2.1, R Foundation for Statistical Computing, Vienna, Austria) was used for our analysis.
RESULTS
General Characteristics
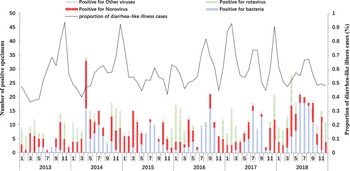
There were 2 peaks of infectious diarrhea from 2013 to 2018: autumn-winter and spring with high incidence of viral diarrhea, and summer with high incidence of bacterial infectious diarrhea. A total of 3214 specimens were tested in laboratories and 835 (25.98%) were positive, of which 291 (9.05%), 544 (16.93%) and 328 (10.21%) were positive for bacteria, virus and norovirus (Figure 1).
Diarrhea-Like Illness Cases and Number of Specimens Positive for Infectious Diarrhea in 2013–2018.

Table 1 reports the descriptive statistics of temperature, relative humidity, rainfall etc, and the proportion of diarrhea-like illness cases in outpatients and confirmed cases, on the scale of every 10000 outpatient visits from 2013 to 2018.
Descriptive Statistics of Daily Meteorological Variables, Diarrhea-Like Illness Cases and Confirmed Cases in Wuxi, China, 2013-2018

Temperature and Lag–risk Association
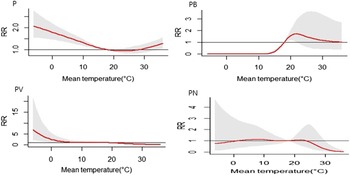
Figure 2 shows the cumulative effects of average temperature on the proportion of diarrhea-like illness cases (P), bacterial positive rate (PB), virus positive rate (PV) and norovirus positive rate (PN) respectively within 21 lag days. The temperature values with the lowest risk were used as references to estimate the effects (RR), which were 23°C for P, -6°C for PB, and 36°C for PV and PN. The risk of P reached its highest at -6°C (RR = 2.08, 95% CI: 1.55-2.78), gradually decreased until it reached the lowest value at 23°C and then increased. The risk of PB first increased very slowly with increasing temperature; at 14°C it began to increase significantly, peaked at 22°C (RR = 1.72, 95% CI: 1.00-2.97), then dropped with temperature. The non-linear relationship curve for PV decreased with temperature. The risk curve of PN showed a general trend of rising first and then declining, reaching the highest at 8°C (RR = 1.12, 95% CI:0.55-2.28) (Figure 2, Table 2).
Cumulative Association and Temperature Distribution of Diarrhea-Like Illness Cases and Confirmed Cases in Wuxi, China (Lag = 21).

The Highest RRs for Cumulative and Separate Effects and Corresponding Temperature in Wuxi, China, 2013-2018

* Taking the lowest risk values as references.
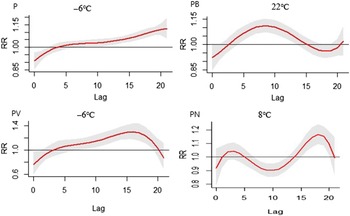
Based on the results above, we analyzed delayed associations between some specific temperatures and outcomes related to infectious diarrhea (Figure 3). The temperatures corresponding to the highest point of the cumulative curve were selected as the specific temperatures to explore the effect of different lag days on. For P and PV, the specific temperature value was -6°C, while specific temperatures for PB and PN were 22°C and 8°C respectively (Table 2). For P, the risk increased slowly with the days of delay, beginning to exceed 1 from the 4th day and reaching the peak on the 21st day (RR = 1.13, 95% CI: 1.06–1.20). The lag-risk curve of PB showed that the RR gradually increased with time, reaching the peak on the 9th day (RR = 1.11, 95% CI: 1.07–1.15), and then decreasing until the 19th day when it began to rise again. The risk exceeded 1 from days 3 to 15 and 21. The curve of PV was similar to P at the beginning, as RR gradually increased with the number of lag days until the 16th day (RR = 1.30, 95% CI: 1.18–1.44) when the risk began to decrease rapidly. RR was above 1 from day 3 to day 20. The shape of lag–response curve of PN was different from others, presenting m-type. The risk of PN gradually increased until it peaked on day 3 (RR = 1.04, 95% CI: 0.98–1.11), then fell to the lowest point on day 10, and increased again with lag days to reach the second peak on day 18 (RR = 1.17, 95% CI: 1.09–1.24).
Lag-Response Association at Different Temperatures Corresponding to the Maximum Cumulative Effect.

Sensitivity Analysis
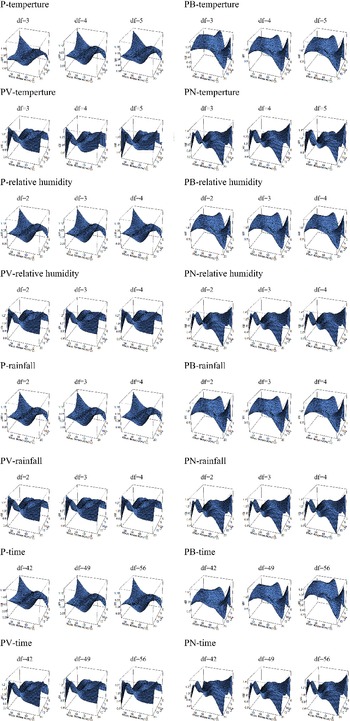
Adjusting the df of temperature (3-5), relative humidity (2-4), rainfall (2-4) and time (42-56) separately, obtained similar results, indicating that the results were robust (Figure 4).
Sensitivity Analyses Adjusting The df of Temperature, Relative Humidity, Rainfall and Time.

DISCUSSION
We applied DLNM to assess the relationship between ambient temperature and the proportion of outpatient visits with diarrhea-like cases, and the proportion of different pathogens (other than parasites) that caused infectious diarrhea, using data collected from 2013 to 2018 in Wuxi, China. The relationship has not been systematically explored and this study, to our knowledge, is the first attempt to establish a connection between them. Previously, related research focused on analyzing the relationship between bacterial diarrheas such as bacterial dysentery, and meteorological factors. With the application of rotavirus vaccines, norovirus has become the main cause of viral infectious diarrhea outbreaks in the collective units. Reference Ahmed, Hall and Robinson18 Therefore, while analyzing the relationship between viral infectious diarrhea and temperature, this study further analyzed the relationship between infectious diarrhea caused by norovirus and temperature.
As shown in Figure 1, based on the percentage of positive specimens for bacteria/viruses, the activity of pathogens that caused infectious diarrhea appears to drive up the proportion of outpatients with diarrhea-like cases. However, since there were only 8 provincial-level surveillance sites for pathogenic surveillance in Wuxi in 2013, 9 new surveillance sites at the municipal level were added in 2014. In addition, the criteria for E. coli changed from manual isolation and culture to PCR detection in 2014, increasing the detection rate of bacteria, which could to some extent explain the low number of positive specimens and the low detection rate of bacteria in 2013.
Figure 1 combined the cumulative association curve while Figure 2 indicated that bacterial infectious diarrhea circulated at higher temperatures, while viral diarrhea circulated more at lower temperatures. This was consistent with previous research. Reference Hao, Liao and Ma10,Reference Carlton, Woster, DeWitt, Goldstein and Levy19,Reference Shamkhali Chenar and Deng20 Checkley, et al. reported that high temperatures might promote the growth of bacteria and prolong the survival time of bacteria in the environment and in contaminated food, which would increase the risk of infection. Reference Checkley, Epstein and Gilman21 Atchison, et al. demonstrated that temperature was related to the effective reproductive number of rotavirus and low temperatures increased the rotavirus transmission. Reference Atchison, Tam, Hajat, van Pelt, Cowden and Lopman22 Norovirus showed similar findings. Bozkurt, et al. surmised that the viability and infectivity of norovirus was lost rapidly with temperature increase. Reference Bozkurt, D’Souza and Davidson23 Therefore, it could be concluded that lower temperatures potentially enhance the viability of the virus, and higher temperatures are more conducive to the survival of bacteria.
For the delayed effects of specific temperatures, the lag-RR curve of P and PV rose slowly at first, with a larger range of PV than P; however, while PV began to decline on the 16th day of lag, PB reached the maximum RR earlier than P and PV, and PN quickly reached the first peak, then declined, and reached the second peak on the 18th day.
STUDY LIMITATIONS
There are some limitations in our study. First, the cumulative effect of norovirus was not apparent. This might be due to the small sample size, and the research period which will need to be further extended to clarify the effect of specific pathogens. Second, we could not directly link temperature and cases, and only emphasized the importance of temperature effects on infectious diarrhea. In our study, we applied meteorological data instead of individual exposure data, which might have caused some bias in the results. Also, we did not have direct evidence to prove that climate influenced people’s behavior and thus affected the spread of pathogens. Third, our data was collected from 1 city, which might limit the applicability of our findings to other locations, particularly for areas with different climates. However, our research also had a lot of strengths. For example, as far as we know, it is the first known study to explore the effects of ambient temperature on the proportion of outpatients with diarrhea-like cases, and the proportion of different pathogens (other than parasites) that cause infectious diarrhea. Moreover, we used daily data, which provided more accurate and timely information than weekly or monthly data.
CONCLUSION
Our study suggested that meteorological factors should be taken into account when formulating relevant public health strategies. For example, a disease warning system can be established based on daily meteorological data, and health promotion and education work can be done on the epidemic diseases in different seasons.
Author Contributions
Yumeng G, Yujun C, Chao S, and Yuan S all contributed equally to the project. Yumeng G and Yujun C analyzed the data and wrote the manuscript. Ping S, Qi Z, and Cheng Q conducted field investigation and data collection. Yong X and Weihong F were in charge of lab testing. Chao S, Yuan S and Yumeng G revised the paper and improved the technical quality of the manuscript. Chao S and Yuan S were the project coordinators, responsible for the project design and implementation, and supervised all aspects of fieldwork, laboratory activities, and data analysis. All authors approved the final version of the paper. All authors have read and agreed to the published version of the manuscript.
Funding Statement
This research was supported by Wuxi Project of Health Commission (No. MS201817 and Q201736), Project of Public Health Research Center at Jiangnan University (JUPH201817 and JUPH201849), Wuxi Key Medical Disciplines (No. ZDXK009), Wuxi Project of Youth Talent (No. QNRC008), Project of Wuxi Commission of Health (No. Q201711), Wuxi Suitable Technical Project of Health and Family Planning (No. T201819), and Wuxi project of Double-Hundred Talent Plan (No. BJ 2020100).
Ethics Approval
The study was conducted by public health agencies as part of their legally authorized mandate and approved by the Ethics Committee of Wuxi Center for Disease Control and Prevention.
Conflicts of Interest
The authors declare that they have no conflict of interests to this work.