

The US Constitution gives the power to spend and tax to the federal government's legislative branch. Currently, this includes 435 representatives in the US House of Representatives and 100 senators in the US Senate. Each is elected with particular interests and causes in mind. Such a design presents severe coordination issues, particularly with budgeting. To help coordinate fiscal policy, the Congressional Budget Act of 1974 was passed. Among other things, it created budget committees in both chambers of the legislature. The committees were tasked with setting overall spending levels for broad budget categories (often called “functions”) and targets for revenues in a budget resolution. The resolution may also contain language to instruct authorizing committees to make policy reforms that change revenues or mandatory spending. This is called “reconciliation language.” All this makes the budget committees unique and, potentially, very powerful (Schick Reference Schick2007). The work of all other committees and all facets of federal government may be affected by the resolution.
By now, the committees have existed for a lengthy period of time. The Senate Budget Committee (SBC) has preserved good records since its inception.Footnote 1 Based on those records, this article investigates the workings of this committee in some depth. First, we see if senators assigned to the SBC reflect all senators in the extent of their polarization measured with floor votes. This first section isolates two important trends: a recent uptick in ideological heterogeneity among SBC Democrats and a longer, more dominant, trend favoring polarization between parties and ideological homogeneity within parties. In section two of the article, we explore how the recent uptick in ideological heterogeneity hampered Democratic efforts to produce a budget resolution for fiscal year 2012 and how the debt limit negotiations offered an unprecedented response. In section three, we explore how the markup process has changed given the longer and more dominant trends of polarized and more homogenous parties. The evidence points to growing partisanship and declining deliberation during markup.
IDEOLOGY AND COMMITTEE MEMBERSHIP
The two major parties in the Senate have grown increasingly more polarized from each other (McCarty et al. Reference McCarty, Poole and Rosenthal2006). Republicans and Democrats are further apart ideologically and finding less common ground on public policy. The members appointed to the SBC are no exception. Figure 1 plots Poole and Rosenthal's (Reference Poole and Rosenthal1997) DW-Nominate scores of legislators' ideological ideal points for the average Republican and the average Democrat on the committee (black lines) and in the senate (gray lines) from 1975 to 2010.Footnote 2 Shaded areas indicate periods of Democratic Party control.
Poole and Rosenthal's (Reference Poole and Rosenthal1997) DW-Nominate scores of legislators' ideological ideal points for the average Republican (solid line) and the average Democrat (dashed lines) on the Senate Budget Committee (black lines) and the full senate (gray lines) from 1975 to 2010 (see Footnote note 2). Shaded areas indicate periods of Democratic Party control.

Partisans on the committee are polarizing. The most substantial movements apart began in the early 1990s.Footnote 3 Beginning in the early 2000s, Republicans on the committee moved further to the right than their Democratic counterparts moved to the left. This is because Republicans made notable changes in the membership of the SBC after gaining control in the November 2002 elections. They replaced Republicans like Olympia Snowe, Gordon Smith, and Chuck Hagel with stronger conservatives like Michael Enzi, Jeff Sessions, and Jim Bunning.
Although not so pronounced, other periods of changed party control helped drive polarization as increased seat allotments on the SBC were given to strong ideologues. The shading in figure 1 shows that in 1981, as with 2003, the Republican Party's committee assignments moved the average ideal point of Republican members to the right. Democrats appointed more liberal members to the committee after their most recent takeover in 2007. They did not exhibit this sort of behavior in their first two takeovers in the series nor did Republicans after the 1994 election.
Several other factors can account for variability in the series. Members' ideologies may grow more conservative or liberal over time. Membership changes may occur even while senate control remains the same. For example, decreased or increased margins for the party in power may result in fewer or greater seats on the committee. Also, members may leave the committee and need to be replaced. As always with statistical analyses, some of the variability is explained by measurement error. Variability in this series comports well with analogous data on the Senate as a whole (McCarty et al. Reference McCarty, Poole and Rosenthal2006) but with one exception: Republicans on the committee took a stronger and, so far, persistent turn to the right than all Republicans in the Senate beginning in 2003.
The parties have moved further apart ideologically in the SBC. Have they become more alike within party? Figure 2 tells the story. It plots the variability around the average ideal point (measured as the standard deviation) for Republican and Democratic committee members (black lines) and the full senate (gray lines) from 1975 to 2010. Republican committee members have been ideologically more heterogeneous than their Democratic counterparts over most of the series. Both have experienced increased homogeneity over time. They have become more alike within party. The Republican SBC assignments following the November 2002 election, as discussed previously, explain the sharp decrease in variability in 2003. The trend is similar for the Senate as a whole but Senate Republicans are more heterogeneous than committee Republicans with an exception when Republicans on the committee began drifting toward ideological diversity beginning in the 1990s, peaking in the early 2000s and steering back in 2003. Democrats on the committee better reflect Democrats in the Senate as whole until the late 1990s when the latter became consistently more ideologically heterogeneous than the former.
Standard deviation of Poole and Rosenthal's (Reference Poole and Rosenthal1997) DW-Nominate scores of legislators' ideological ideal points for Republicans (solid line) and Democrats (dashed lines) on the Senate Budget Committee (black lines) and the full senate (gray lines) from 1975 to 2010 (see Footnote note 2). Shaded areas indicate periods of Democratic Party control.

Very recent history has seen Democrats, particularly those on the committee, bucking the trend toward homogeneity. Since the 2006 election, when Democrats made very substantial gains, their committee members have grown increasingly unalike ideologically. The last time Democrats on the committee experienced such ideological variability was more than 15 years before. Democratic heterogeneity matched that of Republicans in 2010, an occurrence unseen since 1976. This recent movement may help us understand an anomalous situation in 2011.
DEMOCRATIC PARTY DISUNITY IN 2011
For the first time in the history of the SBC, 2011 saw no publicly proposed budget resolution by the majority party. Further, for the first time in 10 years and only the second time in the history of the SBC, there was no budget resolution markup process.Footnote 4 The first was in 2001. The Senate and the SBC were evenly divided between Republicans and Democrats in that year. In theSsenate, a tie vote can be broken by the vice president (then Richard Cheney). There is no analogous procedure on an evenly divided SBC. If a resolution receives a tie vote, it fails. Republicans, thus, skipped the committee markup process and presented a budget straight to the Senate floor. So what explains 2011?
Some argue that Senate Democrats have not proposed a fiscal year 2012 budget because 2011 was an exceptional year. The president, Senate Democrats and House Republicans were negotiating over deficit reduction plans to enable a debt limit increase. However, 76 separate measures have altered the debt limit since March 1962 according to the US Office of Management and Budget (OMB). Those votes and other major negotiations have not altered the budget resolution process so dramatically. Also, the debt limit negotiations did not keep Republicans on the House Budget Committee from passing a budget resolution. Although legislator ideal points do not yet exist for 2011, we can seek to explain changes in committee membership and the trend toward ideological heterogeneity for the majority party from 2006 to 2010 and see how this helps us understand the anomaly of 2011.
Figure 3 shows the number of committee partisans from 1975 to 2011 grouped by consecutive years of unchanging seat allotment. In 2006, Republicans were in the majority and held 12 seats to the Democrats 10. The November elections gave Democrats the Senate and 12 seats on the SBC. Republicans lost one seat, down to 11. The Democrats picked up more Senate seats in November 2008 and increased their committee margin 13 to 10. It is in this period (from 2007 to 2010) that Democrats on the committee became more ideologically heterogeneous. To understand why, let us explore the ideological ideal points of senators who left and senators who joined the committee.
The number of Senate Budget Committee Republicans (in black) and Democrats (in gray) from 1975 to 2010 grouped by consecutive years of unchanging seat allotment.

Figure 4 shows the ideal points for Democrats who served on the SBC in 2006 only (white squares), in 2010 only (gray squares) and in both years (black squares).Footnote 5 Senators' Feingold and Nelson anchored the ideological extremes for the Democrats. The three senators who left the committee after 2006 but before 2010 (Sarbanes, Johnson, and Menendez) were well within these extremes. The senators who replaced them or filled additional Democratic seats on the committee were much more ideologically diverse than the remaining members (although still within the range set by Feingold and Nelson). Sanders and Whitehouse represented the far left of the party whereas Warner and Begich represented the party's conservative wing. Merkley tended to be more centrist than his cohort of new senators but to the left of all but Feingold among those who served in 2006.
Common Space DW-Nominate ideal points for Democrats who served on the Senate Budget Committee in 2006 only (white squares), in 2010 only (gray squares) and in both years (black squares).

This new and ideologically more diverse group of Democrats on the SBC worked together to report a budget resolution out of committee in 2010.Footnote 6 But the dynamic changed in 2011. After the 2010 election, the Democrats' seat allotment was reduced by one, 12 seats to the Republicans 10.Footnote 7 This gave any one committee Democrat the power to kill a budget resolution during markup by voting against the chairman's mark. And some threatened just this. Senator Sanders, for example, made clear on the Senate floor that he would not support a budget that did not increase taxes as much as it decreased spending.
To appease liberal Democrats, Democratic chairman Kent Conrad of the SBC assembled a budget proposal (for internal Democratic review) recommending an equal share of spending cuts and tax increases. It called for revenue from a millionaire surtax advocated by Sanders. Conservative Democrats on the SBC were largely muted about the idea in public but gave indications that the proposal held too much revenue generation. In an interview with a reporter from The Hill, Senator Begich said of the millionaire surtax, “I think it's going to be a hard issue.” He went on to recommend less-ambitious tax measures such as allowing temporary tax cuts to expire (Becker Reference Becker2011).
This presented Chairman Conrad with a situation similar in some ways to the one faced by Republican Chairman Pete Domenici in 2001. If just one Democrat voted against the budget resolution in committee, there would be as many members voting for as against the resolution and it would fail. Conrad would need to keep his entire coalition together. By appeasing liberals, he would alienate conservative Democrats. Should he appease these conservatives, liberals would turn against his proposed resolution. An attempt to report a resolution out of committee would likely meet with failure. Unlike 2001, Democrats were clearly in the majority. They would look fractured and incapable of governing to the American people. Ultimately, Conrad avoided this situation by shifting focus to the debt-limit negotiations.Footnote 8
Senate Majority Leader Reid proposed deeming budget resolutions for fiscal years 2012 and 2013 as part of his 2011 debt-limit increase plan. In a Congressional Research Service report, Lynch (Reference Lynch2011) describes “deeming resolutions” as “… legislation which is deemed to serve as an annual budget resolution for purposes of establishing enforceable budget levels for a budget cycle (1).” Budgets have been deemed in the past when, for example, budget resolutions have been passed by each chamber of Congress but cannot be reconciled in a conference agreement or when passage of a resolution is tardy (Lynch Reference Lynch2011). The deeming proposed in Reid's plan is unprecedented for two reasons. First, it deems a budget resolution while entirely skirting the budget process outlined in the Congressional Budget Act of 1974. Second, it deems a budget a year in advance.Footnote 9 Republican senators had been critical of the Democrats' incapacity to produce a budget but, in return for more security spending, the Republican Senate leadership agreed to the deeming provision in the compromise bipartisan plan (the Budget Control Act of 2011). It has since become law and inherently weakens a budget process that has already become increasingly problematic over time. “How” is discussed next.
POLARIZATION AND THE CHANGING MARKUP PROCESS
Growing Partisanship
The dominant trends in figures 1 and 2 show growing ideological polarization between parties and growing ideological homogeneity within parties. This trend has greatly influenced the markup process. If there is one year that most drives this change, it is 1993. President Clinton had just taken the oath of office. Democrats had a unified government with majorities in both the House and Senate for the first time in more than two decades. The SBC moved relatively quickly that year. They had markup on the resolution from March 9 to 11, 1993.Footnote 10 According to Congressional Quarterly, the accelerated pace was intended “to get a quick vote on the budget plan and its promise of broad deficit reduction before turning to Clinton's controversial stimulus spending plan (Hager Reference Hager1993).”
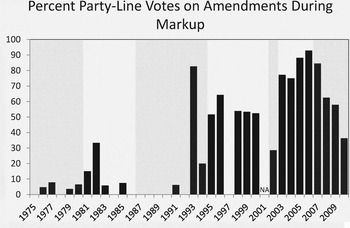
The Democrats moved confidently. They were particularly partisan with Republican amendments during markup. An enormous proportion of minority party amendments (83%) were tabled and defeated with party-line votes by SBC Democrats. Twenty-four of 29 amendments were tabled by the majority with these strict party-line votes. The remaining five were tabled with one or two Republicans joining the Democrats. To that period, the proportion of minority party amendments that received party-line votes never exceeded one third and was usually much less. Democrats also reported the final resolution out of committee with a party-line vote. This outcome was very rare to that point. Before 1993, only three of 27 resolutions were reported with party-line votes. Since then, nearly all (15 of 17) have been. Floor action on budgetary measures also proved to be very partisan in 1993 (Joyce and Meyers Reference Joyce and Meyers2001).
A series of figures show the changing nature of the markup process. The first two figures point to 1993 as a watershed year in ushering in an era of partisanship on the committee. The next two figures show declining deliberations during the markup process. Figure 5 shows the percent of amendments receiving party-line votes during markup.Footnote 11 Shaded areas indicate periods of Democratic Party control. Data for 2001 do not exist because there was no markup process that year as described previously. The fraction of amendments experiencing party-line votes ranged from a low of 0 in several years to 93% in 2006. This fraction has tended to grow over time with a regime shift beginning in 1993. All but one year with 0 party-line votes on amendments preceded 1993. After 1993, regardless of which party had control, there tended to be many party-line amendment votes.
The percent of amendments receiving party-line votes during markup. Amendments that passed with voice votes or unanimous consent are excluded. Shaded areas indicate periods of Democratic Party control. Data for 2001 do not exist because there was no markup process that year.

Members of the majority and minority party propose amendments during markup. Most of the minority party amendments fail. Those amendments that pass garner some majority party supporters. Such amendments show evidence of bipartisanship. Figure 6 shows the number of minority party sponsored amendments with recorded votes from 1975 to 2010.Footnote 12 The black portion of each bar shows the number of minority sponsored amendments that were rejected by the committee while the gray portion shows the number of such amendments that passed. Shaded areas indicate periods of Democratic Party control.
The number of minority party sponsored amendments with recorded votes from 1975 to 2010. Amendments that passed with voice votes or unanimous consent are excluded. The black portion of each bar shows the number of minority sponsored amendments that were rejected by the Senate Budget Committee while the gray portion shows the number of minority sponsored amendments that passed. Shaded areas indicate periods of Democratic Party control. Data for 2001 do not exist because there was no markup process that year.

In 1993, only minority sponsored amendments were proposed. None passed. They were all tabled wholly or mostly by majority party senators. This altered the dynamic of markup in ensuing years. Before 1993, an average of 4.9 or 32% of minority sponsored amendments passed (among years where at least one minority sponsored amendment was offered). After 1993, an average of less than one or 6% of minority sponsored amendments passed. Bipartisanship was replaced with heavy partisanship. This was certainly an evolutionary process, but 1993 emerges as an important transformational year.
Declining Deliberation
There are many indicators, anecdotal and empirical, that show a decreased willingness to negotiate in good faith over budgets. Jim Hearn began working for the Congressional Budget Office (CBO) in 1984 and has been on the SBC since 1995. He is currently the longest serving member of the staff (both minority and majority) and is director for Federal Programs and Budget Process. He remembers witnessing, as a CBO analyst, markups of budget resolutions in the 1980s where real deliberation and discussion occurred. During the 1990s, this changed. When he joined the SBC in 1995, everything in markup seemed perfunctory, he recalled. Markup commenced before the minority had an opportunity to even see the chairman's proposed budget resolution. The minority party proposed amendments without knowing with certainty what was in the resolution. Little negotiation was had, and little compromise was reached. This was true whether Republicans or Democrats were in the majority.
Empirical evidence of declining deliberation on the SBC also exists. Figure 7 shows the number of days spent deliberating during markup on the first budget resolution in each year from 1975 to 2010.Footnote 13 Shaded areas indicate periods of Democratic Party control. The number of days spent has decreased substantially from an average of 5 to 6 days per year from 1975–1987 to only 2 in the 2000s.Footnote 14 Figure 8 plots the number of transcript pages for the first budget resolution markup in each year from 1975 to 2010. The same trend is evident. As markup hearings have become more perfunctory, the debate, deliberation, negotiation, and compromise that fill transcript pages have declined dramatically.Footnote 15
The number of days spent deliberating during markup on the first budget resolution in each year from 1975 to 2010. Shaded areas indicate periods of Democratic Party control. Data for 2001 do not exist because there was no markup process that year.

The number of transcript pages for the first budget resolution markup in each year from 1975 to 2010. Shaded areas indicate periods of Democratic Party control. Data for 2001 do not exist because there was no markup process that year.

CONCLUSION
Polarization has changed the workings of the SBC. The long trend of parties moving further apart ideologically and more homogenous within party has resulted in more partisanship in crafting a resolution, amending a resolution and reporting it to the floor. It has resulted in fewer legitimate deliberations, less compromise and, generally, more perfunctory exercises.
Democratic Party members on the SBC have very recently experienced a trend moving in the other direction. They have become more ideologically diverse. The gulf between Democrats and Republicans is still large. This recent movement does not portend growing cooperation between the two parties on the committee. That, coupled with a small seat lead on the committee, has made it difficult for the SBC to agree on or report a budget resolution for fiscal year 2012. Rather, in an unprecedented move, the Senate has deemed a budget resolution as part of the debt-limit increase in the Budget Control Act not only for fiscal year 2012 but also for fiscal year 2013, all while skirting the budget process outlined in the Congressional Budget Act of 1974.
The recent move toward ideological diversity by Democrats on the committee should be monitored to see if Democrats change their strategy given recent hardships. Also, the long trend toward partisan polarization and its affect on the budget process deserves further inspection. Particularly, what explains partisan polarization and why do the early 1990s often emerge as a transformational time for this phenomenon? Although literature exists that seeks to understand the roots of polarization (see Parent and Bafumi (Reference Parent and Bafumiforthcoming) for a review), there is no real consensus among the scholarship. This is left to ongoing and future research.
When committees do not operate properly, the legislature does not operate properly. The findings here speak to a weakened legislature. Such an institution finds it easier to delegate powers to a smaller subset of actors such as party leaders or even rivals in the system of separated powers such as the presidency. This delegation compromises what is perhaps the key function of the legislature, being broadly accountable to the people. The normative implications of this should and no doubt will preoccupy scholars for some time to come.
Acknowledgments
I would like to thank Cathey Dugan, Jim Hearn, Kathleen Llewellyn-Butts, Dylan Morris, Marcus Peacock, Cheri Reidy, Lynn Seymour, Danna Thomas, and all the staff of the Senate Budget Committee who aided my research. I would also like to thank Jeffrey Biggs, Roy Meyers, Joseph Parent, Robert Shapiro, and participants in the Dartmouth Government Department Seminar Series for their helpful suggestions.