Introduction
The swelling behavior of clay minerals in subsurface formations has profound implications for reservoir performance, particularly in thermally enhanced oil recovery (EOR) operations. While traditionally attributed to osmotic processes involving the influx of water into interlayer spaces, contemporary research indicates that clay swelling is governed by a combination of mechanisms, including hydration of exchangeable cations, structural disruptions at elevated temperatures, and chemical interactions between clays and injected fluids. Elevated temperatures during steam flooding exacerbate these effects, altering clay–water interactions through increased ion mobility, dissolution of mineral constituents, and changes in the balance of electrostatic and van der Waals forces. For example, the exchange of sodium for divalent cations such as calcium can influence the swelling behavior significantly, with implications for pore-scale permeability. The prevalent swelling clays encountered in reservoir rocks are typically smectites and mixed-layer illite-smectites (van Olphen, Reference Van Olphen1977; Madsen and Müller-Vonmoos, Reference Madsen and Müller-Vonmoos1989; Mitchell et al., Reference Mitchell, Soga and O’Sullivan2025).
The swelling characteristics of clay minerals are influenced significantly by the types of exchangeable cations present and their layer charge (Chávez-Páez et al., Reference Chávez-Páez, Van Workum, De Pablo and De Pablo2001). Greater surface charge corresponded to limited swelling, with some highly charged species exhibiting no swelling at all. Conversely, minerals with lower surface charge density display significant swelling, correlating with the addition of water layers between silicate layers (Slade et al., Reference Slade, Quirk and Norrish1991; Laird, Reference Laird1999). Three processes that cause permeability reduction in clay-based sedimentary formations were detailed by Mohan and Fogler (Reference Mohan and Fogler1997). Swelling clays, such as smectites and mixed-layer clays, expand initially in favorable ionic conditions before disintegrating and migrating. Fines associated with swelling clays may become dislodged and released during clay swelling. This is known as ‘fine generation by discontinuous jumps or microquakes’. Under specific hydrodynamic conditions, non-swelling clays, such as kaolinites and illites, can detach from the pore surface and subsequently move with the fluid as it flows through the porous formation.
Thermal EOR methods such as steam flooding can lead to extensive formation damage due to clay swelling. Temperature plays a crucial role in modifying the physical and chemical behavior of clay minerals in reservoirs. As temperature increases, the thermal energy disrupts the hydrogen bonds within the interlayer regions (particularly water interconnections) of clays, such as smectite and illite. This thermal disruption can cause expansion of the interlayer space, leading to swelling. The degree of swelling is influenced by the type of clay mineral, with smectite being more prone to thermal swelling due to its large cation exchange capacity (CEC) and water-retention ability in the interlayer region (Mitchell et al., Reference Mitchell, Soga and O’Sullivan2025). The hydration of clay minerals involves the adsorption of water molecules into the interlayer space. At elevated temperatures, the solubility of water in the clay matrix increases, potentially enhancing the swellability (Ye et al., Reference Ye, Zheng, Chen, Chen, Cui and Wang2014). High temperatures can also accelerate the release of interlayer cations into the pore fluid, however. For example, calcium and sodium ions in the interlayer region may exchange with ions in the surrounding brine, modifying the electrostatic forces and potentially perturbing swelling under low-salinity conditions (van Olphen, Reference Van Olphen1977).
From a thermodynamic viewpoint, the swelling behavior of clays under temperature gradients can be explained by the Gibbs free energy change (ΔG). The Gibbs free energy of hydration and cation exchange determines the stability of the clay structure (Madsen and Müller-Vonmoos, Reference Madsen and Müller-Vonmoos1989):
 $$ \Delta G=\Delta H-T\Delta S $$
where ΔG is Gibbs free energy; ΔH is enthalpy change (associated with hydration and ion interactions); T is the absolute temperature; and ΔS is the entropy change.
At higher temperatures, the entropy term (TΔS) becomes significant, potentially overcoming the enthalpy barrier for hydration. This can lead to increased swelling as water molecules are energetically favored to occupy the interlayer spaces. However, extremely high temperatures may destabilize the hydration structure, resulting in dehydration and collapse of the interlayer (Mitchell et al., Reference Mitchell, Soga and O’Sullivan2025).
Both clay expansion and fine dissolution and movements can be enhanced at higher temperatures. Pore blockage and decreased permeability can result from steam injection-induced clay swelling. Both are mutual and interdependent, as pore blockage contributes to permeability reduction, and decreased permeability exacerbates the effects of localized blockages (Kudrashou and Nasr‑El‑Din, Reference Kudrashou and Nasr-El-Din2020). The extent of clay swelling during hot-water injection and steam flooding depends on the type and amount of clay minerals present, the salinity of the injected water, and the temperature and pressure conditions. Low-salinity water is often used during thermal EOR to reduce scaling and fouling in the injection wells, but this can also increase the risk of clay swelling.
Karami et al. (Reference Karami, Sedaee and Nakhaee2023) conducted experimental tests to determine the swelling index of smectite and found that the swelling of smectite increases at low salinity levels, thus with fresh water it caused a swelling degree of up to 77.3%, leading to serious permeability impairment. Ahmed et al. (Reference Ahmed, Saaid, Akhir and Rashedi2016) investigated the influence of salinity, cation valence, and pH on bentonite swelling behavior. The maximum swelling ratio of bentonite decreased sharply as the NaCl concentration increased from 0 to 1.5%, and as the concentrations of KCl, MgCl2 and CaCl2 increased to 1%. Upon increasing salt concentration, inter-particle repulsion in montmorillonite decreases and the particle becomes free to move at lower inter-particle distance. The CaCl2 and MgCl2 concentrations (up to 1.5%) yield the lowest swelling ratios compared with NaCl and KCl. This is because any increase in the cationic valency will decrease the interparticle attractive force; therefore, there is more effect on the diffuse double layer (DDL). The swellability of montmorillonite decreases with increasing salinity, while low-salinity environments increase it (Zhuang et al., Reference Zhuang, Liu, Xiong and Liang2018).
Similarly, studies have shown that steam injection can exacerbate formation damage in clay-rich sandstone formations. Minkhanov et al. (Reference Minkhanov, Bolotov, Sagirov, Varfolomeev, Anikin, Tazeev and Derevyanko2021) demonstrated the influence of clay content on permeability damage during steam injection to a sand pack model, while Kudrashou and Nasr‑El‑Din (Reference Kudrashou and Nasr-El-Din2020) reported serious permeability damage of up to 83% due to montmorillonite presence during steam injection. Sandstone formations containing clay-rich minerals can be very sensitive to the high-temperature and reduced-salinity environments introduced by steam injection (Bennion, Reference Bennion2002).
Montmorillonite swells when coming in contact with steam or water at the field scale (Young et al., Reference Young, McLaughlin and Borchardt1980; Sheng, Reference Sheng2013). Romanova et al. (Reference Romanova, Ma, Piwowar, Strom and Stepic2015) evaluated the sensitivity of rock samples from formations in western Canada to thermal formation damage. It was revealed that chlorite and smectite together with kaolinite and illite are more susceptible to formation damage because of steam injection. The steam injection in Cold Lake, Canada, caused the swelling of smectite and subsequent reduction in porosity, permeability, and oil recovery rate. It was also partly responsible for the low steam sweep at the Ipiatik Heavy Oil Pilot, Cold Lake (Zhou et al., Reference Zhou, Gunter, Kadatz and Cameron1996). Shengli Oilfield, with a clay content of 16.8%, has been tested and promoted for steam flooding. The implementation of thermal EOR led to a rapid production decline and inefficient steam propagation through reservoir formation (Xue et al., Reference Xue, Liu and Zhang2022).
Another possible mechanism is the change in rock stability during the steam flooding. When steam is injected, the clay grains swell, leading to an increase in water volume within the pore space of the clay minerals. When the water volume rises, the contact angle between water and clay grain surface decreases. Consequently, there is a decrease in both capillary pressure and surface tension. When observed at a larger scale, the strength of the rock decreases, and it becomes looser (Dong et al., Reference Dong, Liu and Chen2021). Understanding different mechanisms behind clay swelling and its response to variations in operational factors such as water salinity and temperature is essential for addressing this issue and improving the effectiveness of steam-flooding processes.
A significant challenge was observed during steam-flooding operations in an oil field in Kazakhstan, due to clay swelling and permeability reduction. The reservoir rock contains 40% smectite-illite and 60% quartz-illite sand grains. Dilution of the injected water in this field by 25% resulted in a >40% reduction in permeability, corresponding to the expansion of smectite in the rock sample. The results showed a strong degree of permeability damage caused by the demineralization of the injected water, with more pronounced effects at higher temperatures during thermal EOR. By examining the complex interaction between clay swelling, water salinity, and temperature changes, this research aimed to contribute to the assessment of clay swelling issues during thermal EOR in this sandstone oil field in Kazakhstan.
Materials and methods
The experimental work was divided into two parts: static and dynamic tests. The static tests were designed to assess the extent of clay expansion under varying temperature and salinity conditions specific to the reservoir being studied. In addition, these tests aimed to determine the critical salinity concentration (CSC) at various temperature levels. The dynamic core flooding tests were conducted to evaluate the degree of permeability impairment caused by clay swelling.
Materials
For experimental work, the sands, clays, and formation water used were all sourced from the field under study. The rocks were collected from the oil field, with sand consisting of 54.9% quartz and 45% illite, and the clays consisting of mixed-layer minerals (illite-smectite, smectite-illite). The composition of the formation water (North Kotyrtas (NK) water) and clay used in experiments is detailed in Tables 1 and 2. The elemental analysis of the clay samples was performed using X-ray fluorescence (XRF) on a Rigaku Supermini200 bench-top spectrometer (Rigaku Corporation, Tokyo, Japan). All ion chromatography analyses for water chemistry were carried out using a Dionex ICS-6000 high-performance modular ion chromatography system (ThermoFisher Scientific, Waltham, MA, USA).
Mineral composition (mg L–1) and characteristics of NK brine

Elemental compositions of clay samples (wt.%)

Note that, despite the fact that both the clay and the sand samples were obtained from the same field, the samples could have experienced different degrees of wetness and saturation. Therefore, to ensure that all samples had the same characteristics (uniform baseline for the experiments), pre-treatments were carried out as described below.
Static clay swelling study
The static clay swelling tests were conducted according to the ASTM D5890 standard. The static tests were divided into two parts: first, determination of CSC, and second, measurements of the clay swelling index at various temperature and salinity conditions. The temperature conditions in the experiments ranged from 25 to 200°C with various water-salinity levels.
Before beginning the test, clay grains were prepared as follows, with the goal of maximizing the probability for accurate results. First, the rock samples were crushed to a fine powder, by a Retsch Jaw Crusher BB 50 machine (Retsch GmbH, Haan, Germany). This powdered clay was then ground further until 100% of the particles passed through a 125-μm standard sieve. Once this particle size was achieved, the sample was placed in an oven and dried thoroughly for 24 h. After that 2 g of dried clay was added to brines at various salinities and temperatures. The height of the clay sediment was measured after hydration and settlement at the bottom of the cylinder. The sample was covered and kept at the test temperature for 24 h. The new clay level was then measured to record possible swelling. The clay swelling index (
 $ {I}_{\mathrm{CW}}) $
was calculated by dividing the final change of the clay height over initial height. The CSC showed a salinity level where the clay started to swell at lower salinities. At any temperature from 25 to 200°C, static swelling was measured at various salinities to determine the CSC.
Dynamic clay swelling test
The permeability reduction and clay swelling during thermal EOR were studied by core flooding the previously prepared sand packs, based on the rock composition in the field (60% sands and 40% clays). A special steel sleeve and shaft were designed and manufactured based on the given schematics (Fig. 1a). The sandpack was prepared by filling the steel sleeve with the sample using a conventional pressing machine. The sandpack was then covered with 40 μm sieves on both sides to prevent particle migration toward the flow during core flooding (Fig. 2).
(a) Schematic of the shaft and sleeve, and (b) steel sleeve and shaft used for dynamic clay swelling tests.

(A and B) Prepared sandpack; and (C) sandpack covered by sieves.

The length of each sandpack was 74 mm and the diameter was 34.5 mm. Using Eqn (2), the porosity for each sandpack was calculated (Table 3):
 $$ \unicode{x03C6} =\frac{V_b-\frac{W}{\rho }}{V_b} $$
Sandpack porosity

where
 $ \unicode{x03C6} $
is the porosity,
 $ {V}_b $
is the bulk volume of the sandpack, W is the dry sandpack weight, and
 $ \rho $
shows the density of the sand grains.
Flooding was conducted to measure the effect of salinity reduction on clay swelling and to measure the critical flow rate (CFR) to start movement of the detached clays. Changes in salinity and temperature, particularly high temperature and low salinity, could decrease the CFR, thereby leading to earlier initiation of particle migration. All dynamic experiments were conducted using the SRP 350 core flooding system by Vinci Technologies (Fig. 3).
Schematic diagram of the SRP 350 core-flooding system.

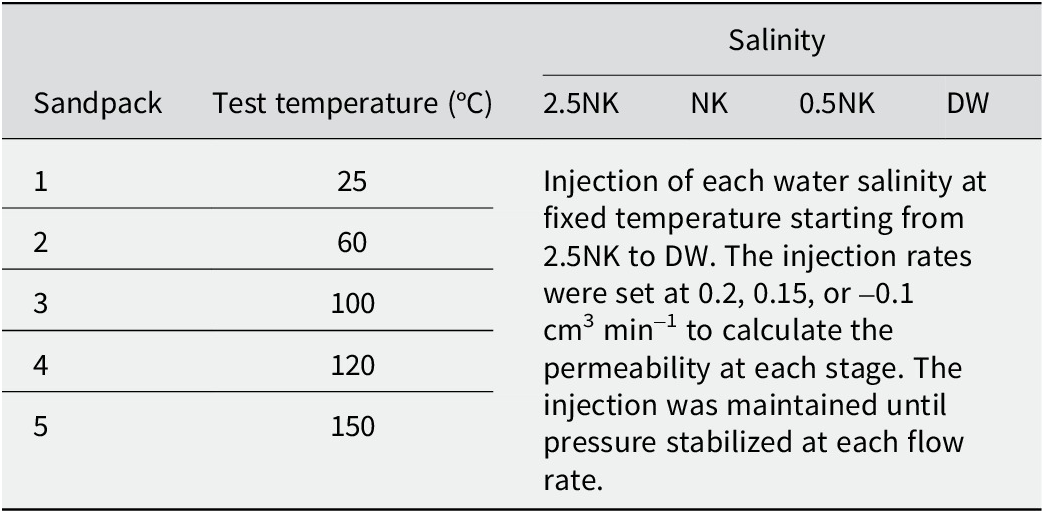
To determine the CFR, the sandpack was flooded using a range of flow rates (0.1–0.5 cm3 min–1) at three various temperatures (25, 100, and 150°C) and salinity levels (distilled water (DW), NK water, and 2.5 times more saline than NK water). By analyzing the pressure-drop response, the CFR was determined at each temperature. To measure the effect of salinity on the swelling, the flooding process was conducted with five various core samples. Each sandpack was flooded with various salinities at a fixed temperature and injection design (Table 4).
Effect of flooding sequence and salinity on swelling

The permeability for each flooding case can be calculated applying Darcy’s formula in Eqn (3):
 $$ q=\frac{kA\Delta P}{\unicode{x03BC} L} $$
where q is the flow rate (cm3 s–1), A is the cross-sectional area (cm2), ΔP is the pressure drop (atm),
 $ \unicode{x03BC} $
is water viscosity (cp), L is the length of the sandpack (cm), and
 $ k $
is the permeability (mD).
Results
Static experiments
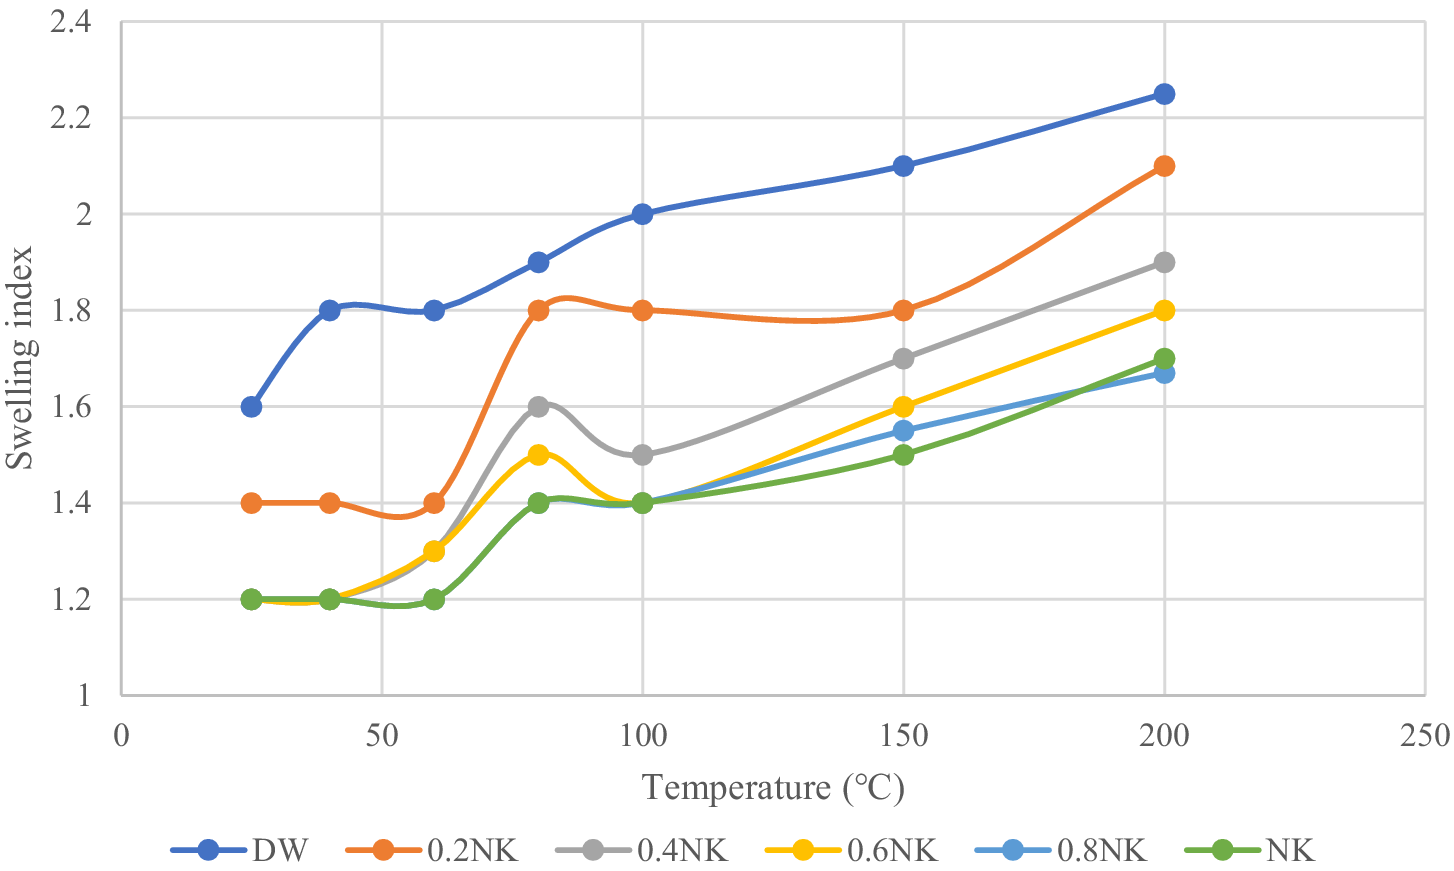
As the first step, the effect of temperature and salinity on the smectite-illite clay swelling index was studied in the static state. The static tests showed the effects on clay swelling of specific temperature and salinity levels (Fig. 4). The salinity was changed from NK water salinity to zero (DW). The results showed that increasing salinity inhibits the swelling of smectite-illite. Clay expansion is highly sensitive to temperature; at high temperatures, the observed swelling was significant, even at high salinities (Fig. 5).
An example of clay swelling (DW at 100°C): (left) initial condition and (right) expansion after 1 day. Units are millimeters.

Clay swelling index at various temperatures and salinities.

Smectite has a large CEC value which means it can exchange positively charged ions readily on its surfaces. This characteristic enables it to attract and hold water and cations in its interlayer space. As water enters the interlayer space, it exerts an outward pressure on the superimposed clay layers, thus causing swelling and expansion of the clay system. The influx of water molecules can also lead to the displacement of cations within the clay structure. In low-salinity or fresh water, the concentration of cations is relatively low, allowing water molecules to move to the interlayer spaces, leading to further expansion of the clay lattice. The temperature-induced changes in the DDL structure influence swelling. Higher temperatures may amplify repulsion between clay particles due to extended DDLs.
The NK water composition consists of 1013 mg L–1 of Na+ and Ca2+, which is 20% total mineralization. The presence of these cations strongly affects the swellability of smectite. Sodium ions promote greater swelling compared with potassium ions due to their larger hydrated radius and stronger hydration energy. In environments where Na+ is the only cation present, the lack of competing cations (e.g. Ca2+, K+, or Mg2+) can exacerbate swelling due to increased electrostatic repulsion among the layers of negatively charged clay. Na+ ions, despite their strong hydration energy, may not shield the negative charges effectively on clay surfaces at high concentrations because their hydration shell can hinder close adsorption to the surface. This can lead to a swelling regime dominated by electrostatic forces.
It should be noted that from 25 to 60°C there were only small changes in the degree of clay swelling, due to an insufficient thermal energy supply that was needed to change the repulsion between double layers of clays (Fig. 6). Similar results were obtained by Ahmed et al. (Reference Ahmed, Saaid, Akhir and Rashedi2016). At ~70–80°C there was a sharp increase in swelling index at almost all salinity concentrations, due to the phase transition of water molecules and desorption and adsorption balance. At certain temperatures, the structure and behavior of water molecules associated with the clay particles can change, which results in a phase transition that allows the clay particles to adsorb more water and swell. Water diffusion increases with temperature. Water movement into the interlayer is accompanied by enlargement of the interlayer distance. As temperatures approach and exceed 100°C, a steady ascent in the swelling index continues, potentially because water molecules acquire heightened thermal energy, boosting their kinetic activity.
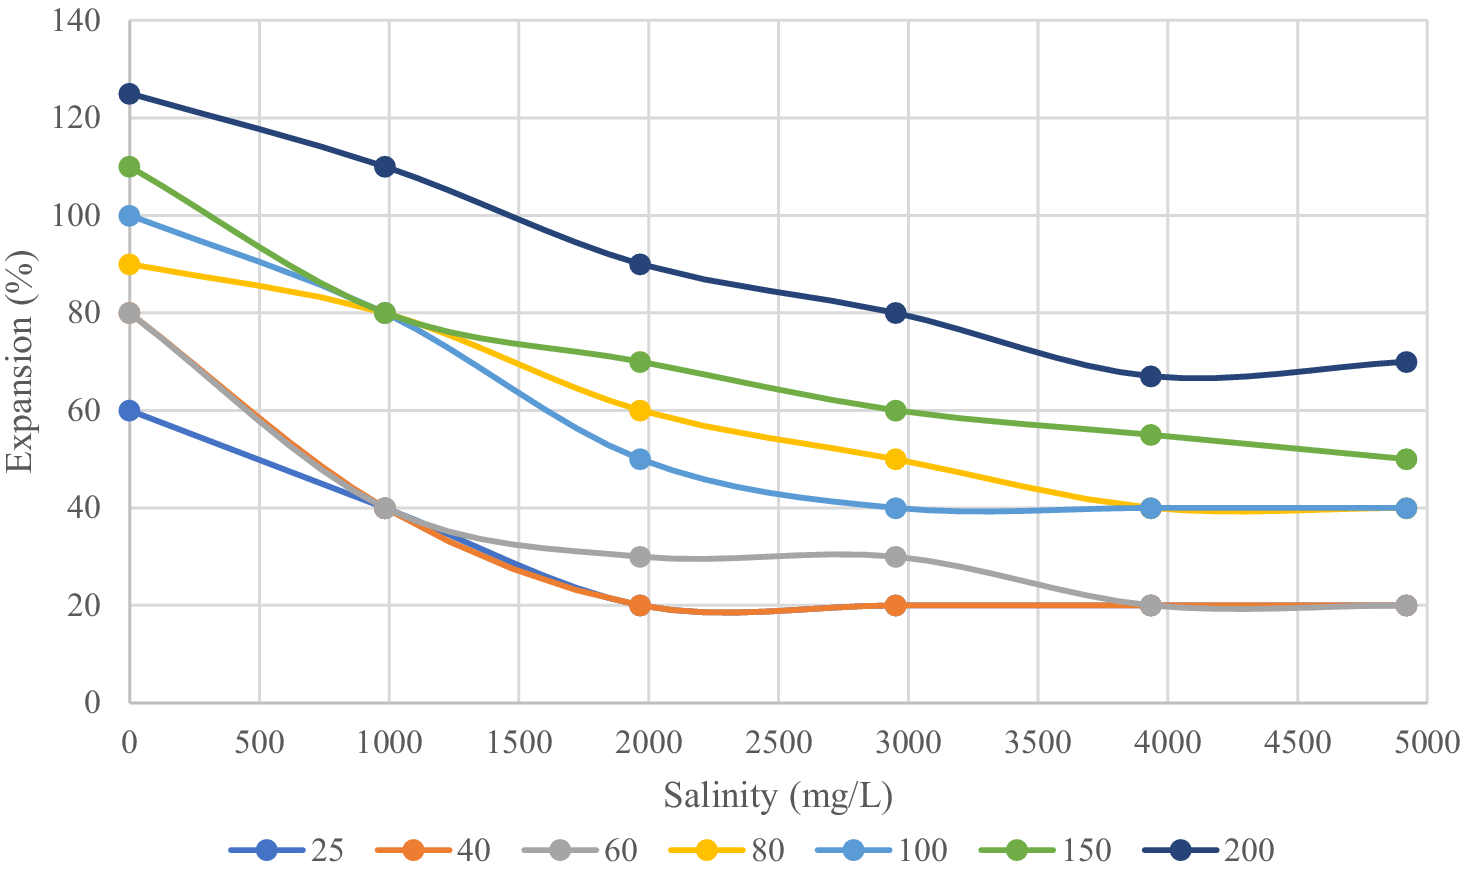
Clay expansions at various temperatures and salinities.

For a better interpretation of the temperature effect, the correlation between salinity and percentage of clay expansion at various temperatures was generated (Fig. 6). Inorganic salts, such as calcium chloride, which are contained in water, could neutralize the negative charges on clay particles or other suspended solids, reducing electrostatic repulsion and promoting particle aggregation and swelling. This effect is weaker at higher temperatures.
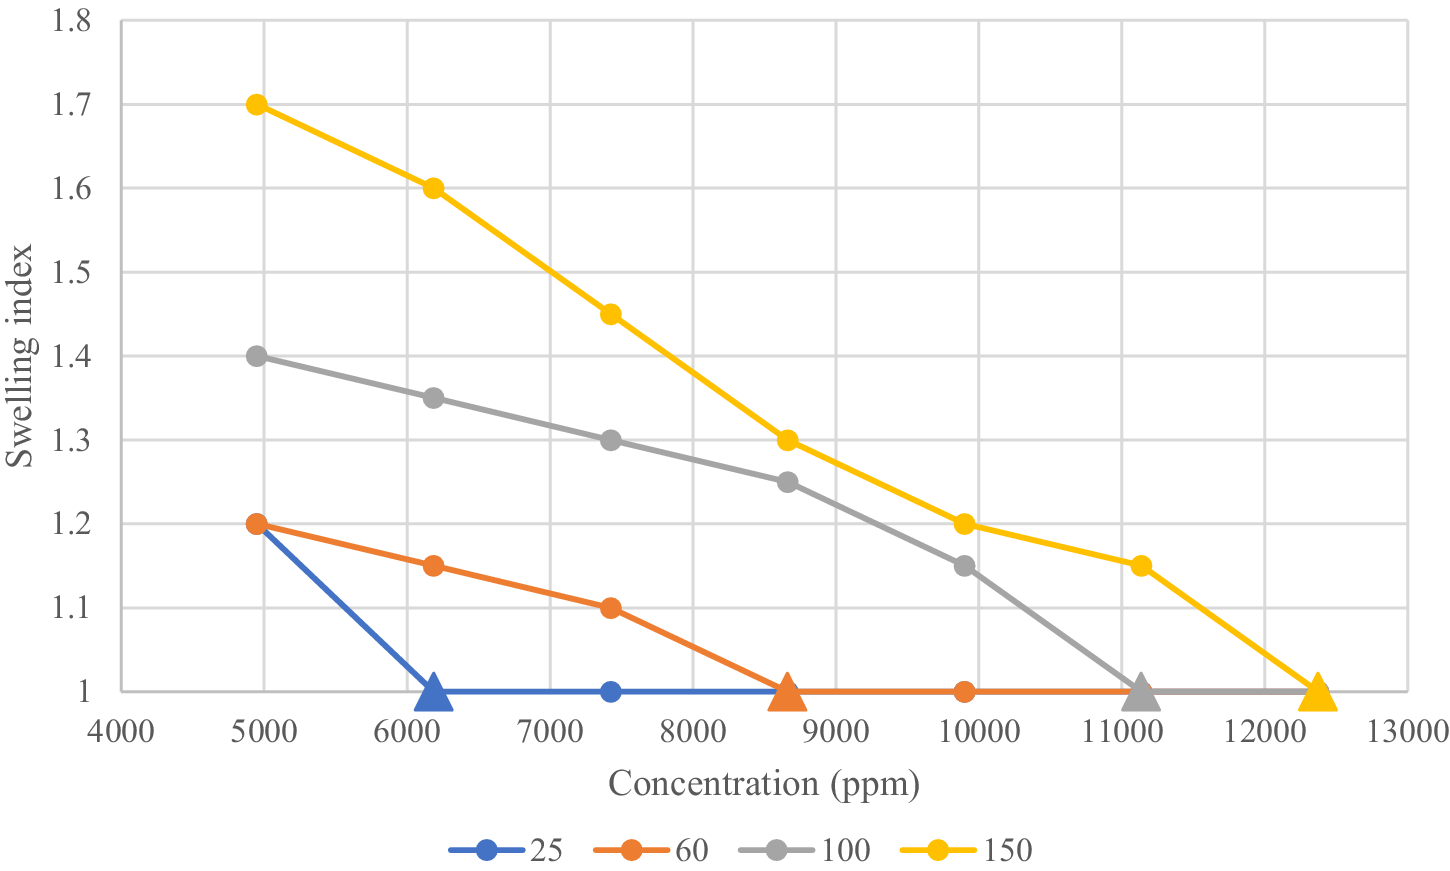
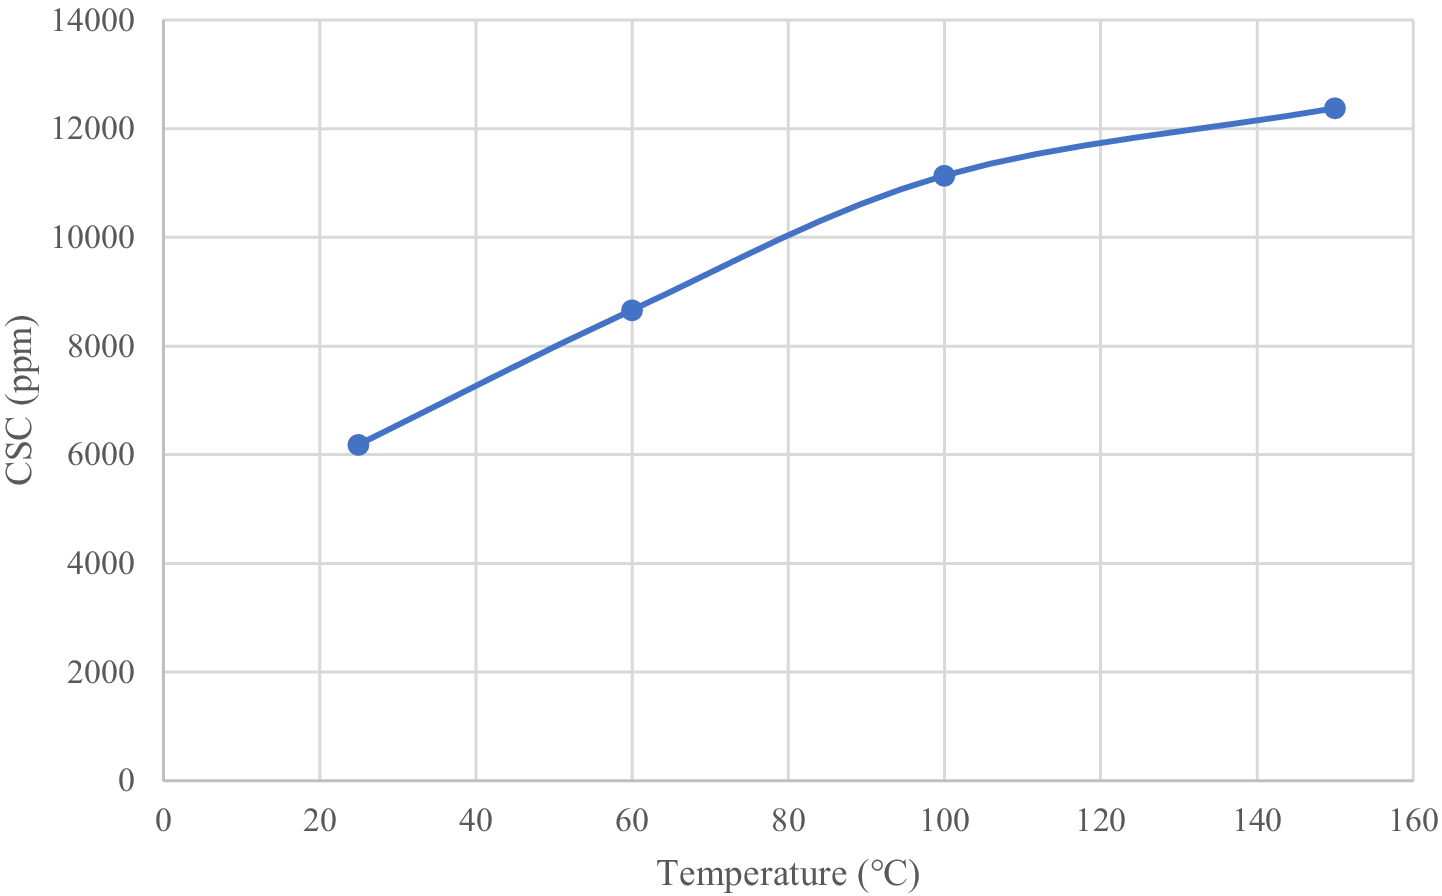
The CSC is the salinity value below which clays swell at each temperature. To determine the CSC, tests were repeated at greater salinities and various temperatures (20, 60, 100, and 150°C) to discover the conditions under which clays do not swell (Fig. 7; filled triangles indicate the CSC for each temperature). At higher temperatures, the CSC increases due to increased kinetic energy of water molecules, weakening of electrostatic forces holding clay particles together, and potential structural changes in clay minerals (Fig. 8).
Clay swelling index at elevated salinities to estimate the CSC values.

Change of CSC with temperature.

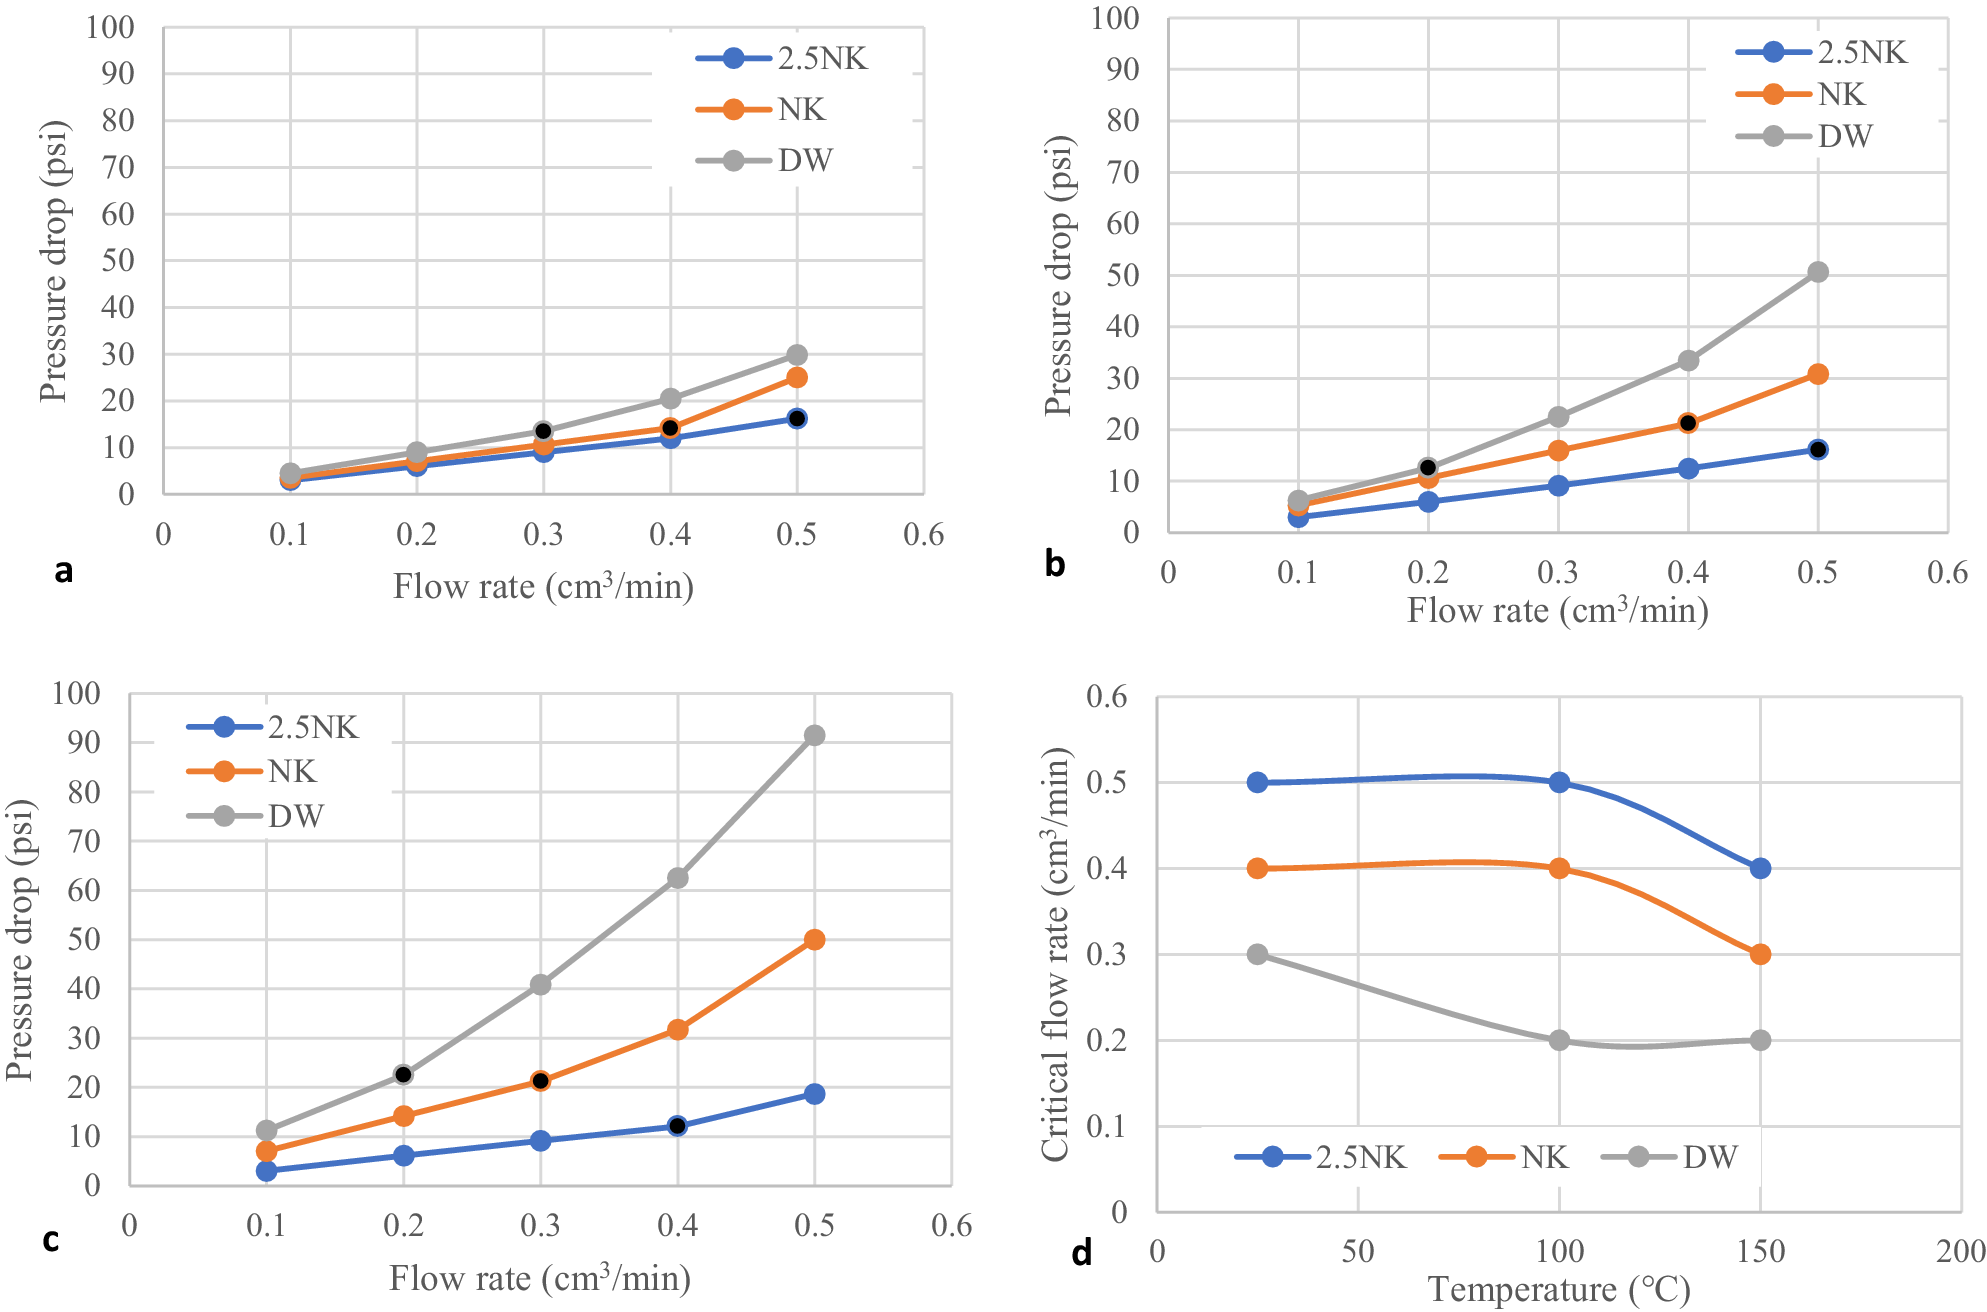
At any salinity and temperature, by increasing the fluid flow rate, clays may be detached due to the hydrodynamic forces. Hence, by analyzing the pressure drop along the porous media at various rates, CFR can be estimated. This rate is important as it affects the permeability due to the pore blockage and formation damage. At higher temperatures, electrostatic forces on clays become weaker which results in lower CFR. The results showed the higher pressure drop at higher temperatures, which is evidence for the alteration in CFR (Fig. 9).
Estimation of CFR: (a) pressure drop vs flow rate at 25°C; (b) pressure drop vs flow rate at 100°C; (c) pressure drop vs flow rate at 150°C; (d) CFR at various temperatures and salinities.

The deviation in pressure drop from the straight line is due to the reduction in permeability and possible non-Darcy effect (Fig. 9a–c). Such deviations are indicators of the initiation of clay detachment in the porous medium. As the velocity increases, both drag and lifting hydrodynamic forces increase. This can lead to an elevation in the detaching torque, ultimately resulting in particle mobilization and subsequent increase in pressure drop. Lower salinity can reduce the stability of the clays by weakening repulsive forces and promoting aggregation, thereby reducing the CFR required for fines migration. In all cases, greater temperature decreased the CFR (Fig. 9d). The results obtained help in the selection of the maximum flow rate that is allowed during core-flooding tests to avoid clay detachment and to focus on the stand-alone clay swelling effect. At an injection rate of 0.2 cm3 min–1 there is no mobilization of fines under any conditions. Therefore, this rate was selected as a maximum allowable flow rate for dynamic tests.
Dynamic test experiments
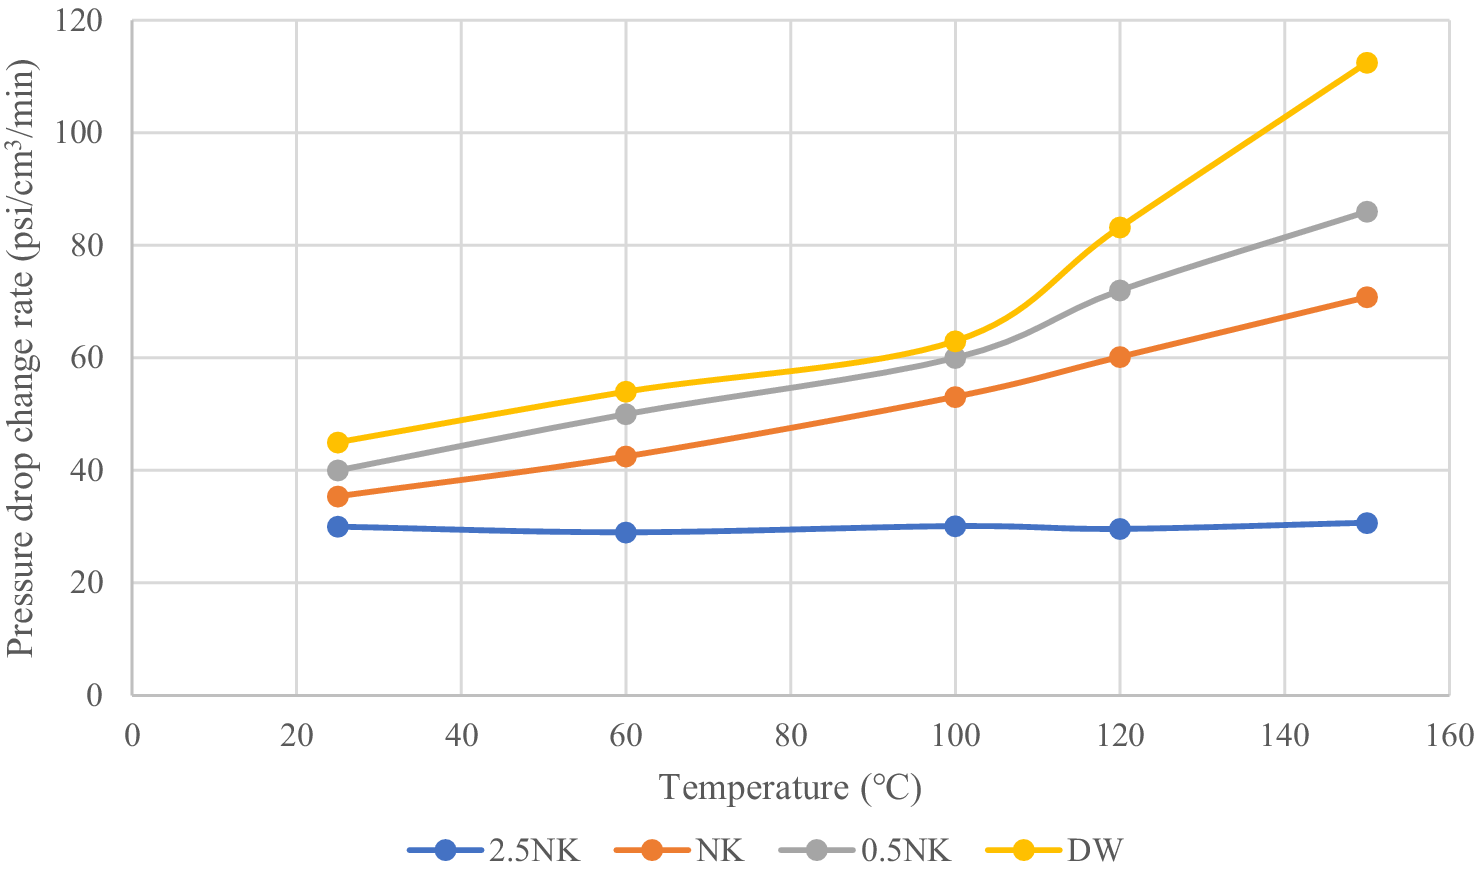
In this section, results from core-flooding tests, particularly the pressure drop at various temperatures and salinities, are presented to evaluate the alteration in permeability. The results (Fig. 10) showed that at higher temperatures, especially at 150°C, the change in pressure drop was high. Such an effect could be caused by detachment and a high degree of swelling of clay particles at low salinity flooding and high temperature.
Temperature effect on the change in pressure drop at fixed salinities.

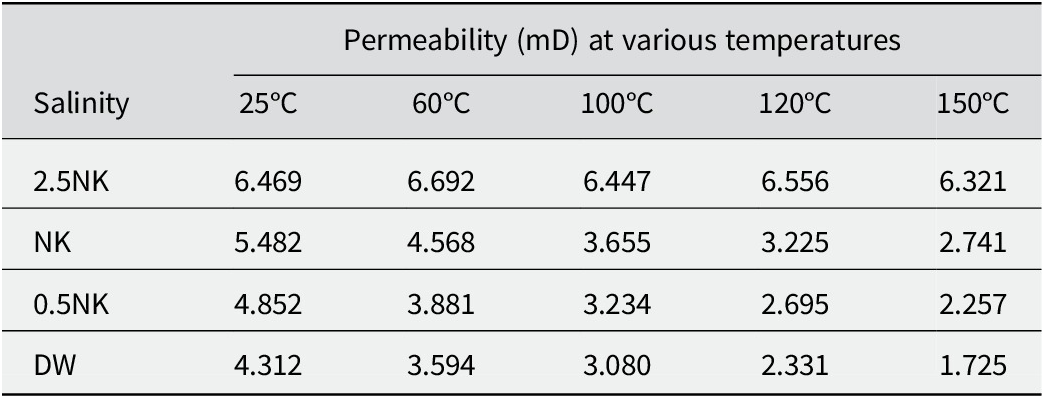
To analyze the effect of swelling on damage, at each temperature, permeability alteration was measured during brine injection at various salinities (Table 5).
Calculated permeability values at various salinities and temperatures due to clay swelling

From the calculated permeability values, permeability decreased with decreasing salinity. The degree of clay swelling at low-salinity flooding increased, leading to severe blockage of pore throats and subsequent reduction in permeability. A reduction in salinity from NK to 0.5NK resulted in a more pronounced degree of swelling in comparison with the transition from 0.5NK to DW. This phenomenon can be explained by the substantial swelling of the majority of clay particles during the initial stage of salinity alteration, a process that is probably augmented by the elevated temperature.
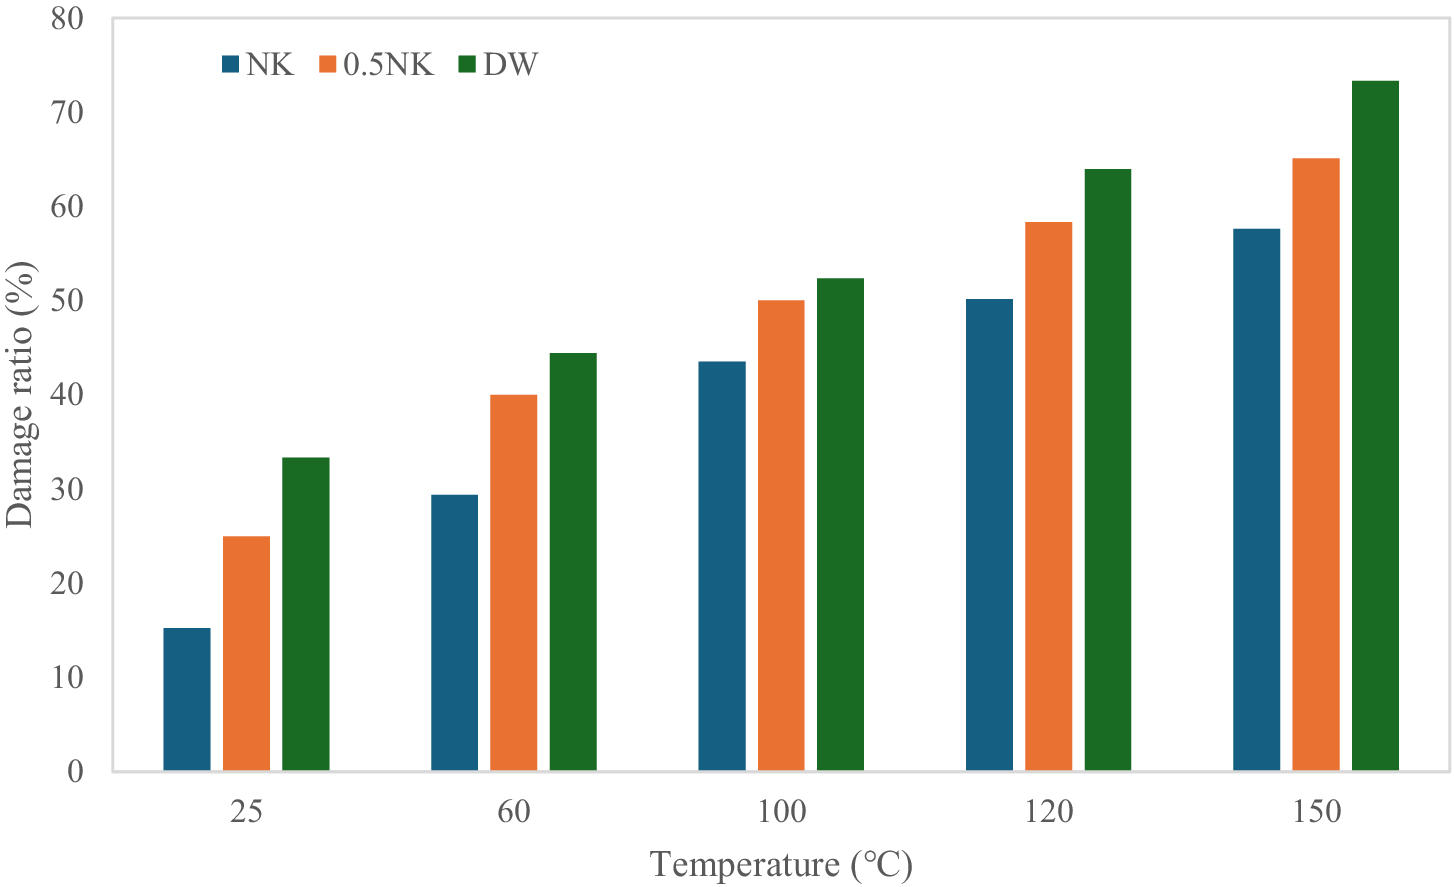
With permeability values determined, the extent of permeability damage was unveiled. The degree of permeability damage is a ratio of permeability under swelling conditions to permeability under non-swelling conditions. This degree of damage can be computed using Eqn (4):
 $$ \%\hskip0.42em \mathrm{D}\mathrm{a}\mathrm{m}\mathrm{a}\mathrm{g}\mathrm{e}=\left(\frac{k_{\mathrm{no}\hskip0.42em \mathrm{s}\mathrm{w}\mathrm{e}\mathrm{l}\mathrm{l}\mathrm{i}\mathrm{n}\mathrm{g}}}{k_{\mathrm{after}\ \mathrm{s}\mathrm{w}\mathrm{e}\mathrm{l}\mathrm{l}\mathrm{i}\mathrm{n}\mathrm{g}}}-1\right)\times 100\% $$
At high temperatures and low salinity levels, clay swelling tends to increase due to several underlying mechanisms (Fig. 11). Firstly, elevated temperatures enhanced the mobility of water molecules within the clay structure, facilitating the penetration of water into interlayer spaces. The increased water uptake led to the expansion of clay particles and subsequent swelling. Moreover, low salinity levels diminished the presence of ions in the surrounding fluid. Because ions play a crucial role in stabilizing clay particles through electrostatic interactions, a reduction in salinity weakens these interactions. Consequently, the clay particles become more susceptible to swelling as the repulsive forces between them intensify. Additionally, at higher temperatures, the thermal energy disrupted the bonds holding clay particles together, making them more prone to swelling. This effect is particularly notable in smectite clays which are known to exhibit significant swelling behavior in response to temperature changes. Elevated temperatures can accelerate chemical reactions within the clay-water system, potentially leading to the dissolution of certain minerals or the alteration of clay mineral properties. These reactions may further contribute to swelling by modifying the composition and structure of the clay minerals. Overall, the combination of elevated temperature and low salinity creates conditions conducive to clay swelling by promoting water uptake and weakening electrostatic interactions.
The proportion of permeability damage at various temperatures and salinities.

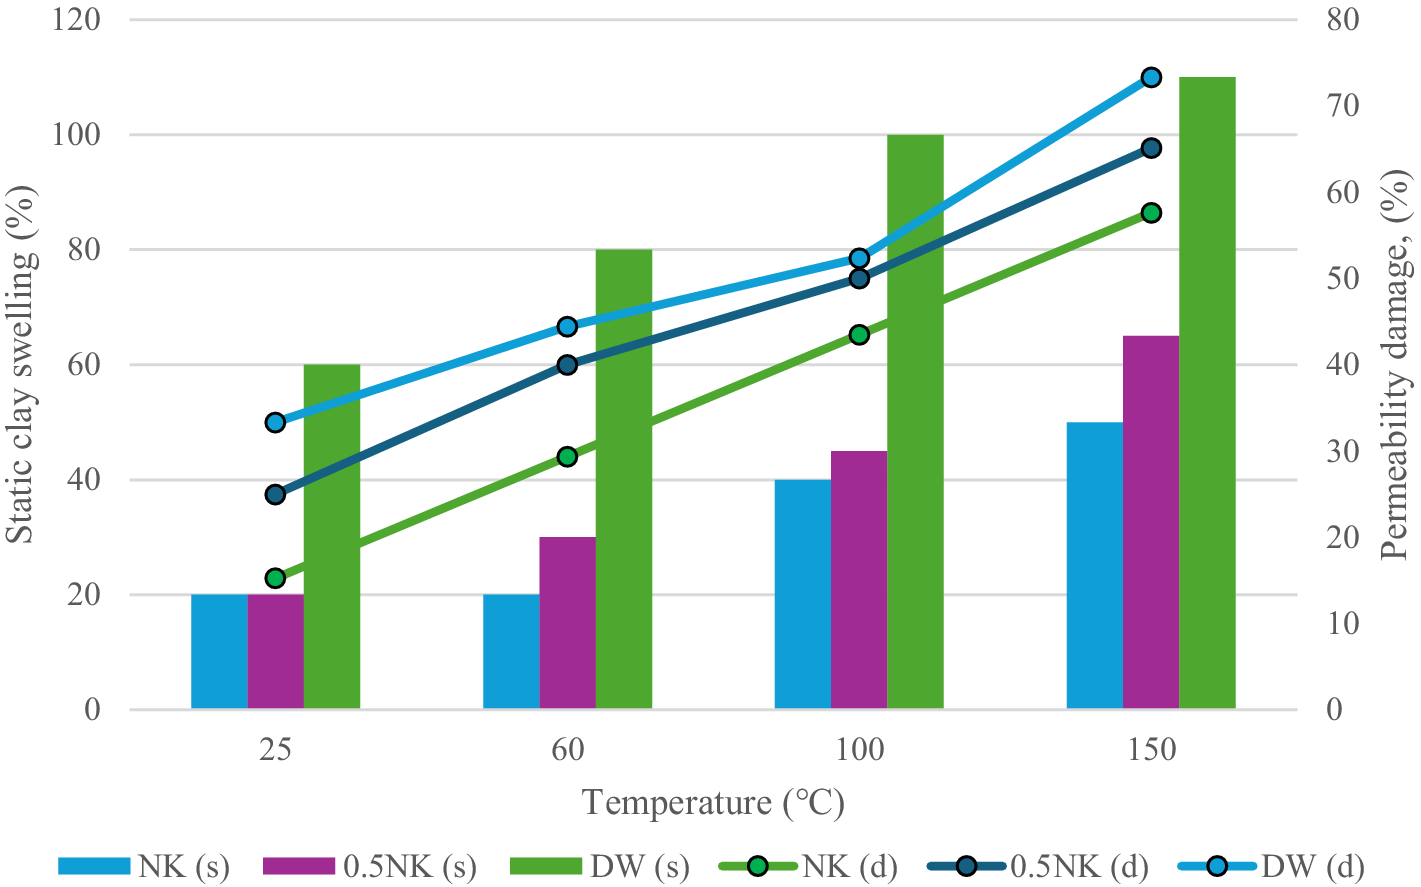
The degrees of clay swelling in static and dynamic tests were compared in order to analyze the consistency of the results obtained. The degree of static swelling of clays can be expressed in terms of expansion percentage and thereby compared with the percentage of permeability damage in sandpacks during dynamic tests. The results were compared over various temperature and salinity ranges. An increase in temperature and decrease in water salinity amplified the degree of clay swelling during both static and dynamic tests (Fig. 12).
Clay swelling at various temperatures and salinities by static (s) and dynamic (d) tests.

The degree of damage in static clay swelling was much greater than that revealed during core flooding at lower salinities, such as DW. The sandpack consisted of 40% clay and 60% sand while during the static test, 100% clay content was used for experiments. Hence, the observed clay swelling was more severe. On the other hand, for 0.5NK and NK salinities the degree of damage was similar for both static and dynamic tests. The presence of non-swelling fines such as quartz in the sandpack sample may have influenced the interactions between clay minerals and the surrounding fluid. For instance, the presence of quartz surfaces may alter the distribution of ions in the pore fluid, affecting the swelling behavior of clay minerals. These interaction effects could potentially exacerbate the degree of damage caused by clay swelling in mixed core samples.
The core-flooding test was conducted with a step-by-step decrease in water salinity starting from 2.5NK, then NK, 0.5NK, and DW. As smectite is very sensitive to the ion concentration of the injecting fluid, most clay particles expanded during the first flush with NK and 0.5NK flooding, leaving less space for swelling during DW flooding.
Overall, both tests demonstrated that clay swelling increased at low salinities and high temperatures. These findings support the notion that implementing steam flooding in this oil field in Kazakhstan, and other similar fields with large clay contents, could result in significant formation damage due to clay swelling. The fluid temperature influenced the clay swelling behavior significantly, particularly at low salinities. The CSC increased at elevated temperatures, indicating an earlier clay swelling during thermal EOR. Furthermore, temperatures exceeding 100°C could result in fines dissolution and clay flocculation, exacerbating the degree of damage. Injecting fluids at flow rates surpassing the CFR could further enhance escalate damage by detaching clay minerals due to excessive hydrodynamic forces exerted at high flow rates.
It is crucial, therefore, to monitor clay swelling closely under high-temperature, low-salinity (HTLS) conditions, as they could pose significant challenges during field operations. The findings from the present study provide valuable insights that should enable a thorough analysis of this issue. It is imperative to consider the interplay between various factors such as mineralogy, fluid composition, and reservoir conditions when addressing clay swelling in HTLS environments. Moreover, implementing preventative measures and mitigation strategies based on a comprehensive understanding of these interactions may enhance the efficiency and sustainability of future production in this oil field.
Summary and conclusions
The present study assessed smectite-illite swelling behavior in Kazakhstan oil reservoirs during thermal EOR under a range of fluid salinity and temperature conditions through static and dynamic core-flooding tests. Notable findings included:
-
• The clay experienced its greatest expansion (2.25×) at 200°C with distilled water (DW) saturation, attributed to increased double-layer repulsion with increasing temperature. Minimal change in clay swelling occurred between 25 and 60°C.
-
• High temperature weakens the forces holding the clay particles together, thereby promoting greater molecular movement and facilitating incorporation of water into the clay structure, leading to increases in the CSC value. Temperature affected CFR significantly; it decreased from 0.4 cm3 min–1 at 25°C to 0.2 cm3 min–1 at 100°C.
-
• Permeability decreased at low salinity and high temperature. The maximum permeability drop was observed at 150°C. Static tests exhibited greater levels of damage under DW compared with dynamic tests, notably at 100°C. Overall, both static and dynamic tests highlighted increased clay swelling at low salinities and high temperatures, which shows the importance of this type of damage during EOR processes such as steam flooding.