1 Introduction
The threshold condition needed to dislodge particles, which are initially at rest on a surface, due to a fluid flow is important in a wide range of physical systems and industries. Examples include wind-blown dynamics of sand dunes, erosion of sediments and rocks on river beds and ocean floors, deposition of proppants in hydraulic fracturing of shales, and drug delivery via inhalation. In spite of a long-standing interest in such problems (see Shields Reference Shields1936; Buffington & Montgomery Reference Buffington and Montgomery1997), the conditions under which particles are dislodged by a fluid flow are not well established quantitatively. The Shields number, given by the ratio of the hydrodynamic drag and gravitational force acting on the particles at the surface, is often used to characterize the physical conditions at the threshold of motion (see Shields Reference Shields1936; Wiberg & Smith Reference Wiberg and Smith1987; Buffington & Montgomery Reference Buffington and Montgomery1997). When this number exceeds a value corresponding to an effective friction, the fluid is considered to dislodge the particles. This appears to imply that the condition to dislodge a particle can be characterized by considering the mean forces acting on the particle alone (see Phillips Reference Phillips1980; Wiberg & Smith Reference Wiberg and Smith1987). Accordingly, the recorded Shields number at the threshold of motion has been reported over a wide range of Reynolds numbers estimated at the particle scale and shows broad trends with considerable scatter (see Buffington & Montgomery Reference Buffington and Montgomery1997) that depend on bed preparation, particle size and degree of exposure to the fluid flow (see Charru, Mouilleron & Eiff Reference Charru, Mouilleron and Eiff2004; Charru et al. Reference Charru, Larrieu, Dupont and Zenit2007; Ouriemi et al. Reference Ouriemi, Aussillous, Medale, Peysson and Guazzelli2007; Hong, Tao & Kudrolli Reference Hong, Tao and Kudrolli2015; Clark et al. Reference Clark, Shattuck, Ouellette and O’Hern2015).
A spherical particle resting on a rough surface in a linear sheared fluid flow is an important model to understand the threshold of motion of a particle exposed to a fluid flow. A recent analysis of this model by Lee & Balachandar (Reference Lee and Balachandar2012) appears to suggest that torques, and not just the forces, can be important in determining the onset of particle motion in sheared fluid flow. In the case of sufficiently low Reynolds numbers, the net hydrodynamic force and torque acting on a sphere attached to a smooth wall in a linear shear flow has been analytically calculated by O’Neill (Reference O’Neill1968) and Leighton & Acrivos (Reference Leighton and Acrivos1985). At moderate and higher Reynolds number, where fluid inertia is important, analytical results do not exist. However, numerical results have been obtained by Zeng et al. (Reference Zeng, Najjar, Balachandar and Fischer2009) for the drag and lift coefficients acting on a particle attached to a surface at moderate Reynolds numbers. These results indicate that both the lift and moment coefficients about the particle centre decrease relative to the drag coefficient with increasing Reynolds numbers. Thus, there is a need for further investigations to quantitatively test the relative contribution of forces and torques acting on a particle as a function of Reynolds numbers in order to clarify the conditions needed to dislodge particles in sheared fluid flows.
Here, we discuss a new experimental system that enables us to quantitatively measure the threshold of motion of a particle in a linearly sheared fluid where the fluid flow and particle motion are visualized to understand its characteristics. Model asperities with well-defined pivot points are used to investigate its importance in determining the onset of motion. We demonstrate that the torque balance condition is important in determining the threshold in laminar as well as turbulent sheared flows. Further, we quantitatively describe the critical shear rate required to dislodge a particle as a function of its physical properties using an interpolation of hydrodynamic drag and lift coefficients obtained in the viscous and inertial limits.
2 Experimental system
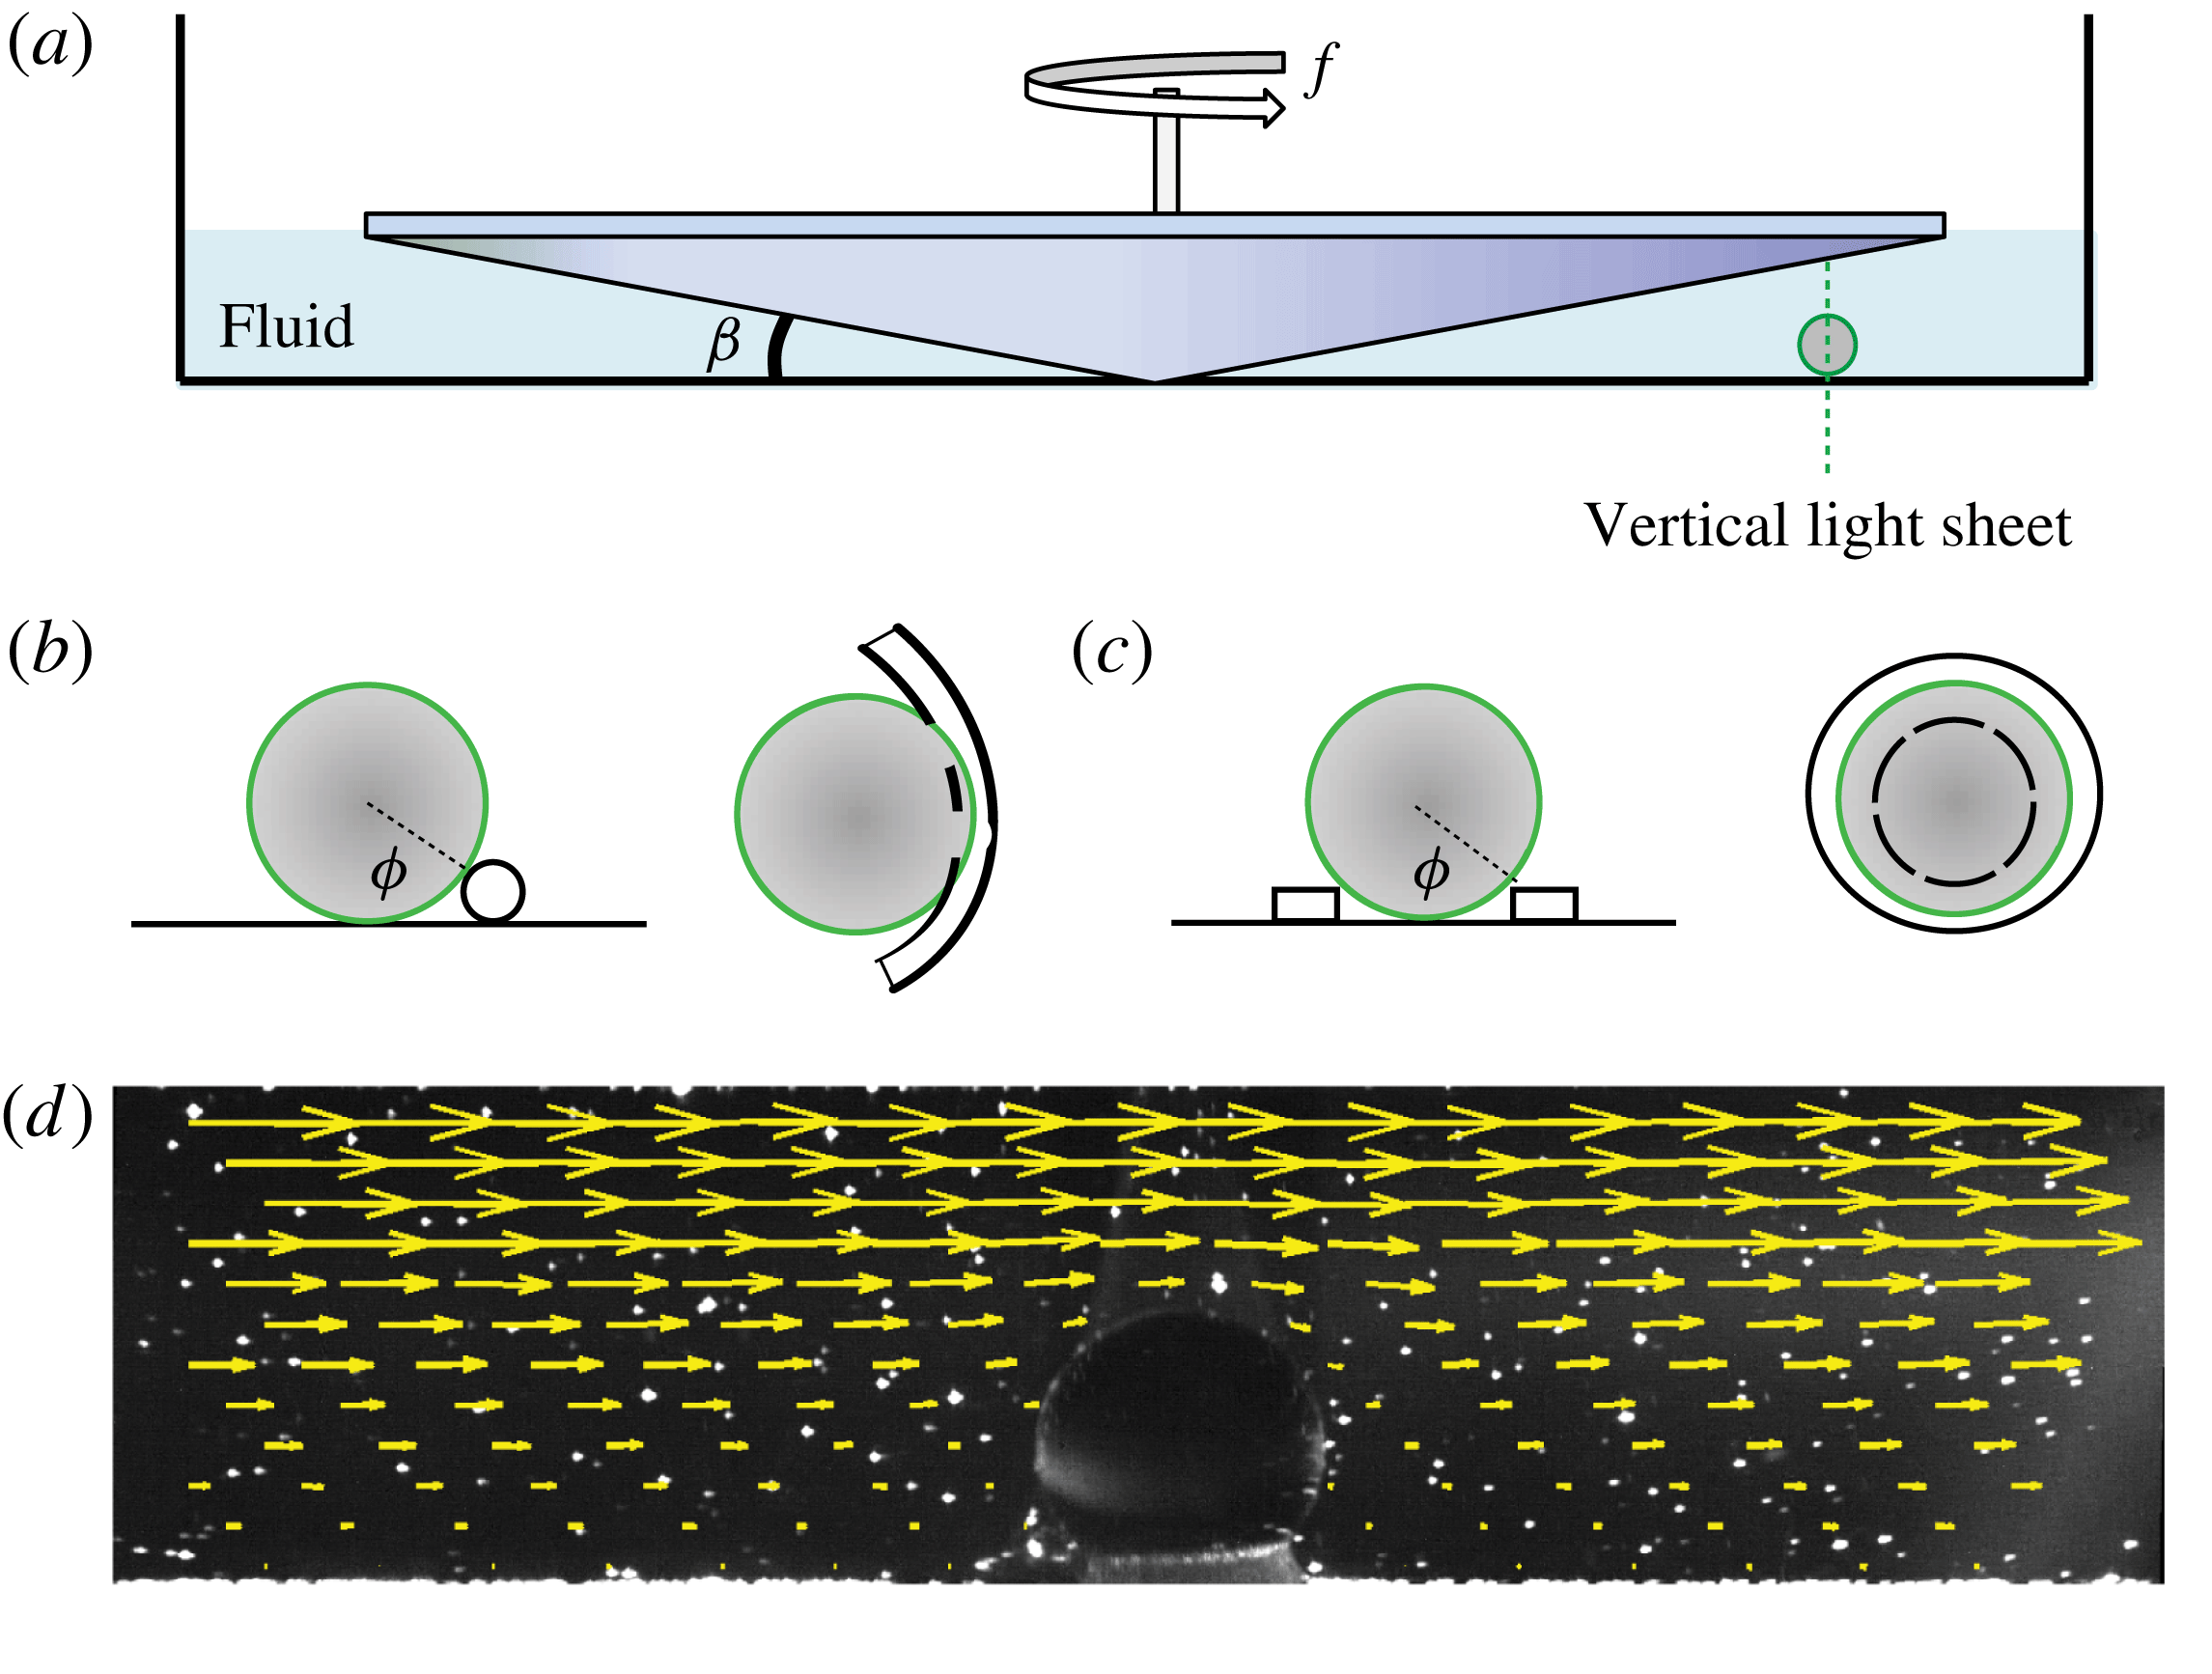
A schematic of the experimental apparatus is shown in figure 1(a). It consists of a stationary transparent cylindrical container with a flat bottom, filled with a fluid with a dynamic viscosity
 $\unicode[STIX]{x1D707}$
and density
 $\unicode[STIX]{x1D70C}_{f}$
, prepared using water and glycerol mixture ratios reported by Cheng (Reference Cheng2008). Because glycerol–water mixtures are sensitive to temperature, we performed all experiments in a room controlled to within
 $0.5^{\circ }\,\text{C}$
and with viscosity variation within
 $\pm 2$
%. This estimate is based on the errors due to the variation in the room temperature and the measurement of fluid volumes used to prepare the glycerol and water mixture. In test experiments, we did not observe any systematic errors due to evaporation or hygroscopy in the onsets (to within the fluctuations noted) for over three hours after the fluids were mixed. Therefore, to avoid any such effects, the experiments were all performed well within this time after the fluids were prepared. An inverted cone-shaped top plate, with an apex that coincides with the bottom of the container and radius
 $R=95$
mm, is rotated about its axis at a prescribed frequency
 $f$
, similar to a conical rheometer. The flows in this geometry have been studied extensively (see for example Sdougos et al.
Reference Sdougos, Bussolari and Dewey1984), with the primary flow being concentric with the axis of rotation and increasing linearly from the bottom to the top plate. The corresponding shear rate is given by
 $\dot{\unicode[STIX]{x1D6FE}}=2\unicode[STIX]{x03C0}f/\tan \unicode[STIX]{x1D6FD}$
, where
 $\unicode[STIX]{x1D6FD}$
is the angle complementary to the cone apex angle. A weak radial secondary flow also occurs, which is inward near the flat surface and outward near the cone surface, that increases with the flow Reynolds number given by
 $Re=\unicode[STIX]{x1D70C}_{f}\dot{\unicode[STIX]{x1D6FE}}R^{2}\tan \unicode[STIX]{x1D6FD}/2\unicode[STIX]{x1D707}$
, which corresponds to the fluid velocity at the midpoint between the top plate and the bed surface.
(a) A schematic diagram of the apparatus. The conical top plate spins about its vertical central axis with a prescribed frequency
 $f$
, resulting in a uniform shear rate
 $\dot{\unicode[STIX]{x1D6FE}}=2\unicode[STIX]{x03C0}f/\tan \unicode[STIX]{x1D6FD}$
. A vertical light sheet through the particle is used for visualization. (b) Cross-sectional and top view of a spherical particle lodged against a rod which is bent into a U-shaped pocket. The line joining the centre of the sphere and the point of contact with the asperity makes an angle
 $\unicode[STIX]{x1D719}$
with respect to the vertical axis. (c) Cross-sectional and top view of a spherical particle lodged inside a circular pocket. (d) Flow field, observed using particle image velocimetry (PIV), corresponding to
 $Re_{p}=0.1$
superimposed on a sample image.

In order to test the relative effects of gravity, inertia and viscosity, we use spherical particles composed of Delrin, polytetrafluoroethylene (PTFE), glass, aluminium, ceramic, titanium and stainless steel with densities
 $\unicode[STIX]{x1D70C}_{s}=1400$
, 2170, 2500, 2700, 3875, 4512 and 7960 kg m
 $^{-3}$
, respectively. Although a range of particle diameters were probed, we discuss the data only for
 $d=3.175\pm 0.005$
mm for simplicity of presentation. The Reynolds number at the particle scale
 $Re_{p}$
is defined by using the velocity
 $v=\dot{\unicode[STIX]{x1D6FE}}d/2$
corresponding to the centre of the particle. Then,
 $$\begin{eqnarray}Re_{p}=\frac{\unicode[STIX]{x1D70C}_{f}\dot{\unicode[STIX]{x1D6FE}}d^{2}}{2\unicode[STIX]{x1D707}}=\frac{\unicode[STIX]{x1D70C}_{f}\unicode[STIX]{x03C0}fd^{2}}{\unicode[STIX]{x1D707}\tan \unicode[STIX]{x1D6FD}}.\end{eqnarray}$$
Two kinds of model asperities were used, including a rod bent into a U-shaped pocket, illustrated in figure 1(b), and a circular pocket using a flat ring, illustrated in figure 1(c). The angle
 $\unicode[STIX]{x1D719}$
subtended by the line joining the particle centre and the pivot point from the vertical characterizes the barrier size relative to the particle size in both cases. The U shape allows the particle to be fully exposed to the fluid flow while also allowing it to move freely in the pocket. This causes the particle to rattle inside the pocket when the flow becomes time-dependent at higher
 $Re_{p}$
, as shown in supplementary movie 1 available at https://doi.org/10.1017/jfm.2016.655. In contrast, the circular pocket geometry causes the particle to be confined in all directions inside the pocket and it is observed to be stationary at both high and low
 $Re_{p}$
before getting dislodged, as shown in movie 2. Because the bottom of the sphere is shielded by the ring, the particle is partially exposed to the fluid flow as in a granular bed. This leads to an approximate 10 % and 7 % lowering of the drag coefficients
 $C_{d}$
and
 $C_{o}$
, respectively, for a circular pocket with
 $\unicode[STIX]{x1D719}=38^{\circ }$
compared to a fully exposed particle, using estimates obtained by Pozrikidis (Reference Pozrikidis1997) for low-
 $Re_{p}$
flows.
The measured critical shear rate
 $\dot{\unicode[STIX]{x1D6FE}_{c}}$
as a function of fluid height
 $h/d$
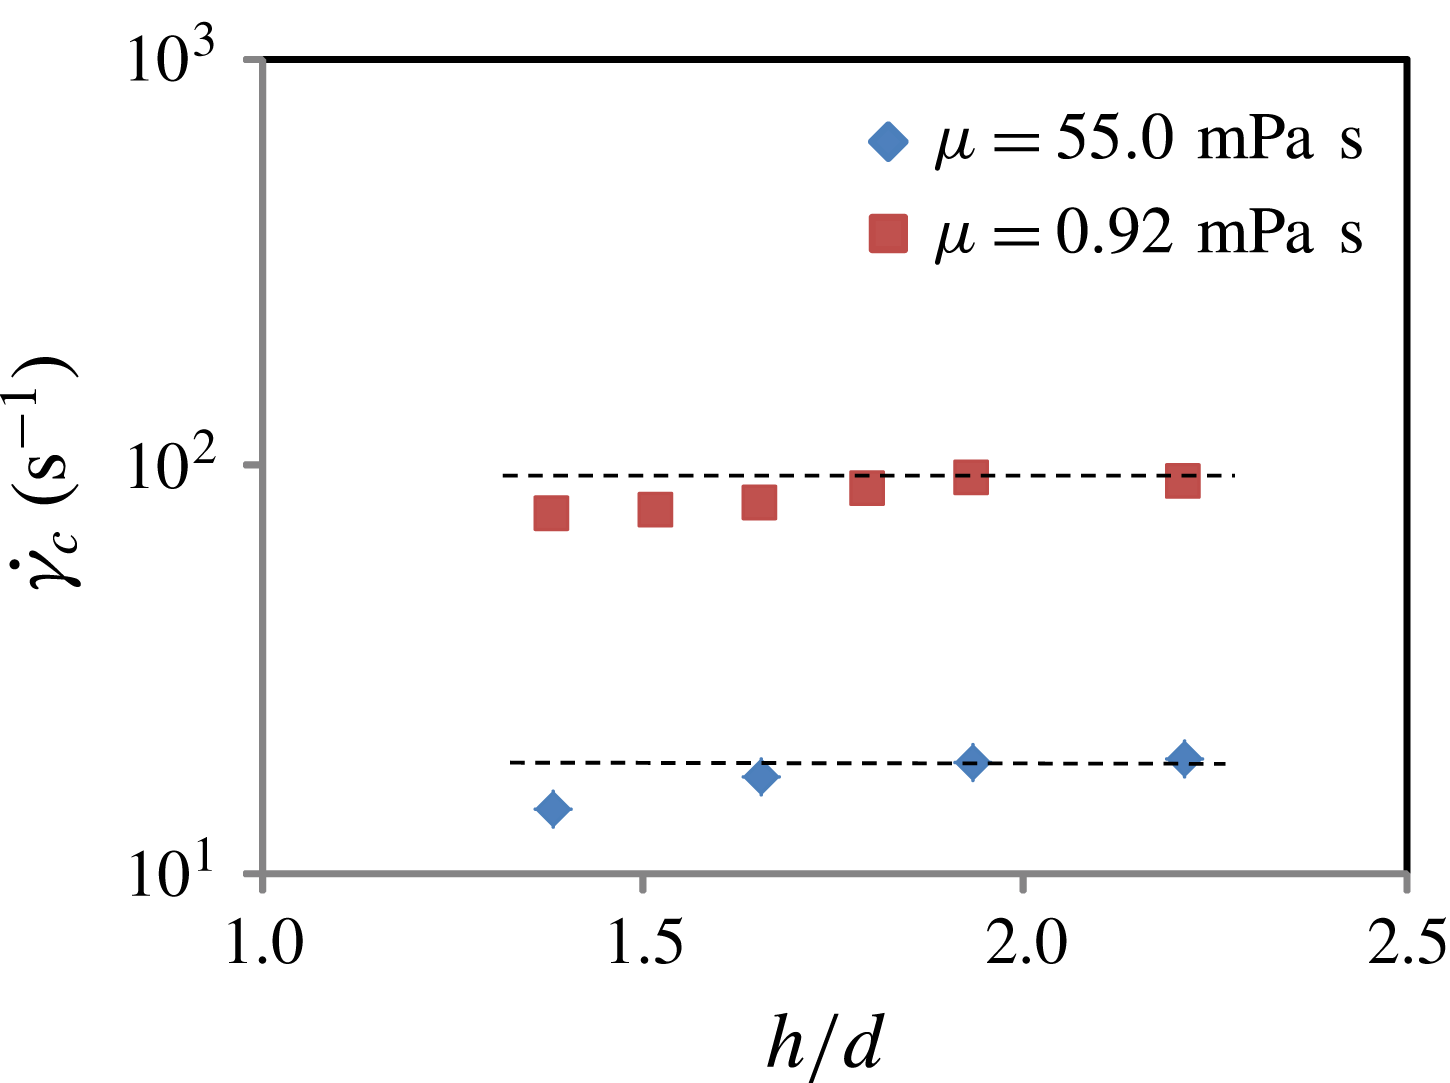
required to dislodge a PTFE particle. We observe that
 $\dot{\unicode[STIX]{x1D6FE}_{c}}$
is essentially constant for
 $h/d\gtrsim 2$
in the case of both low- and high-viscosity fluids used in the experiments. The horizontal dashed lines are guides to the eye.

Further, because the fluid velocity has to match the velocity of the spinning top boundary, the proximity of the top boundary can lead to a greater drag coefficient, at least at low Reynolds numbers, compared to unbounded flows (see Happel & Brenner Reference Happel and Brenner1973). We varied the distance
 $r_{b}$
between the particle and the axis of rotation to understand the effect of the top boundary for high- and low-viscosity fluids used in our experiments. Because of the slope of the top surface, this results in a gap height
 $h=r_{b}\tan \unicode[STIX]{x1D6FD}$
between the top boundary and the container bottom. The measured
 $\dot{\unicode[STIX]{x1D6FE}_{c}}$
as a function of
 $h$
is shown in figure 2. Indeed, we observe that
 $\dot{\unicode[STIX]{x1D6FE}_{c}}$
is lower for
 $z/d<2$
, but remains essentially constant for
 $z/d\gtrsim 2$
for both low- and high-viscosity fluids used in the experiments. Accordingly, we have confined our discussion to
 $h=2d$
, which corresponds to the particle being placed at a distance
 $r_{b}=7$
cm from the axis of rotation, where the direct effect of the top surface can be expected to be small.
3 Flow visualization
In order to characterize the nature of the flow, we performed experiments with tracer particles added to a glycerol–water mixture, corresponding to
 $\unicode[STIX]{x1D70C}_{f}=1100$
kg m
 $^{-3}$
and
 $\unicode[STIX]{x1D707}=3$
mPa s, in which the tracers are neutrally buoyant. The fluid was illuminated with a light sheet which transects the particle in a vertical plane through its centre. In the case of sufficiently slow flows, we use particle image velocimetry (PIV) to obtain the fluid flow with a sequence of images acquired at 2 frames per second, and analyse the images using the shareware computer program OpenPIV (http://www.openpiv.net/). An example of which is shown in figure 1(d) for low
 $Re_{p}$
. The fluid velocity shown by the length of the arrows can be noted to be symmetric about the vertical axis and increase linearly in regions away from the sphere. The measured shear rate from PIV is found to be within 5.5 % of that calculated using the rotation rate of the top plate.
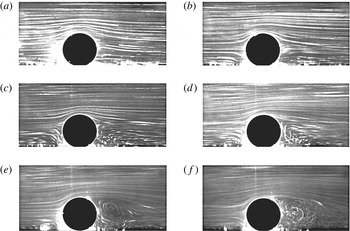
The fluid flow observed around a spherical particle glued to the substrate visualized with tracer particles. The exposure time is 1.0 s. (a)
 $f=0.01$
Hz,
 $Re=30$
and
 $Re_{p}=0.7$
, (b)
 $f=0.03$
Hz,
 $Re=91$
and
 $Re_{p}=2.2$
, (c)
 $f=0.1$
Hz,
 $Re=304$
and
 $Re_{p}=7.3$
, (d)
 $f=0.3$
Hz,
 $Re=916$
and
 $Re_{p}=22$
, (e)
 $f=1.0$
Hz,
 $Re=3041$
and
 $Re_{p}=73$
, and (f)
 $f=3.0$
Hz,
 $Re=9160$
and
 $Re_{p}=220$
. The flow is symmetric at low
 $Re_{p}$
and vortices develop as
 $Re_{p}$
is increased, with a vortex clearly developing in the wake at
 $Re_{p}\sim 20$
. The flow in the wake clearly becomes time-dependent at
 $Re_{p}=220$
. A smaller vortex in front of the sphere is observed for
 $Re_{p}\geqslant 22$
. (See supplementary movies.)

The flow structure at higher
 $Re_{p}$
can be deduced by examining the streaks made by the tracers over one second in figure 3 and the corresponding supplementary movie 3. One can observe that the flow is essentially symmetric for
 $Re_{p}\sim 1$
, but grows asymmetric as
 $Re_{p}$
is increased. A vortex can clearly be observed at
 $Re_{p}\sim 20$
, and the wake grows and becomes time-dependent for
 $Re_{p}\sim 220$
. Further, one also observes the development of a smaller vortex for
 $Re_{p}\geqslant 22$
in the front of the sphere near the substrate (see movie 3). In all cases, the flow well in front of the particle appears to be laminar, and the eddies generated by the flow around the particle have decayed by the time the fluid flow returns after going around the circular track over the range of
 $Re_{p}$
visualized.
We also tested the effect of the secondary flows that can arise in this system at high
 $Re$
. In particular, we examined the departure angle of the particles from the azimuthal direction when they are dislodged over a U-shaped barrier, by visualizing the system through the transparent bottom of the container. By measuring the departure angle for all the particles used in our study, we find angles from the azimuthal direction to vary between
 $-1.5^{\circ }$
and
 $7.5^{\circ }$
when
 $Re_{p}$
is varied between 40 and 243. Such a variation would lead to a less than 2 % underestimation of the shear rate at onset, which is within the experimental error. Therefore, we conclude that secondary flows are negligible in determining the main trends observed in the study.
4 Measured critical shear rate
With this characterization of the flow, we now discuss the measured critical shear rate
 $\dot{\unicode[STIX]{x1D6FE}_{c}}$
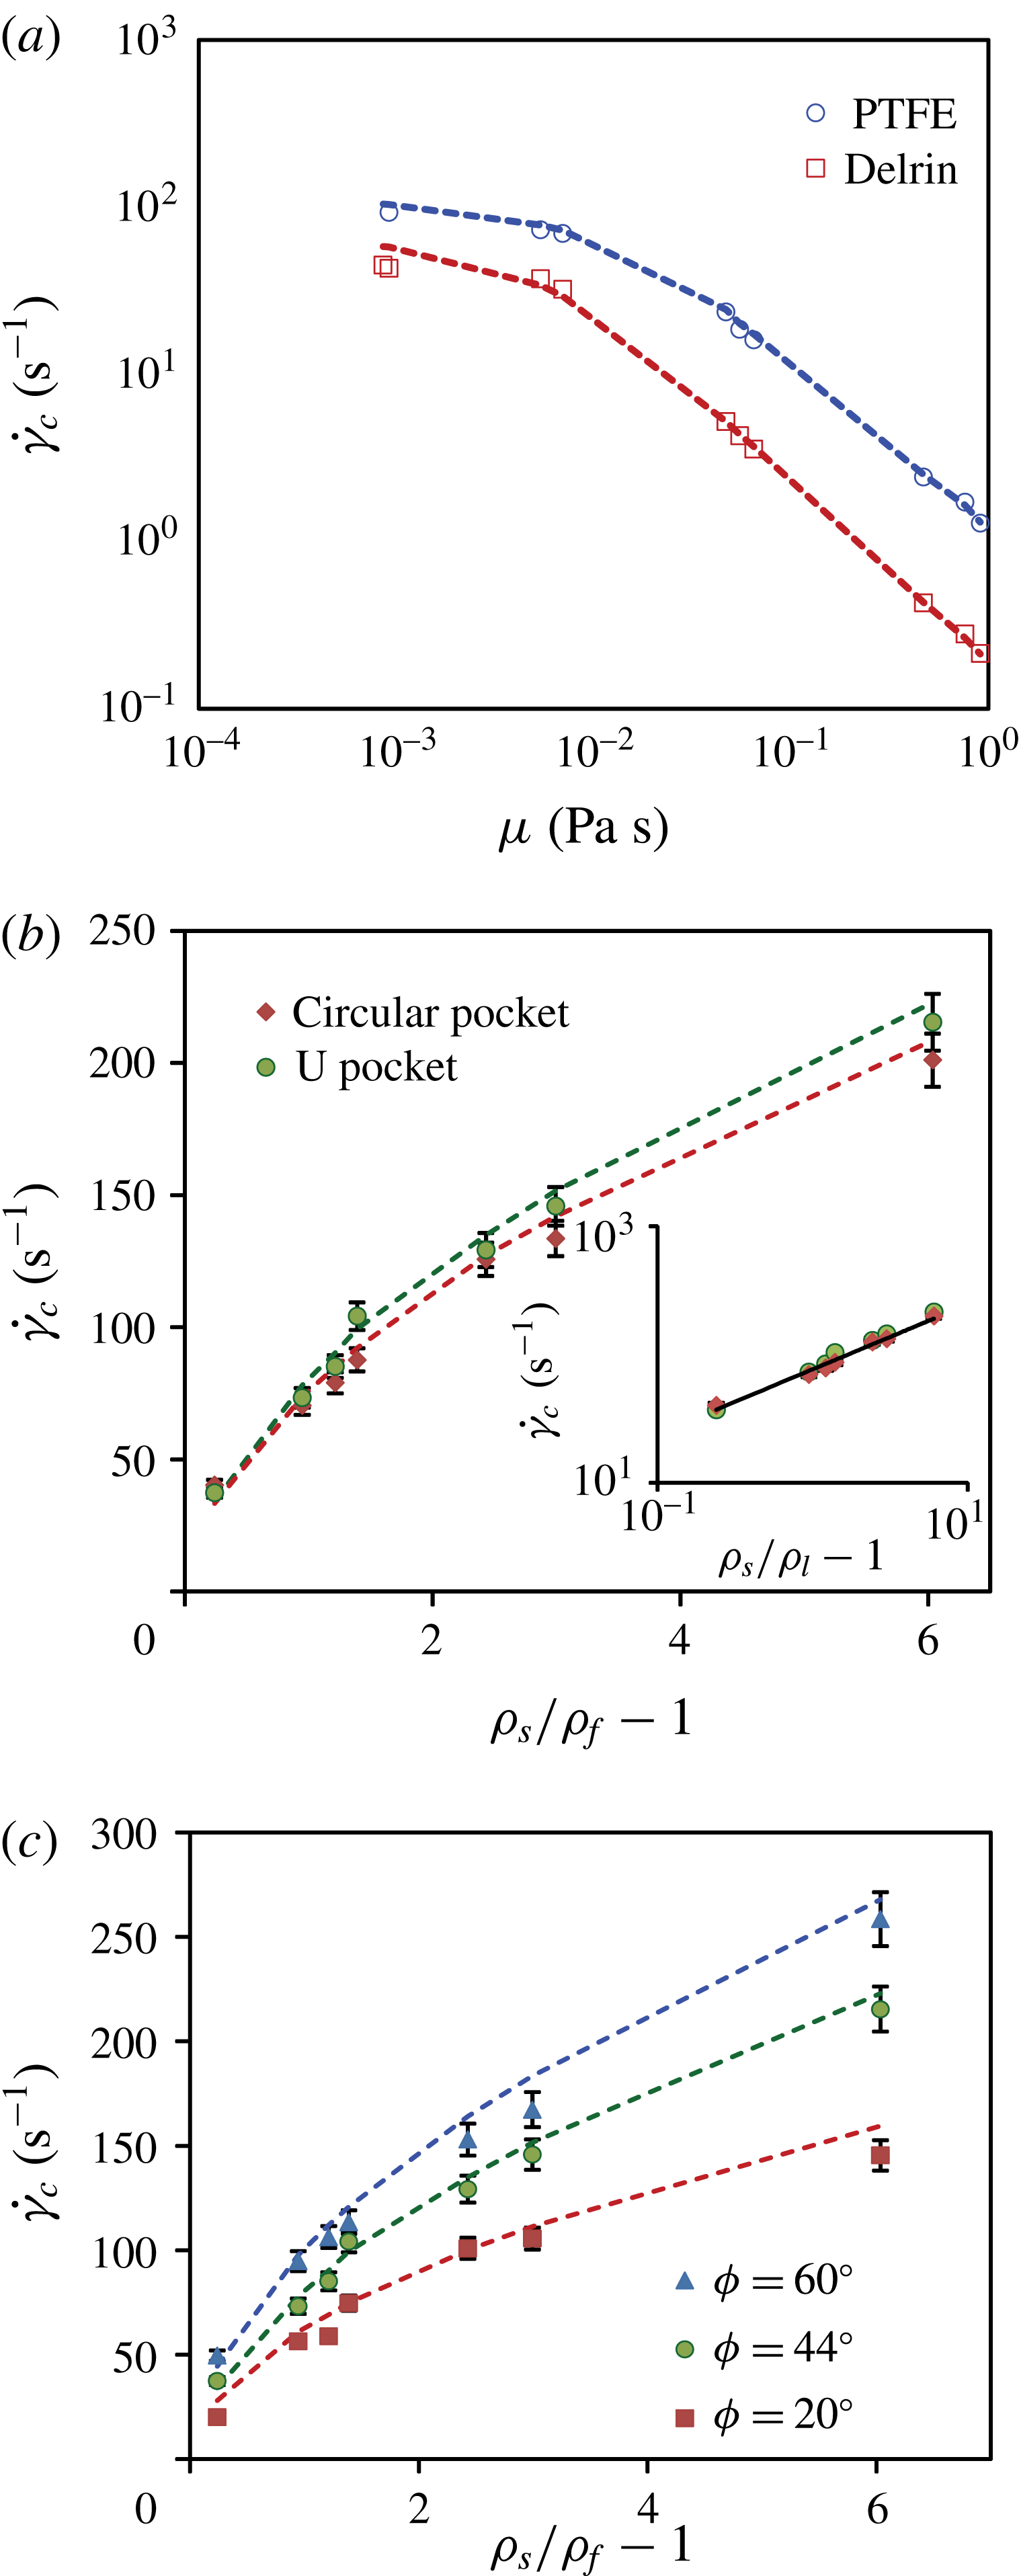
as a function of the experimental control parameters. Figure 5(a) shows
 $\dot{\unicode[STIX]{x1D6FE}_{c}}$
as a function of
 $\unicode[STIX]{x1D707}$
, corresponding to a U-shaped pocket with
 $\unicode[STIX]{x1D719}=44^{\circ }$
. Each data point corresponds to three independent measurements, and the error is less than 5 %. The data were obtained by linearly increasing the rotation frequency of the top plate to a prescribed value
 $f$
, then holding it constant for a fixed waiting time of 100 s. The threshold is reached if the particle is observed to roll out over the barrier during this waiting time interval. The particle was observed to move and dislodge immediately after the threshold was reached at low
 $Re_{p}$
. However, the particle was observed to rattle inside the pocket and dislodge after a few seconds in the case of the U-shaped pocket when
 $Re_{p}\gtrsim 10$
. In the case of a circular pocket, no such rattling was observed, and the particle dislodged right after first moving. We also found that using a longer waiting time did not lead to a systematic change in the measured threshold. However, decreasing the waiting time increased the threshold somewhat. Because we are interested in the long-time behaviour, we have used a waiting time of 100 s for consistency.
We observe that
 $\dot{\unicode[STIX]{x1D6FE}_{c}}$
decreases systematically because the drag can be expected to increase with
 $\unicode[STIX]{x1D707}$
. Further,
 $\dot{\unicode[STIX]{x1D6FE}_{c}}$
is observed to be systematically higher for PTFE because it has a higher density than Delrin. To further probe the trends with respect to the density of the particle, we plot
 $\dot{\unicode[STIX]{x1D6FE}_{c}}$
as a function of
 $\unicode[STIX]{x1D70C}_{s}/\unicode[STIX]{x1D70C}_{f}-1$
in figure 5(b), corresponding to
 $\unicode[STIX]{x1D707}=5.2$
mPa s, and where the data correspond to
 $Re_{p}>10$
. From the log–log plot in the corresponding inset, we observe that
 $\dot{\unicode[STIX]{x1D6FE}_{c}}$
increases consistent with a square root function. We have also plotted data corresponding to a barrier with a circular pocket, and we observe similar trends. Finally, we have plotted
 $\dot{\unicode[STIX]{x1D6FE}_{c}}$
in figure 5(c) for various
 $\unicode[STIX]{x1D719}$
, and find higher
 $\dot{\unicode[STIX]{x1D6FE}_{c}}$
for higher
 $\unicode[STIX]{x1D719}$
. Thus,
 $\dot{\unicode[STIX]{x1D6FE}_{c}}$
increases systematically with greater barrier height.
5 Conditions to dislodge particle
To explain these observations, we next discuss the gravitational and hydrodynamic forces and torques acting on the particle, which are used to determine the condition for stability. The gravitational force acting on the particle, including the effect of buoyancy, is given by
 $F_{g}=(1/6)\unicode[STIX]{x03C0}(\unicode[STIX]{x1D70C}_{s}-\unicode[STIX]{x1D70C}_{f})gd^{3}$
, where
 $g$
is the acceleration due to gravity, and the corresponding torque due to gravity about the pivot point on the barrier is given by
 $T_{g}=F_{g}(d/2)\sin \unicode[STIX]{x1D719}$
. The net drag force acting on a sphere can be written as
 $F_{d}=(1/8)C_{d}\unicode[STIX]{x1D70C}_{f}v^{2}\unicode[STIX]{x03C0}d^{2}$
, where
 $C_{d}$
is the drag coefficient which depends on
 $Re_{p}$
. The torque due to drag about the centre of the particle can be written as
 $T_{o}=(1/16)C_{o}\unicode[STIX]{x1D70C}_{f}v^{2}\unicode[STIX]{x03C0}d^{3}$
, where
 $C_{o}$
is a drag coefficient which also depends on
 $Re_{p}$
. Then, the torque due to drag
 $T_{d}$
about the pivot point can be written as the sum of the torque about the centre and the net force times the projected distance from the centre to the pivot point, i.e.
 $T_{d}=T_{o}+F_{d}(d/2)\cos \unicode[STIX]{x1D719}$
. The lift due to the difference of flow velocity above and below the particle centre can be written as
 $F_{l}=(1/8)C_{l}\unicode[STIX]{x1D70C}_{f}v^{2}\unicode[STIX]{x03C0}d^{2}$
, where
 $C_{l}$
is the lift coefficient, and the corresponding torque due to the lift
 $T_{l}=F_{l}(d/2)\sin \unicode[STIX]{x1D719}$
. Because of the fore/aft asymmetry that develops in the flow, as shown in figure 3, one can further expect the effective point where the lift and drag act to shift from the vertical axis of symmetry. However, we are unaware of any previous work which discusses this effect, and we assume that the lift acts at the centre for simplicity. Further, the particle also experiences normal reaction and tangential friction forces at contact points with the substrate and the barrier. One may expect these contact forces to approach zero at the point of contact between the particle and the bottom substrate, just when the particle is about to be dislodged. However, a reaction force
 $N$
and a friction force
 $F_{\unicode[STIX]{x1D707}}$
can be expected to be present at the point of contact between the particle and the barrier even as the particle is dislodged.
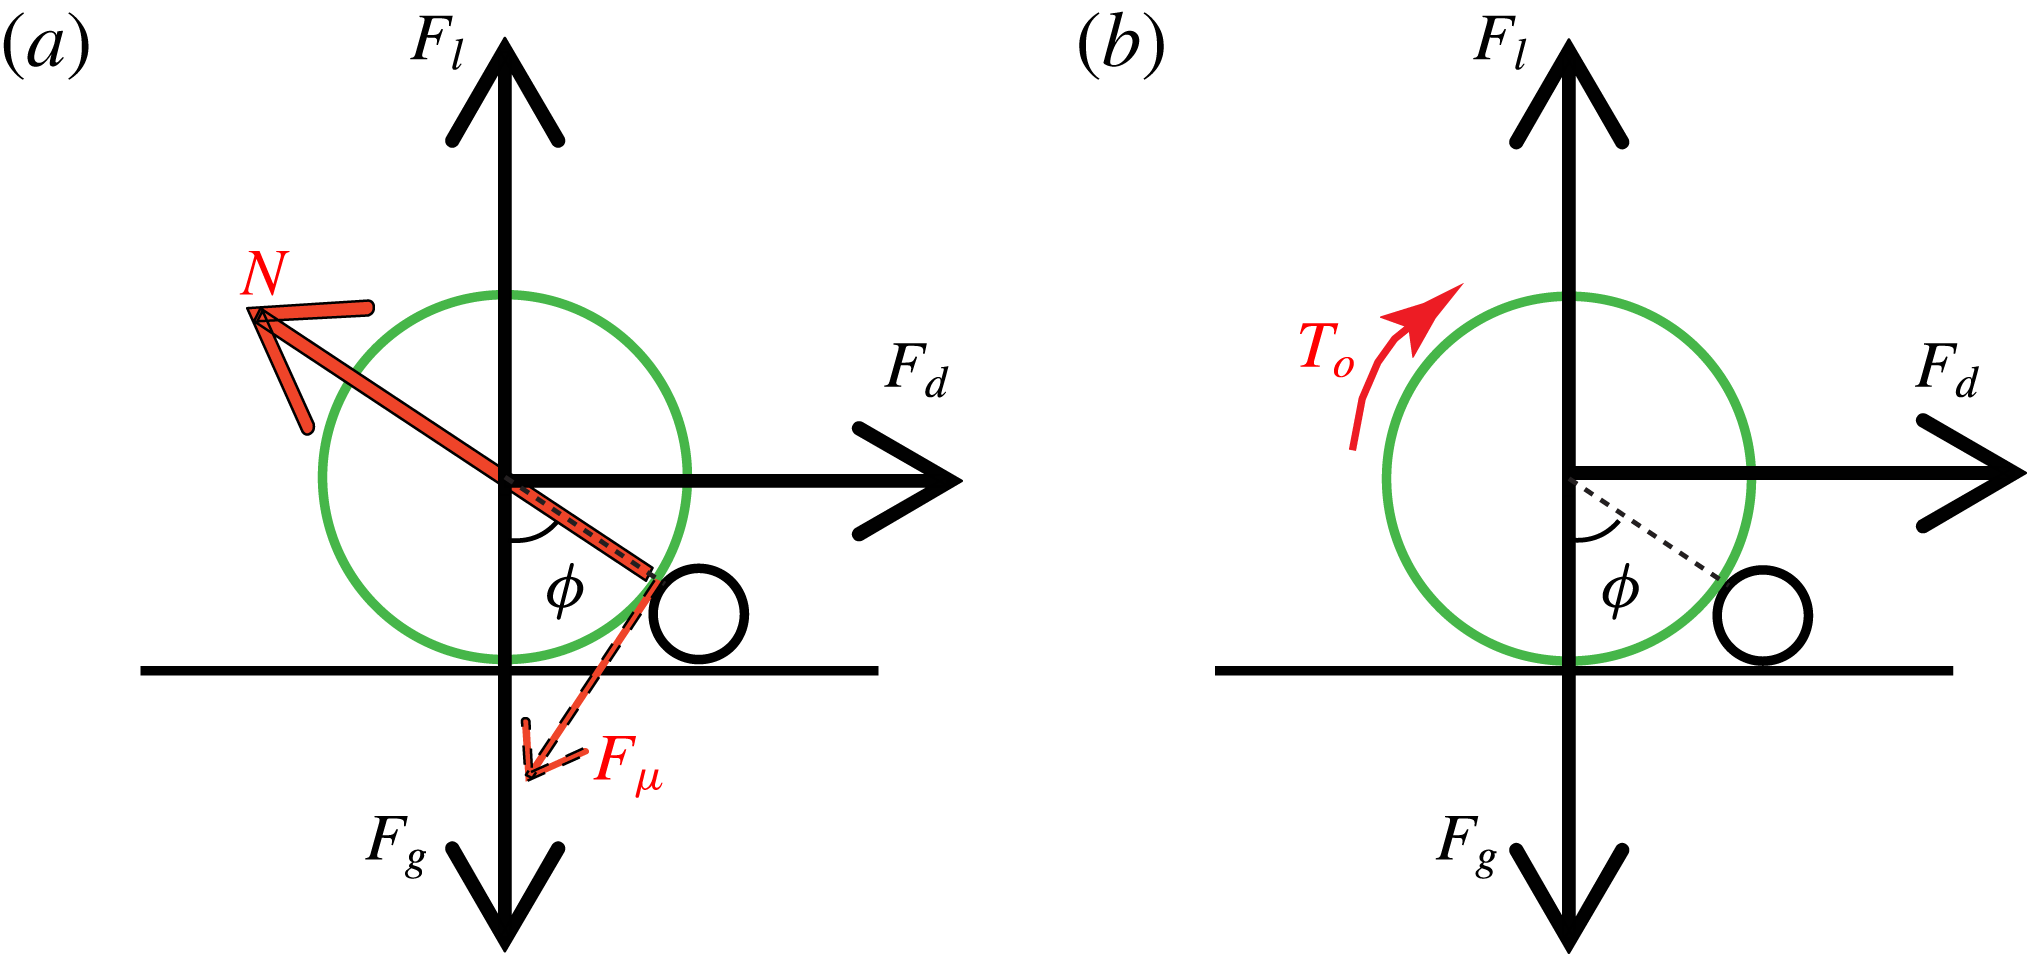
(a) A schematic diagram representing the forces acting on the particle resting against an asperity with a circular cross-section. Contact forces can be considered to be absent at the point of contact between the particle and the substrate at onset. (b) A schematic diagram representing the forces as well as the torque
 $T_{o}$
that act about the centre of the particle. The contact forces acting at the pivot point are not drawn for clarity (see text).

(a) The critical shear rate
 $\dot{\unicode[STIX]{x1D6FE}_{c}}$
is observed to decrease with viscosity (
 $\unicode[STIX]{x1D719}=44^{\circ }$
). The fluid viscosity is obtained by using the glycerol–water mixture ratios reported by Cheng (Reference Cheng2008). The error bars are of the order of the symbol size. (b)
 $\dot{\unicode[STIX]{x1D6FE}_{c}}$
increases nonlinearly, irrespective of the shape of the asperity. Inset: same plot on a log–log scale with a slope
 $1/2$
line to guide the eye.
 $\dot{\unicode[STIX]{x1D6FE}_{c}}$
increases consistent with
 $\sqrt{\unicode[STIX]{x1D70C}_{s}/\unicode[STIX]{x1D70C}_{f}-1}$
for both kinds of barrier. (c)
 $\dot{\unicode[STIX]{x1D6FE}_{c}}$
is systematically greater for higher
 $\unicode[STIX]{x1D719}$
. The dashed lines in the plots correspond to
 $\dot{\unicode[STIX]{x1D6FE}_{c}}$
calculated using (5.3) and (5.5) with
 $\unicode[STIX]{x1D6FC}_{0}=0.45$
and
 $\unicode[STIX]{x1D6FC}_{d}=0.65$
.

5.1 Sliding contact
We first consider the force components perpendicular to the line joining the particle centre and the contact point between the particle and the barrier, as shown in figure 4(a), assuming that the particle is dislodged by sliding over the barrier in the direction opposite to
 $F_{\unicode[STIX]{x1D707}}$
. Then, the force equation for equilibrium gives
 $F_{d}\cos \unicode[STIX]{x1D719}+F_{l}\sin \unicode[STIX]{x1D719}-F_{\unicode[STIX]{x1D707}}=F_{g}\sin \unicode[STIX]{x1D719}$
, where
 $F_{\unicode[STIX]{x1D707}}$
is the friction force at the point of contact. By rearranging terms, one sees that
 $(F_{d}\cos \unicode[STIX]{x1D719}+F_{l}\sin \unicode[STIX]{x1D719})/F_{g}\sin \unicode[STIX]{x1D719}=1+F_{\unicode[STIX]{x1D707}}/F_{g}\sin \unicode[STIX]{x1D719}$
. Because of the presence of the fluid, and because it is difficult to determine the degree to which the particle rolls versus slides at the point of contact,
 $F_{\unicode[STIX]{x1D707}}$
is difficult to estimate with certainty. Nonetheless, the second term on the right-hand side can be assumed to be positive if not zero in the case where
 $F_{\unicode[STIX]{x1D707}}$
goes to zero. Thus,
 $$\begin{eqnarray}(F_{d}\cos \unicode[STIX]{x1D719}+F_{l}\sin \unicode[STIX]{x1D719})/F_{g}\sin \unicode[STIX]{x1D719}\geqslant 1.\end{eqnarray}$$
5.2 Rolling contact
However, from supplementary movies 4 and 5, one notes that the particle appears to roll rather than slide when it is dislodged by the flow. Therefore, it appears that the sliding friction causes the particle to pivot about the point of contact. Then, the condition for torque balance about the pivot point is given by
 $$\begin{eqnarray}T_{d}+T_{l}=T_{g},\end{eqnarray}$$
where both
 $T_{d}$
and
 $T_{l}$
can be seen to act clockwise in figure 4(b) to dislodge the particle, while
 $T_{g}$
acts in the counterclockwise direction and keeps the particle from being dislodged. Because the contact forces act at the pivot point, they do not appear in (5.2). We substitute
 $T_{d}$
,
 $T_{l}$
and
 $T_{g}$
with their expressions in terms of
 $C_{d}$
,
 $C_{o}$
,
 $C_{l}$
,
 $\unicode[STIX]{x1D70C}_{s}$
and
 $\unicode[STIX]{x1D70C}_{f}$
in (5.2) for torque balance. Then, introducing a net hydrodynamic coefficient
 $C_{h}=C_{o}+C_{d}\cos \unicode[STIX]{x1D719}+C_{l}\sin \unicode[STIX]{x1D719}$
and recalling that
 $v=\dot{\unicode[STIX]{x1D6FE}_{c}}d/2$
, we obtain the shear rate required to dislodge a particle as
 $$\begin{eqnarray}\dot{\unicode[STIX]{x1D6FE}_{c}}=\sqrt{\frac{16(\unicode[STIX]{x1D70C}_{s}-\unicode[STIX]{x1D70C}_{f})g\sin \unicode[STIX]{x1D719}}{3\unicode[STIX]{x1D70C}_{f}C_{h}d}}.\end{eqnarray}$$
Thus, for a given particle, fluid and surface roughness,
 $\dot{\unicode[STIX]{x1D6FE}_{c}}$
can be evaluated provided
 $C_{h}$
is known for that
 $Re_{p}$
. Alternately,
 $C_{h}$
can be determined by rewriting (5.3) as
 $$\begin{eqnarray}C_{h}=\frac{16(\unicode[STIX]{x1D70C}_{s}-\unicode[STIX]{x1D70C}_{f})g\sin \unicode[STIX]{x1D719}}{3\unicode[STIX]{x1D70C}_{f}\dot{\unicode[STIX]{x1D6FE}_{c}^{2}}d},\end{eqnarray}$$
where all the quantities on the right-hand side can be measured in our experiments.
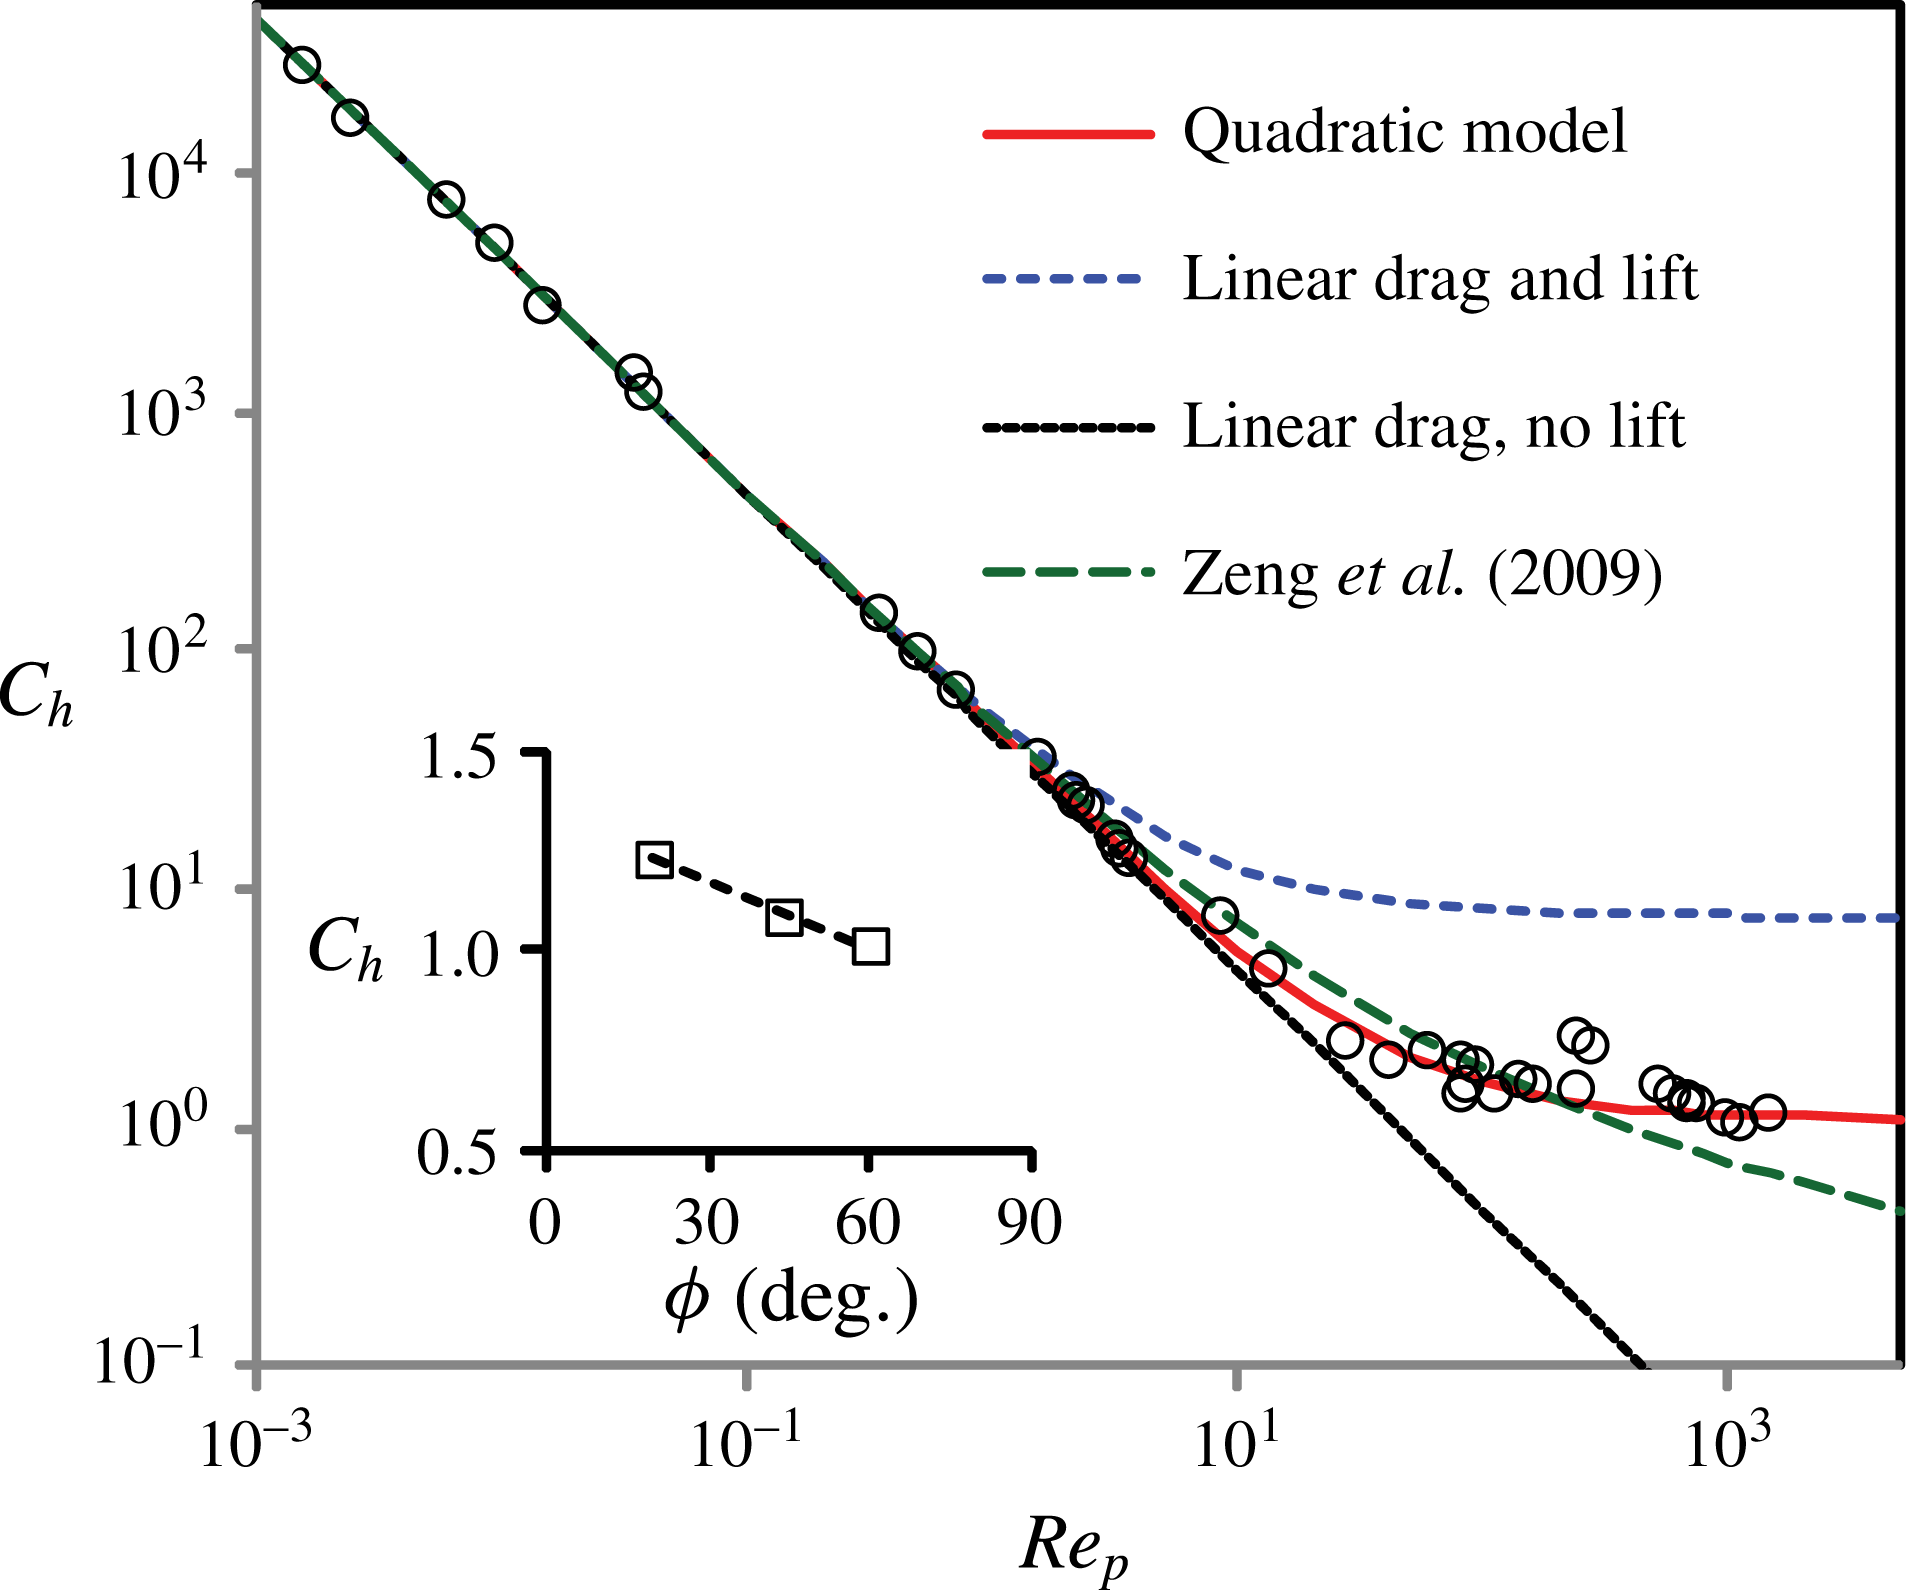
The net hydrodynamic coefficient
 $C_{h}$
obtained from the experiment as a function of
 $Re_{p}$
for
 $\unicode[STIX]{x1D719}=43.5^{\circ }$
compared with various models. Here, the curve labelled as the quadratic model includes the quadratic drag contribution in calculating
 $C_{h}$
(see (5.5)). The curves corresponding to linear drag use O’Neill’s form for
 $C_{d}$
, and the lift is obtained using Leighton and Acrivos’s form for
 $C_{l}$
(see text).
 $C_{h}$
is observed to approach a constant at the highest
 $Re_{p}$
(
 $\unicode[STIX]{x1D6FC}_{0}=0.45$
and
 $\unicode[STIX]{x1D6FC}_{d}=0.65$
). The coefficients used to generate the curve by Zeng et al. (Reference Zeng, Najjar, Balachandar and Fischer2009) are predicted up to
 $Re_{p}\sim 200$
. However, systematic deviations are observed above
 $Re_{p}\sim 10$
. Inset:
 $C_{h}$
decrease somewhat for higher
 $\unicode[STIX]{x1D719}$
(
 $Re_{p}\sim 1000$
). The line corresponds to (5.4) with
 $Re_{p}=1000$
.

The measured
 $C_{h}$
using (5.4) is also plotted in figure 6 as a function of
 $Re_{p}$
over a wide combination of particle densities and viscosities for a fixed roughness. We find that the measured
 $C_{h}$
decreases linearly for low
 $Re_{p}$
, before rapidly approaching a constant value at the highest
 $Re_{p}$
studied. We have further plotted
 $C_{h}$
for
 $Re_{p}\sim 1000$
for the three different
 $\unicode[STIX]{x1D719}$
studied in the inset to figure 6. It can be observed that
 $C_{h}$
becomes relatively independent of
 $Re_{p}$
, while systematically decreasing with
 $\unicode[STIX]{x1D719}$
.
In the viscous limit, the total drag force and torque acting on a particle attached to a wall in a linear shear flow has been calculated by O’Neill (Reference O’Neill1968). Assuming drag to be linear with velocity, he found
 $C_{d}$
and
 $C_{o}$
to be
 $C_{d}^{0}=24f_{w}/Re_{p}$
and
 $C_{o}^{0}=16b_{w}/Re_{p}$
, respectively, where
 $f_{w}=1.7005$
and
 $b_{w}=0.944$
are constants which arise due to the no-slip boundary condition at the substrate. Further, a lift coefficient
 $C_{l}^{0}=6.888f_{w}$
has been calculated, corresponding to viscous shear lift for low
 $Re_{p}$
by Leighton & Acrivos (Reference Leighton and Acrivos1985). We compare
 $C_{h}$
using these hydrodynamic coefficients in figure 6 with those obtained directly from our experimental measurements. We find good agreement for
 $Re_{p}<1$
, whether or not we include lift in the calculations.
Extrapolating the curves into the inertial regime, the two curves deviate systematically above or below the data, depending on whether we consider lift or not. In fact, Zeng et al. (Reference Zeng, Najjar, Balachandar and Fischer2009) have found
 $C_{d}=(24f_{w}/Re_{p})(1+0.104Re_{p}^{0.753})$
based on numerical simulations for a fixed sphere on an infinite plane which is linearly sheared by a fluid flow when
 $Re_{p}\leqslant 250$
. They also found that
 $C_{o}^{0}$
can be extended up to
 $Re_{p}=200$
. Further, they postulated that the lift coefficient can be interpolated between the low- and high-
 $Re_{p}$
limits as
 $C_{l}=3.663(Re_{p}^{2}+0.1173)^{-0.22}$
for
 $Re_{p}<200$
, although it may be noted that higher lift has been also measured over the same regime by Mollinger & Nieuwstadt (Reference Mollinger and Nieuwstadt1996). Accordingly, we have calculated
 $C_{h}$
and plotted the result in figure 6. The corresponding curve appears to capture the overall trend in the data to
 $Re_{p}\sim 10$
within experimental error. However, systematic deviations can be observed above this value over the range of validity of those simulations.
In order to describe the data over the entire range of
 $Re_{p}$
measured, we consider
 $C_{d}$
and
 $C_{o}$
as a superposition of analytically calculated coefficients in the low-
 $Re_{p}$
limit and a term corresponding to quadratic drag which is independent of
 $Re_{p}$
, i.e.
 $C_{d}=C_{d}^{0}+\unicode[STIX]{x1D6FC}_{d}$
, and,
 $C_{o}=C_{o}^{0}+\unicode[STIX]{x1D6FC}_{o}$
, where
 $\unicode[STIX]{x1D6FC}_{d}$
and
 $\unicode[STIX]{x1D6FC}_{o}$
depend further on the flow geometry. The lift acting on a particle attached to a wall at high
 $Re_{p}$
has been measured to be
 $0.242$
(see Okamoto Reference Okamoto, Bradbury, Durst, Launder, Schmidt and Whitelaw1980), which we round up to be
 $\unicode[STIX]{x1D6FC}_{l}=0.25$
. We then interpolate
 $C_{l}$
between the viscous shear lift at low
 $Re_{p}$
and the lift at high
 $Re_{p}$
using the function
 $C_{l}=(C_{l}^{0}-\unicode[STIX]{x1D6FC}_{l})\exp (-Re_{p})+\unicode[STIX]{x1D6FC}_{l}$
. Accordingly, we postulate that
 $$\begin{eqnarray}C_{h}=\left[\frac{16b_{w}}{Re_{p}}+\unicode[STIX]{x1D6FC}_{o}\right]+\left[\frac{24f_{w}}{Re_{p}}+\unicode[STIX]{x1D6FC}_{d}\right]\cos \unicode[STIX]{x1D719}+[(6.888f_{w}-\unicode[STIX]{x1D6FC}_{l})\exp (-Re_{p})+\unicode[STIX]{x1D6FC}_{l}]\sin \unicode[STIX]{x1D719},\end{eqnarray}$$
where the first, second and third terms in brackets on the right-hand side correspond to the interpolated moment, drag and lift acting relative to the particle centre. Then, we obtain
 $\unicode[STIX]{x1D6FC}_{o}=0.5\pm 0.1$
and
 $\unicode[STIX]{x1D6FC}_{d}=0.7\pm 0.1$
by fitting (5.4) to the data shown in the inset to figure 6. The fitted value of
 $\unicode[STIX]{x1D6FC}_{d}$
is much greater than for a sphere in uniform unbounded flow, but consistent with measurements of a drag coefficient of
 $C_{d}\approx 0.627$
reported by Okamoto (Reference Okamoto, Bradbury, Durst, Launder, Schmidt and Whitelaw1980) for a sphere attached to a surface at high
 $Re_{p}$
, obtained by measuring the surface-pressure distribution on the sphere. It may be noted that
 $C_{h}$
is not very sensitive to
 $\unicode[STIX]{x1D719}$
at high
 $Re_{p}$
. This occurs because the decrease in drag contribution to torque is compensated by an increase in the lift contribution as
 $\unicode[STIX]{x1D719}$
is increased.
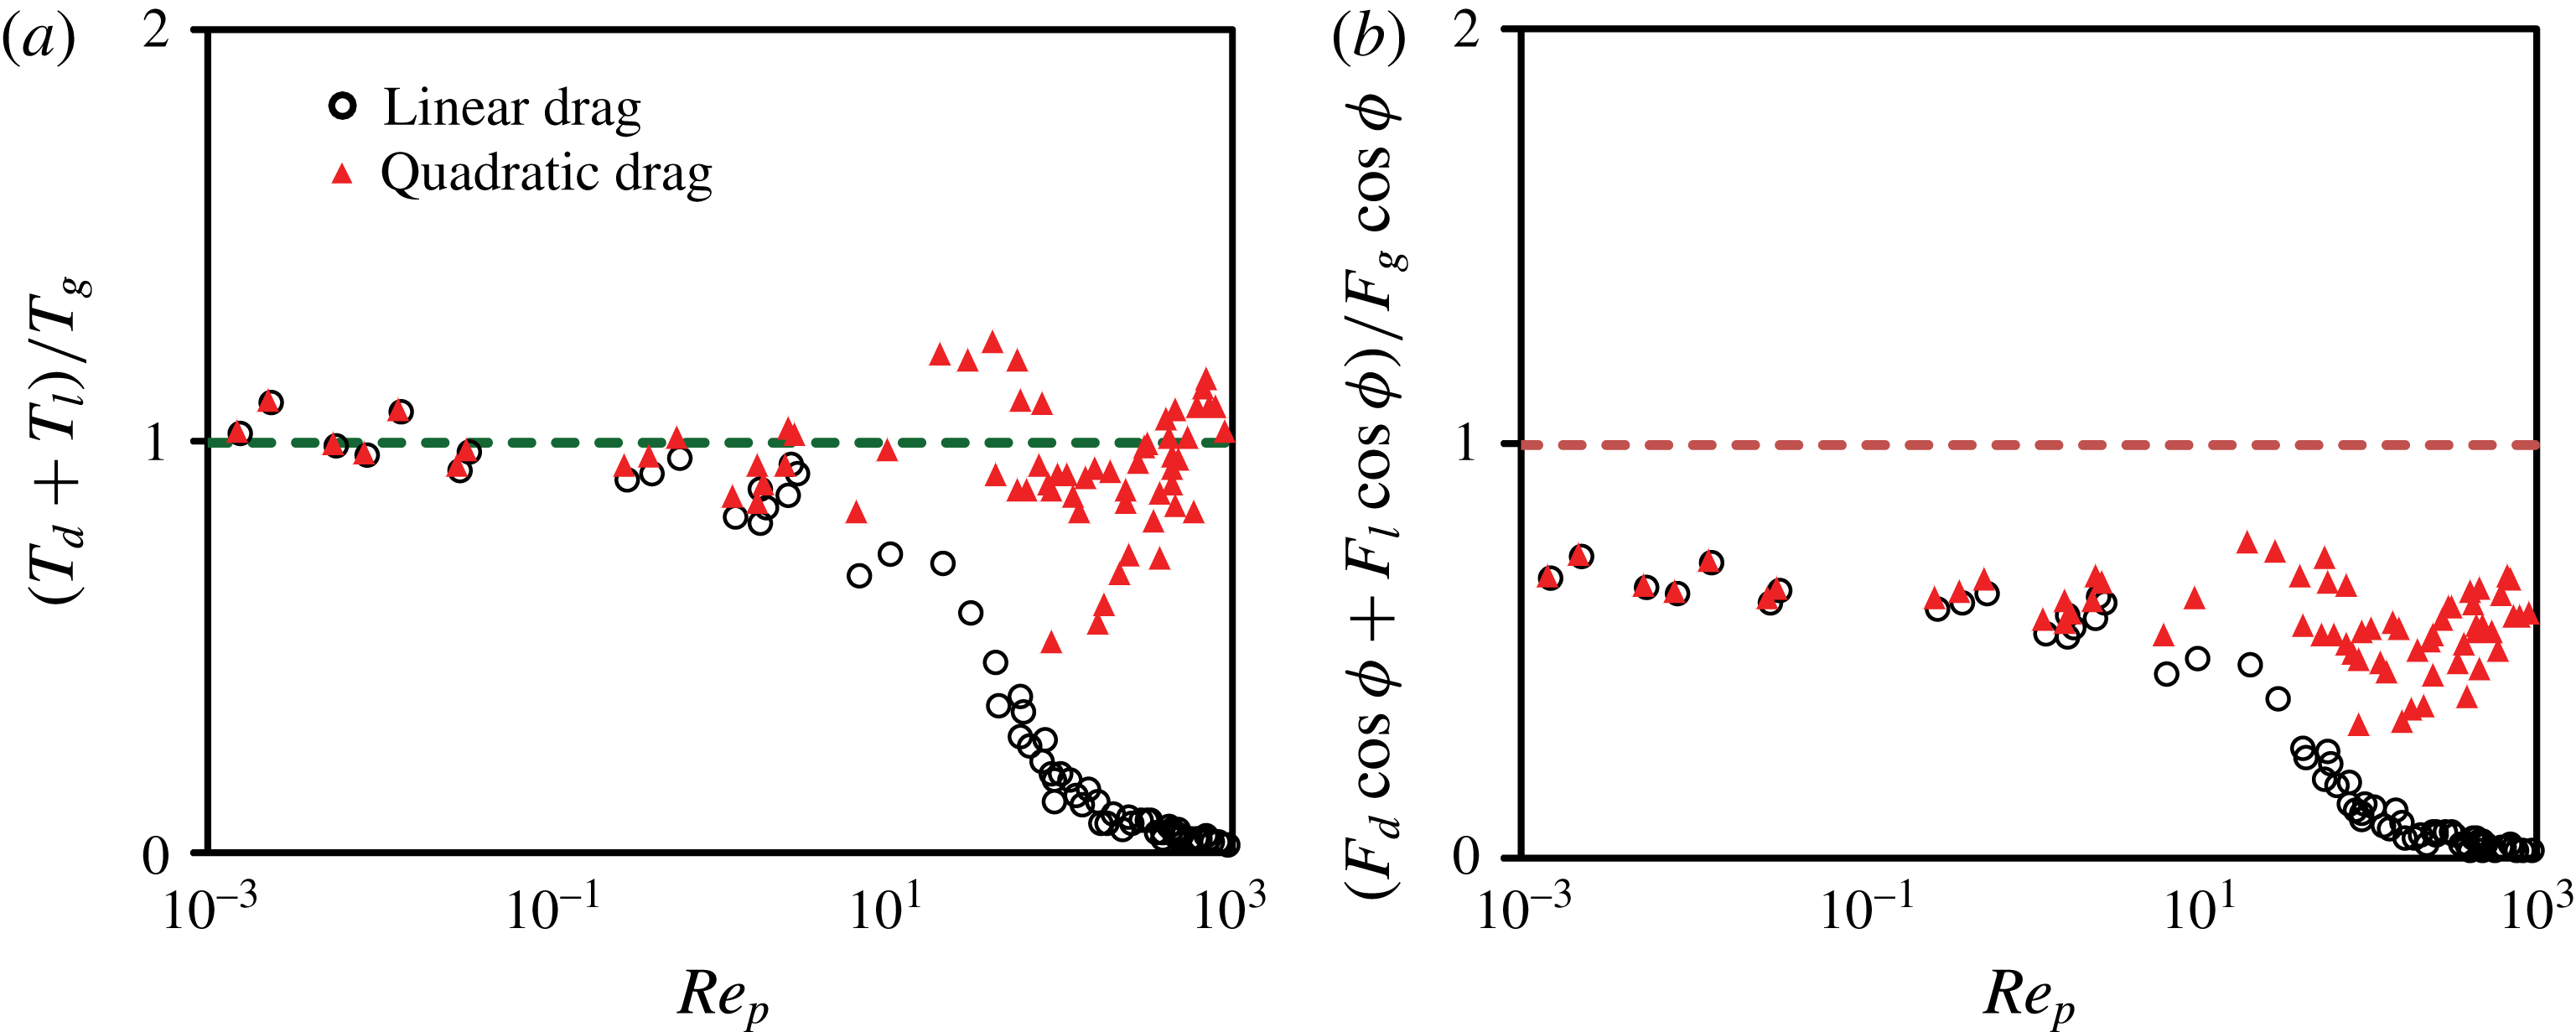
(a) The ratio of the torques associated with hydrodynamic forces and gravity calculated from the measured
 $\dot{\unicode[STIX]{x1D6FE}_{c}}$
and using the linear drag model, and the quadratic drag model in (5.5). The horizontal dashed line corresponds to the torque balance condition given by (5.2). Good agreement is observed with analytical calculations in the
 $Re_{p}<1$
regime. Overall good agreement is also observed with the torque balance condition by using a quadratic model over the entire range of
 $Re_{p}$
. (b) The ratio of the force components given by the left-hand side of (5.1) plotted versus
 $Re_{p}$
. The drag and lift are obtained using the measured shear rate required to dislodge the particle. The measured ratio is clearly below the horizontal dashed line, showing that the torque about the particle needs to be taken into account to describe the onset of motion.

We have plotted
 $\dot{\unicode[STIX]{x1D6FE}_{c}}$
obtained using (5.3) and (5.5) in all three plots in figure 5. We find that, by including the quadratic drag in the inertial regime and combining it with the analytical results in the viscous regime, we are able to capture the observed
 $\dot{\unicode[STIX]{x1D6FE}_{c}}$
dependence as a function of fluid viscosity, particle density, and surface roughness characterized by
 $\unicode[STIX]{x1D719}$
. We further tested to see if assuming the forces alone can describe the data. This corresponds to forcing
 $C_{o}$
to be zero in our fits, and we are not able simply to obtain an accurate description of these trends.
In order to summarize the results, we have plotted the ratio of the torques due to hydrodynamic forces and gravity in figure 7(a) and the ratio of the hydrodynamic forces and gravity in figure 7(b) as a function of
 $Re_{p}$
. We find that the threshold condition is described well by the analytically calculated torques in the viscous limit for
 $Re_{p}<0.5$
before inertial effects grow, leading to systematic deviations. The form of drag given by the viscosity and inertia components captures the data relatively well over the entire range of
 $Re_{p}$
investigated. By contrast, the data shown in figure 7(b) fall systematically below a value of one, which is the lower bound given by (5.1) even if one assumes
 $F_{\unicode[STIX]{x1D707}}=0$
. Thus, the critical shear rate remains distinct and well below the threshold condition obtained by considering the forces alone to dislodge the particle. Based on this observation, we conclude that the condition when the particle gets dislodged clearly corresponds to the torque balance condition. This is further in agreement with the observation that the particle rolls over the barrier when the corresponding critical shear rate is reached, as illustrated by the supplementary movies.
In performing this analysis, we have assumed that the shear rate required to dislodge the particle is given by the critical rotation frequency of the top plate. It is possible that this method can lead to a systematic overestimation of the hydrodynamic coefficients when the flow becomes time-dependent at higher
 $Re_{p}$
. However, this systematic error is offset by the corresponding lower estimate of shear rates used in the calculation of torques and forces. Thus, we expect the hydrodynamic forces and torques used in figure 7 to be robust even at high
 $Re_{p}$
.
6 Conclusions
In summary, we have shown with experiments that the shear rate at onset of erosion is determined by the torque balance condition. Further, systematic deviations are observed if forces alone are considered in determining the instability of the particle. The main reason for this discrepancy is that the net hydrodynamic force does not act at the centre of the particle, but rather some distance above the particle centre because the mean flow speed increases with distance from the bottom substrate. In the torque balance condition, this is taken into account by considering the additional torque about the centre of the particle. Building on this condition, we have then quantitatively described the observed critical shear rate
 $\dot{\unicode[STIX]{x1D6FE}_{c}}$
on the particle density, the fluid viscosity, and the surface roughness over a wide range of particle Reynolds numbers
 $Re_{p}$
. We find that a linear combination of the hydrodynamic coefficients obtained in the viscous and inertial limits can describe the observed
 $\dot{\unicode[STIX]{x1D6FE}_{c}}$
as a function of the particle and fluid properties from laminar to turbulent flow conditions.
Further, we show that the data at low
 $Re_{p}<0.5$
are in good agreement with analytical calculations of the drag and lift coefficients in the
 $Re_{p}\rightarrow 0$
limit, but differ from numerical results at moderate
 $Re_{p}$
reported by Zeng et al. (Reference Zeng, Najjar, Balachandar and Fischer2009) for flow past a sphere resting on a smooth surface. At higher
 $Re_{p}$
, where analytical results are unavailable, the hydrodynamic coefficients are found to approach a constant for
 $Re_{p}>1000$
. It is possible that the differences from the numerical results at moderate
 $Re_{p}$
arise because of the presence of physical barriers near the base of the particle in the experiments which can modify the flow. Further research is required to fully understand the effect of surface roughness and particle exposure, and thus extend the implications of our study to the erosion of a granular bed, such as in rivers and streams.
Acknowledgements
This material is based upon work supported by the U.S. Department of Energy Office of Science and Office of Basic Energy Sciences programme under DE-SC0010274, and National Science Foundation grant no. CBET-1335928.
Supplementary movies
Supplementary movies are available at https://doi.org/10.1017/jfm.2016.655.