

It may not be an easy task to summarize the features of Italy’s economic growth over the past century and a half in a few pages, but that is the aim of this article. During the past fifteen years, new research has given the scientific community a great deal of statistical reconstructions Footnote 1 that justify the work carried out in the following pages. We are now able to discuss new national series of the main macroeconomic indicators (gross domestic product [GDP], productivity, labor force), and also consider long-run estimates of regional GDP and changes in living standards and in inequality in the personal distribution of income. In the light of new evidence, an analysis of Italy’s “modern economic growth” allows us not only to identify new “facts” characterizing the country’s history, but also to assess the strength of the main interpretational hypotheses regarding the path that led the Italians “from the periphery to the centre.” Footnote 2
A balanced discussion about Italy’s modern economic growth must highlight important successes, as well as some serious signs of worry. One hundred fifty years after its unification in 1861, Italy has defeated poverty and has completed its race toward prosperity. Furthermore, recent studies show that, throughout most of its history, Italy managed to link economic growth with greater and growing equality in the personal distribution of income, which makes this country a case study for the international scientific community. On the negative side, the data we are presenting show a process of stubborn lack of territorial integration between the Mezzogiorno (southern Italy) and the rest of the country, even though the central and northeastern regions successfully converged toward the northwest. Not least, all the economic indicators examined in this article suggest that in the past two decades the Italians’ virtuous race has come to a halt: Italy is unmistakably declining, at least in relative terms.
This article is organized as follows. The second section analyzes the main macroeconomic indicators at the national level. The third section reviews the most important historiographic interpretations. The fourth section documents the territorial differences with respect to Italy’s GDP. The fifth section takes a step “beyond GDP” and focuses on income inequality and poverty, and the last section presents conclusions.
Italy’s Long-Run Economic Growth
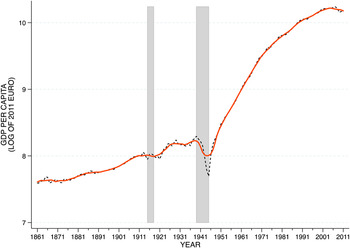
Italy was among the first countries in the world to boast its own historical series of national accounts: In 1957, the Italian National Statistics Institute (Istat) published a complete system of national accounts with yearly time series starting from 1861 (when the Kingdom of Italy was established) and ending in 1955. Footnote 3 Under further scrutiny, however, that pioneering effort revealed serious flaws, among which was a lack of transparency in sources and methods, which made all but impossible any improvement on the original figures. On occasion of the 150th anniversary of Italy’s unification, a new reconstruction of the national accounts has been made available, complete in both the production and expenditure sides; the main result is displayed in Figure 1. Footnote 4
GDP per capita, Italy, 1861–2011.
Notes: 2011 euros, present borders. Sources: Brunetti, Felice, and Vecchi, “Income,” in In ricchezza, ed. Vecchi; see also footnote 4. Shaded bars correspond to war years.

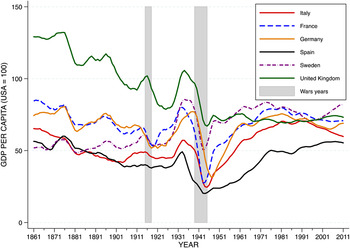
Since Italy’s unification, Italian GDP per capita has increased about thirteenfold, recording an average annual growth rate of just under 2 percent. The figure shows a clearly nonlinear trend: If in the first ninety years (1861–1951) per capita GDP in absolute value doubled, since the end of World War II it has multiplied more than seven times. The overall result, remarkable in absolute terms, appears to be in line with what is found in other advanced countries. In particular, and in contrast to some clichés that have been handed down for decades in historiography, international comparisons provide little support to any Italian-specific “economic miracle”: The features of Italy’s growth over the hundred-year period are qualitatively similar to those of the other main countries of continental Europe (Figure 2). Footnote 5 Indeed, Italy has lagged behind the top performers: In 2011 Italian GDP per head was 59 percent of the U.S. figure, just above the figure for Spain (55 percent), but still below those of other Organisation for Economic Co-operation and Development (OECD) countries, such as Germany (70 percent), France (71 percent), the United Kingdom (72 percent), or Sweden (84 percent). Footnote 6
GDP per capita in selected countries, 1861–2011 (USA = 100).
Source: Brandolini and Vecchi, “Standards of Living,” in The Oxford Handbook, ed. Toniolo, 229. The series have been smoothed with a five-period moving average.

If we look at the growth rates by subperiods, the Italian model appears to be similar to that of the rest of continental Europe, with a remarkable exception: In the last stretch, Italy’s falling back has been unparalleled by any other European country. At least in this respect, it is difficult to fit the Italian case into the traditional literature on the varieties of capitalism. With particular reference to the second half of the twentieth century, this literature has divided national experiences between liberal market economies (such as the United Kingdom and United States) and coordinated market economies (such as Germany and Sweden). Footnote 7 Italy has been considered to be in an “ambiguous position,” together with France and Spain. Footnote 8 However, some authors have argued that these countries belong to a third type of capitalism, the “Mediterranean” one (also including Greece, Portugal, and Turkey), characterized by extensive state intervention and a larger agrarian sector. Footnote 9
State intervention, in a broader sense, has been further emphasized by Franco Amatori, who defines the Italian model as “political capitalism,” given the prominent active role played by the government in undertaking the key decisions on public intervention throughout the history of post-unification Italy—and after World War II, with a much stronger pressure of politicians on managements when it comes to implementing them. Footnote 10 In a similar fashion, but from a different perspective, Vincent Della Sala has described it as a “dysfunctional state capitalism”: a system close to those based on nonmarket forms of regulation, which is dysfunctional, however, because it lacks among the others of “cohesive social partners and strong political institutions.” Footnote 11 Both interpretations, which underline the singularity of the Italian capitalism due to the functioning of political institutions, now seem reconcilable to the recent performance of the Italian economy: Just when Italy’s falling back was unparalleled by any other Western country, the country lived through a political and institutional crisis (the end of the first Republic, the advent of the second Republic, and possibly, later, of a third one) that also was unique in the Western world; the traditional drivers behind Italy’s economic growth could no longer work and turned out to be unable to adapt to the new challenges.
Interpretations and Reinterpretations
Since World War II, Italian historiography has put forward various, and often competing, hypotheses to explain the country’s modernization process. The result is a large and detailed body of literature that we briefly summarize in view of the new quantitative evidence outlined in the previous section.
The early post-unification decades previously considered to be stagnant are now viewed as a phase of slight but significant growth, and the takeoff in the Giolitti years has now been somewhat toned down. Nonetheless, the annualized growth rate of per capita GDP during the years 1899–1913 (1.75 percent) turns out to be triple what it was in the previous forty years (0.57 percent). What factors are responsible for this increase?
The literature dating back to Gerschenkron has linked this growth to the creation of universal banks, German style, in the early 1890s (following the 1893 banking law): these acted as a substitutive factor of Italy’s industrialization, by channelling financial resources from retail savers (short-term debt) to industrial enterprises (long-term credit). Footnote 12 Stefano Fenoaltea put forward a different interpretation that departs from the takeoff paradigm in favor of a cyclical model. Fenoaltea suggested that what caused the fluctuations of the industrial index—which ultimately resulted in the GDP increase—was the production of durables and related materials, which was dominated by the Kuznets cycle of the construction industry and thus of other investment-related industries. Footnote 13
Certainly, the Italian economy not only needed to import natural resources and to export manufactured goods, but also required foreign capital of both the financial and physical kind—machinery to climb up the technological ladder. In fact, Italy benefited from the general increase in trade (including trade in knowledge), capital flows, and migration, and from the establishment of an international monetary system based on fixed exchange rates (the gold standard, 1870–1914). The available figures indicate that Italy’s international factor mobility (migration, capital inflows, and trade openness) increased remarkably during the Giolitti years; Footnote 14 the gold standard entailed a deflationist macroeconomic setting, which was not incompatible with GDP growth, insofar as it favored capital inflows and technological upgrading. Footnote 15 Manufacturing sectors, which were characteristic of both the first and second industrial revolutions, were developed in those years: first textiles and metalmaking, and then electricity, Footnote 16 chemicals, Footnote 17 rubber (Pirelli) and new mechanics, including automobiles. Footnote 18 Their growth, however, was not only a spontaneous response to market incentives; quantitative evidence confirms that first the textile sector, then the engineering one were triggered by national policies, namely public subsidies and protectionist measures. Footnote 19 On the whole, there was little innovation; technology was mostly imitative and imported from abroad. Footnote 20
World War I was a break in this path. Footnote 21 The abrupt end of the first globalization provoked by the war, and the following three decades of protectionism, instability, and conflicts, forced Italy to a (temporary) rethinking of its development pattern based on importing natural resources and capital, and on exporting manufactured goods; indeed, Italy turned to increasing closure and eventually to autarchy. National institutions changed too. World War I marked the beginning of state intervention in the economy, which continued with the bailouts of the postwar years and increased to a higher level in the 1930s, with the creation of the largest state-owned conglomerate, the Istituto per la Ricostruzione Industriale (IRI). The credit sector was reorganized accordingly: The universal banks were limited by the 1936 banking law to commercial activities; separation between short- and long-term credit, and more generally between banking and industry, was established and lasted until 1993. Such institutions would turn out to be the basic economic infrastructure behind the Italian economic miracle, as it is now widely acknowledged. Footnote 22
The Golden Age of industrial capitalism and the Italian economic miracle came with the end of World War II and the country’s reintegration into a revived international system under the leadership of the United States. It would be hard to underestimate the importance of these conditions in the way Italy managed to catch up with the other industrialized nations. The Marshall Plan was used in Italy, more than in other European countries, to introduce mass-production technologies from the United States. Footnote 23 By guaranteeing fixed exchange rates, Bretton Woods made long-run growth of Italian exports possible without an appreciation in the national currency, which would have harmed competitiveness. Bretton Woods also imposed controls on short-term capital movements, which allowed Keynesian expansive policies to be implemented without an appreciation of the Italian lira. At the same time, long-term capital movements were not limited, and their inflows favored foreign direct investments in Italy; this, in turn, stimulated technology transfer and enabled Italy’s industrial productivity to catch up with the others. Footnote 24 The position of Italy in the international economic system was further strengthened by the creation of the European Economic Community (ECC) in 1957, in which the country participated as a founding member together with more advanced Western economies (France, Benelux, and West Germany); insofar as it favored international trade (as testified by the trade openness index, which increased after the end of the 1950s) Footnote 25 and emigration under special programs Footnote 26 (and with higher return rates), the ECC allowed the comparative advantages of a country with low labor costs and labor-intensive productions to run at full throttle. Not least, during the Golden Age, the prices of natural resources—most notably, oil—were exceptionally low, which made possible the reallocation of Italian manufacturing toward energy-intensive productions.
Under these conditions, the institutional framework designed mainly during the 1930s was implemented and could work at its best. By growing at more than 5 percent per annum, Italy’s GDP per capita reached the levels of the most advanced countries; econometric tests, run with the updated series of national accounts, suggest that it was an export-led growth. Footnote 27 Metalmaking, engineering, and chemicals were the best-performing industrial sectors; here, the role of state-owned enterprises was particularly decisive, Footnote 28 from ENI (energy) Footnote 29 to Finsider (metallurgy), Footnote 30 to Finmeccanica (engineering and later high-advanced productions); Footnote 31 but private groups, such as Fiat in automobiles, were also important and successful.
The internal adjustments from the 1970s onward were triggered by two dramatic processes. The end of the Bretton Woods system in 1971 heralded a period of floating exchange rates that, until the introduction of the euro in 1999, saw the Italian lira lose value in comparison with the German mark, the currency of its main manufacturing competitor. On the technological front, a major development was the decline of Fordism and the advent of information and communication technology (ICT): First came the 1973 oil shocks, which hit mostly energy-intensive sectors, while favoring light (or labor-intensive) manufacturing industries and the services; the ICT revolution began soon afterward.
The years 1973 through 1992 coincided with the declining phase of the so-called first Republic, with increasing political corruption and widespread illegality. Italy’s GDP per capita continued to converge, although its average growth rate fell to around 2.5 percent, while the economy diversified in services and strongly export-oriented light manufacturing. Major supply-side reforms were delayed and macroeconomic disequilibria expanded, starting with public finance. The economic growth of the 1980s was, in fact, a “drugged” one. The ratio of public debt to GDP doubled in just ten years, from 51 percent in 1982 to 102 percent in 1990. Footnote 32 The country sidetracked its own problems, choosing to pass them on to future generations. In the 1980s, growth was achieved through implicit laissez-faire fiscal and labor policies, which helped reduce companies’ costs, as well as by decreasing the value of the Italian lira in foreign exchange markets, thereby increasing the competitiveness of Italian goods in an artificial way (not based on productivity gains). Footnote 33 At the same time, state-owned enterprises were characterized by losses and misconduct, Footnote 34 whereas the crisis of some major enterprises was so deep that it led to the abandonment of entire industrial sectors (most notably ICT). Investment in research and development lagged behind compared with the OECD average, as did industrial productivity when compared with GDP per capita.
At the beginning of the 1990s, the macroeconomic context changed again, as did policymaking with the advent of the second Republic. Just as in the 1950s and 1960s, the creation of a common European market had favored Italy, at a time when its labor costs were relatively low; now, the intensification of the process of globalization and the enlargement of the European Union meant that some of Italy’s comparative advantages were lost, and encouraged outsourcing from core countries (including Italy) to eastern Europe or the Far East. Footnote 35 At the same time, because of the Maastricht rules for joining the European Union, expansive Keynesian policies were no longer possible and, indeed, corrective measures for reducing the country’s huge public debt became no longer postponable. During the 1990s, some supply-side reforms and liberalization measures were finally implemented, although the advocates of these measures generally considered them to be inadequate. The introduction of the euro precluded further national currency devaluations; this had harmful effects on Italian exports, in the very years when the competitiveness of a resurgent Asia was rising dramatically. At the same time, internal demand did not grow as necessary, in view of increasing imports from other European countries and the rising inequality that depressed consumption. As a consequence, Italy began to fall behind in terms of per capita GDP, in comparison with the European average, not to mention Asia or the United States (and, more recently, even Latin America). In recent years, Italy’s economic decline has become a subject of great speculation and some good arguments. Footnote 36
Italy’s Regional Development
Economic growth is, typically, a selective process: It does not involve the territory in a homogeneous manner, nor does it proceed in a uniform way over time. Italy is notorious for the extent and persistence of its internal imbalances. However, only recently the availability of a new series of national GDP has made it possible to produce GDP figures at the regional level. Footnote 37 According to the new estimates, the North–South divide was already present at the time of unification, GDP per capita being an estimated 18 percent higher in the center-northeast. Footnote 38 The differences were obviously more marked when analyzing individual regions: Setting the Italian average equal to 100, Latium (146) and Liguria (139) headed the list, whereas Calabria (69) and Basilicata (67) were at the bottom. During the early stages of industrialization, the evolution of Italian regional differences was not very different from what was observed in other large European countries. Footnote 39
In 1861, Italy was still a poor country, practically lacking modern industry. This largely explains the relatively small difference in GDP between north and south. Over the subsequent fifty years, however, the industrialization process started up and concentrated in the northwestern regions, where the so-called industrial triangle (Milan–Turin–Genoa) was taking shape; from there, modern industry gradually spread to neighboring regions, from Veneto to Emilia, Tuscany, and Umbria, sometimes evolving from preexisting artisan enterprises. Conversely, the Italian Mezzogiorno, which, thanks to high tariffs, could boast some important (but not advanced) industrial enterprises before unification, lagged behind. On the whole, during the years 1861 through 1913, divergence was mild and only partially mitigated by massive international emigration.
Regional inequality increased remarkably in the interwar years. The demographic and economic policies of the Fascist regime have been criticized for having harmed southern Italy by preventing emigration and raising demographic pressure, disfavoring productivity growth in agriculture (wheat was preferred to more productive Mediterranean cultivations; the latifondo was not reformed). At the same time, these policies enhanced industrialization in the most advanced regions: Not only did the industrial bailouts following World War I and the 1929 crisis inevitably channel financial public resources toward the northwest of the country, Footnote 40 but also autarchy and the system of state controls de facto favored the plants already in existence, usually in the northwest. As a result, industrialization in the interwar years further advanced in the northwest, whereas in southern Italy the percentage of the industrial labor force decreased and that of agriculture remained at around 60 percent.
Industrialization spread to southern Italy during the “economic miracle,” mostly thanks to massive top-down intervention financed by the state-owned Cassa per il Mezzogiorno, with no parallels in other Western countries. Created in 1950, the Cassa first focused on basic infrastructure and then, from 1957 onward, on heavy industries with high capital/labor ratios. Footnote 41 In fact, southern Italy’s catching up was due not only to convergence in the share of the industrial workforce, but also—and even more—to convergence in industrial per-worker productivity. Interregional (south to north) migration, which for the first time became substantial in those years, was also important for convergence. This was a remarkable achievement nonetheless, clearly unprecedented in the long-run history of post-unification Italy.
Top-down schemes did not help home-grown enterprises. When the 1970s crisis hit capital-intensive activities more heavily, the southern state-subsidized plants in chemicals, metalmaking, and engineering were the most affected. As the strategy to develop southern Italy failed, public aid—still substantial as a share of GDP—turned to unproductive uses, which even ended up with favoring organized crime and illegal activities. Footnote 42 In the meantime, the reorientation from capital- to labor-intensive activities favoured light manufacturing in the center and northeast, which in the last decades accelerated convergence toward the northwest. The “third Italy,” as the central and northeastern regions began to be called, Footnote 43 came to the forefront of economic analysis with a peculiar industrial organization, the industrial districts, which flourished in the 1980s and 1990s: Strong civicness—efficient institutions, informal knowledge, shared ethics and cooperative informal rules—helped reduce transaction costs among a high number of small and small–medium firms, geographically concentrated and homogenous in production. Footnote 44
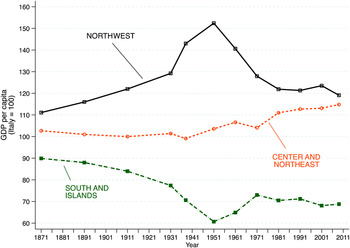
The long-run evolution of Italy’s regional imbalances in per capita GDP is summarized in Figure 3. Regional inequalities were on the rise from 1871 to 1951: Divergence was slow in the liberal age, but much stronger in the interwar years and, in particular, after the 1929 crisis, reaching its peak around 1951. By 1951, Italy was clearly divided into three macro-areas. From this point on, we observe a remarkable convergence of the “third Italy,” which has continued until today; conversely, Southern Italy converged only in the years of the economic miracle, but since then it has fallen back again. As a result, we now have no longer three, but two Italies, quite clearly defined in terms of economic development and industrial morphology: the center-north, now much more internally homogeneous than before, and the Mezzogiorno.
GDP per capita in Italy’s macro-regions, 1871–2009 (Italy = 100).
Source: Authors’ elaboration on Brunetti, Felice, and Vecchi, “Reddito,” in In ricchezza. The Northwest comprises Piedmont, Liguria, Lombardia, and Aosta Valley. The Center and Northeast consists of Veneto, Emilia-Romagna, Tuscany, the Marches, Umbria, Latium, and, from 1931, Trentino-Alto Adige and Friuli-Venezia Giulia. All the rest is the South and Islands (Sicilia and Sardinia).

A long-term explanation has been recently proposed for this pattern, which emphasizes endogenous factors (natural resources, human capital, and social capital) Footnote 45 and allows for the peculiarities of each historical period. Footnote 46 A more favorable natural endowment in the North—higher land productivity in the Po Plains, an environment rich in water and where transportation was easier—served as a catalyst of the first industrial revolution (c. 1830–1880). Later on, in the second industrial revolution (c. 1880–1970), it was human capital (meant as technical instruction, but also as a mastery of the best techniques) that made the difference; this, too, was higher in the northwest. In the post-Fordist age, when industrial districts and local institutions grew in importance, the catalyst resource was, broadly speaking, social capital. According to Felice and Vasta, all these endogenous factors were bolstered by the actions of inclusive political and economic institutions in the center-northeast; conversely, in southern Italy extractive institutions were prevailing, with resulting lower levels of human and social capital, and no active involvement of the local society in the modernization process. Footnote 47 The convergence observed during the Golden Age was the exception, but it falls under the same analytical scheme: In that period, financial resources were channelled to southern Italy through a massive state intervention, but being extraneous to the socio-institutional environment of southern Italy, they were not enough to activate local resources.
Beyond GDP
The dynamics of GDP does not subsume that of well-being. Amartya Sen maintained that GDP provides an incomplete picture of well-being not only, and not so much, because GDP rules out a great many nonmonetary dimensions that go into the definition of well-being, but for reasons linked to distribution—“perhaps the most serious difficulty is with the treatment of income distribution.” Footnote 48 According to Sen, personal income distribution is “an integral part of real income evaluation” (p. 20); thus, he suggested considering GDP and income distribution together. At an empirical level, by observing the sharp rise in inequality in the United Kingdom and United States in the Thatcher and Reagan years, respectively, Atkinson noted how “changes in personal distribution are large enough to affect our view of aggregate economic performance.” Footnote 49 To assess the equity of modern economic growth, however, we need to overcome the obstacle of the lack of adequate data. In Italy’s case, the reconstruction of income distribution inequality has followed an innovative approach, based on a unique collection of household budgets observed for the period 1861 through 2011. Footnote 50 This statistical basis enabled reconstructing the trend of the Gini index and of the extent of absolute poverty since 1861 (Figure 4).
Income inequality and absolute poverty in Italy, 1861–2011.
Source: the inequality series is from Amendola, Brandolini, and Vecchi, “Disuguaglianza,” in In ricchezza, whereas the absolute poverty series is from Amendola, Salsano, and Vecchi, “Povertà,” ibid. Note: inequality is likely to be underestimated for 1871 because of small sample size problems.

The intertemporal profile of the Gini index does not show an upward trend in the initial stage of modern economic growth, contrary to what was hypothesized by Kuznets, and contrary to what is found in other countries: In the long run, Italy managed to combine economic growth with greater equity in income distribution. This is a virtuous process that was maintained for 130 years; it is confirmed by the long-term trend in the incidence of absolute poverty, which closely follows that of inequality. The evidence in Figure 4 lends support to the hypothesis of a benign industrialization, put forward by Toniolo Footnote 51 and Vecchi Footnote 52 : Starting at the turn of the twentieth century, Italian industrialization did not require the population to make sacrifices in terms of equity in income distribution, nor did it involve a worsening of living conditions, not even temporarily, for the population. Footnote 53 After reaching its lowest levels in the 1980s, however, inequality has started to grow again; starting from the early 1990s, the increase in the Gini index in Italy has been accompanied by a conspicuous slowdown in economic growth and an increase in poverty, even in its most extreme forms. The vicious circle has lasted for two decades now; the issue the country is debating in the aftermath of the 150th anniversary celebrations concerns the population’s economic vulnerability—that is, the sustainability of the levels of well-being achieved by the Italians.
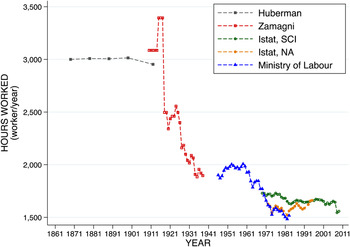
It is possible to go “beyond GDP,” not only by incorporating distribution aspects, but also by assessing other indicators that can grasp the changes which modern economic growth has meant for the population’s conditions of life. The most revealing statistics probably refer to the greater life expectancy at birth of the Italians, who are among the longest-living people in the world, ranking behind Japan but before other “wealthier” nations. The data of interest are naturally too many to be discussed in the space of this article, but they are easily available today to the interested reader. Footnote 54 We shall instead conclude with some remarks on the progress made by the Italian population in consideration of the development of a “good” that escapes GDP accounting, but whose importance was recognized by Kuznets as far back as 1952: leisure time. Footnote 55 The secular process of the reduction of time dedicated to working activities experienced by Italian workers is shown in Figure 5. In this case, the Italian historical pattern is approximately in line with the historical evidence available for other European countries. Footnote 56
Hours worked (per worker per year) in Italy, 1861–2011.
Source: Brandolini and Vecchi, “Standards of Living,” in The Oxford Handbook, p. 232.

Conclusions
Since the end of the nineteenth century, for about one hundred years, Italy has been the protagonist of a successful process of modernization and economic growth. Today, however, at the start of the twenty-first century, the country has lost its drive for growth and finds it difficult to revive it. Gianni Toniolo has recently called this pattern “a tale of convergence and two tails”: a long convergence, from 1896 to 1992; two tails of divergence, at the beginning of Italy’s post-unification history (1861–1896), and in the past two decades (since 1992). Footnote 57 However, we all know that economic decline has occurred many times in the course of the Italian history—in the ancient period and in the Middle Ages, as well as in modern times—and it is not always easy to perceive by its early symptoms. Footnote 58 If we bear these things in mind, it is worth briefly reflecting on the possibility that Italy has indeed embarked on a path of economic decline, rather than living only a temporary interruption of its long-term convergence pattern.
Simon Kuznets stressed the crucial importance of two factors for a country’s economic growth: technology and the institutions, in the broadest sense. He also explained how technology is a necessary, but not sufficient, condition for a country to continue its path toward prosperity; what is needed is that the turnover in technological paradigms be accompanied and accommodated by the necessary changes in the institutions and in the society’s ideology. Footnote 59 This is the point—also taken up in different ways by Abramowitz, Footnote 60 Baumol, Litan, and Schramm, Footnote 61 and more recently by Acemoglu and Robinson Footnote 62 —that goes straight to the heart of the issue of economic decline. In the course of their post-unification history, the Italians have repeatedly shown their ability to change; It happened with the so-called first globalization, and again after World War II. Nothing was slavishly repeated, but the new technological paradigms found fertile ground in the country thanks to the combination of institutions and ideologies favouring their adoption. Footnote 63 Although the elites’ ideology in the first decades following unification Italy was diffident about industrialization, Footnote 64 toward the end of the nineteenth century a ”historic block,” in Gramsci’s words, which actively undertook modernization and embarked upon industrialization had emerged, which led Italy during the Giolitti age but also in the Fascist period (think of liberal technocrats such as Alberto Beneduce, Giuseppe Toeplitz, Raffaele Mattioli, Giuseppe Cenzato, Donato Menichella, as well as private entrepreneurs like Giovanni Agnelli), to which it survived; it then designed the institutions of the economic miracle and ruled the country during the Golden Age. However, the grasp of such a modernizing block was never firmly ensured. First, it was always feeble in a consistent part of the country, the Italian Mezzogiorno. Footnote 65 Second, in the past decades it has arguably become weaker also at the national level, as held by Pierluigi Ciocca, among others; not by chance, if it is true that there were changes in comparative advantages caused by the euro setting and the new globalization era, the crucial problem was the inability of the Italian institutional and economic system to adapt to such a new context. Footnote 66
It is significant, however, that on both occasions when Italy converged toward the economic core (during the Giolitti age and the economic miracle), the country proved it had sufficient “social capability” and/or “inclusive” type institutions—to use the latest terminology introduced by Acemoglu and co-authors—supported by the modernization ideology of the ruling elite. What seems to characterize the past twenty years is, instead, an unprecedented inability to adapt to the context—once again, exogenously given—in which Italy finds itself. Not only is Italy not managing to change in order to stay at the forefront, but it also appears to have lost the capability of making the most of the advantages of backwardness (which still partly remains—just think of the Mezzogiorno).
Among the most convincing interpretations of this immobility is the one attributing the economic decline to Italian productivity, and thus to the loss of competitiveness, and to Italy’s specialization in low capital-intensive sectors—a vocation in line with the peculiar small size of Italy’s industrial enterprises. Footnote 67 A change in specialization requires innovation—not historically very great in Italy, but it has become even more difficult over the past few decades because the weight of large enterprises (which would have the resources for doing so) has progressively decreased, and also because, with public debt reduction policies, even public funding allocated to education and research has had to be curtailed. More generally, Italy has levels of schooling and of human capital below the average of the most developed countries (OECD, EU) and of the standards demanded today by the knowledge economy. Footnote 68 Low human capital and scarce innovation coupled with sluggishness of bureaucracy and costs of the civil justice system are unparalleled in any other advanced country; Footnote 69 these are well-known institutional flaws, which in the past three decades have proven themselves to be particularly resistant to tentative reforms, thus taking a high toll on enterprises’ efficiency. Footnote 70
The complexity of the theme of economic decline may perhaps be understood through an overall analysis that refrains from going into minute details to focus on grasping the underlying determinant factors: Technology and the institutions would appear to be the strongest factors to consider for a proper understanding of Italy’s modern economic growth and its future prospects.