Introduction
Molecular reactions mediated by metals are ubiquitous—spanning processes as diverse as photosynthesis, nitrogen fixation, and oxygen transport in blood. Metal-mediated reactions are also foundational in devices ranging from batteries and fuel cells to nonvolatile memories. Reference Arico, Bruce, Scrosati, Tarascon and van Schalwijk1–Reference Ohno12 In each of these systems, chemical reactions typically occur near or within metallic clusters or nanoparticles rather than bulk metals. Such nanoscale metallic systems appear less susceptible to damage compared to their bulk counterparts and exhibit extended life cycles, faster kinetics, and an increased product yield (for chemical catalysis) or storage capacity (for energy- and information-storage applications). However, relatively little is known about how the nanometal structure—such as its shape, size, and atomic arrangement—affects the thermodynamics and kinetics of such chemical reactions. To address questions about structure–function relations, it is crucial to observe chemical transformations in situ, as the reaction progresses, with nanometer- to-atomic-scale spatial resolution.
Observing chemical transformations in nanomaterials—and in particular, within individual nanoparticles—can be extremely challenging; however, recent advances in in situ electron microscopy promise unprecedented insight, with the potential for near angstrom-scale resolution even in reactive gaseous or liquid environments. Our research has capitalized on these advances, combining environmental transmission electron microscopy (TEM), plasmon electron energy-loss spectroscopy (EELS), and electron diffraction to investigate intercalation-driven transformations within individual nanoparticles. By combining the high spatial resolution of TEM with a sensitive spectroscopic technique, we can correlate a material’s atomic structure with its local phase at nanometer-scale spatial resolution and millisecond time resolution.
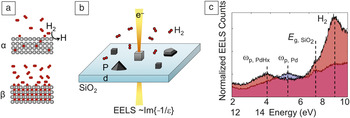
As a model system, we consider the hydrogenation and dehydrogenation of palladium. Conceptually, this reaction is extraordinarily straightforward, involving the catalytic splitting of hydrogen gas at the surface followed by intercalation of atomic hydrogen into the metal (see Figure 1a). Reference Flanagan and Oates13 At low H2 pressures, this system exists as a dilute solid solution, with H atoms sitting at random interstitial octahedral sites in the Pd; this α phase is characterized by a relatively low H content (less than ∼0.015 H atoms per Pd atom at 298 K), and a slightly expanded lattice constant compared to pure Pd (3.894 Å for α–PdH compared to 3.889 Å for pure Pd). At higher H2 gas pressures, a phase transition to the β phase occurs, signified by an H-to-Pd ratio exceeding ∼0.6 and a ∼3.7% expansion in lattice constant. The reaction is reversible, though the α-to-β transition often occurs at a higher H2 pressure than the β-to-α transition, giving rise to hysteresis emerging from the reaction mechanism.
In situ visualization of hydrogenation and dehydrogenation of individual metallic nanoparticles. (a) Schematic of the α-to-β beta phase transition in Pd (gray circles = Pd, red circles = H). (b) Environmental scanning transmission electron microscopy-electron energy-loss spectroscopy (STEM-EELS) experimental setup. The electron beam is localized over individual particles, and the loss spectra provide a direct measurement of the material phase. (c) Experimental EELS spectra of a single cubic nanocrystal. The measured peaks below 10 eV correspond to the bulk plasmon resonance of the nanocubes and can be used to track the hydrogenation state of the Pd. When the hydrogen pressure in the environment is 98 Pa (red shaded curve with peak ωp, PdHx), the particle is fully hydrided; when the hydrogen pressure is 4 Pa (blue/purple shaded curve with peak ωp, Pd), the particle is fully desorbed. E g is the material bandgap, ωp is the plasma frequency, and Im(ε) is the imaginary component of the material permittivity. Reference Baldi, Narayan, Koh and Dionne24

While initial investigations of palladium hydrogenation date back to 1866, Reference Graham14 establishing the intrinsic, size- and shape-dependent thermodynamic and kinetic properties of this reaction has only recently begun. Ensemble measurements of Pd nanoparticles have suggested thermodynamic properties that deviate significantly from the bulk, including a more gradual α-to-β phase transition and hysteretic gaps that disappear with reduced particle size. Reference Bardhan, Hedges, Pint, Javey, Whitelam and Urban10,Reference Sachs, Pundt, Kirchheim, Winter, Reetz and Fritsch15–Reference Yamauchi, Ikeda, Kitagawa and Takata17 However, as with all ensemble measurements, averaging effects can blur important thermodynamic and kinetic properties, and can make it challenging to disentangle the roles of particle size, shape, defect chemistry, and surface energetics.
Single-particle experiments avoid these problems and have revealed important and intriguing results. Reference Liu18–Reference Ulvestad, Welland, Collins, Harder, Maxey, Wingert, Singer, Hy, Mulvaney, Zapol and Shpyrko26 For example, single-nanoparticle studies conducted by using nearby plasmonic nanoantennas to sense the Pd phase have indicated sharp α-to-β transitions for colloidally synthesized particles Reference Syrenova, Wadell, Nugroho, Gschneidtner, Fernandez, Nalin, Świtlik, Westerlund, Antosiewicz, Zhdanov, Moth-Poulsen and Langhammer23 and more gradual transitions for evaporated nanoparticles. Reference Liu18,Reference Shegai and Langhammer20 These differences point toward the importance of defects within the particle and its elastic interaction with the support, but such optical studies are not easily combined with high-resolution imaging of the particle’s atomic structure to confirm this hypothesis. Further, some single-nanoparticle studies have revealed hysteretic gaps that are actually wider than in bulk samples, with phase-transition pressures that vary based on the particle geometry. Reference Syrenova, Wadell, Nugroho, Gschneidtner, Fernandez, Nalin, Świtlik, Westerlund, Antosiewicz, Zhdanov, Moth-Poulsen and Langhammer23,Reference Griessen, Strohfeldt and Giessen25 These results point toward distinct reaction mechanisms for varying particle shapes and sizes, Reference Griessen, Strohfeldt and Giessen25,Reference Ulvestad, Welland, Collins, Harder, Maxey, Wingert, Singer, Hy, Mulvaney, Zapol and Shpyrko26 but real-time mechanistic studies to date have been inhibited by the long acquisition times (on the order of minutes) needed to accurately infer the reaction progress.
Here, we describe the dynamic monitoring of this chemical transformation within individual nanoparticles. We used a combination of TEM, plasmon-EELS, and diffraction to image the chemical transformation thermodynamics and kinetics with nanometer-to-subnanometer spatial resolution and millisecond-to-second time resolution. As illustrated in Figure 1b–c, Reference Baldi, Narayan, Koh and Dionne24 this approach allows us to identify how an individual particle’s size, shape, crystallinity, surface termination, and defect chemistry impact its chemical transformation and the solute intercalation mechanism. First, we describe the investigation of the size- and shape-dependent thermodynamics of single and polycrystalline nanoparticles, including nanocubes, prisms, icosahedra, and rods, addressing outstanding questions about the nature of phase transitions and surface energy effects in zero- and one-dimensional nanomaterials. Next, we follow in real time the reaction dynamics of nanostructures, probing the mechanism of intercalation and deintercalation. Finally, we discuss how related in situ techniques can be used to monitor photocatalytic reactions and describe the design of plasmonic systems as next-generation photocatalysts.
Size- and shape-dependent thermodynamics of nanoparticles
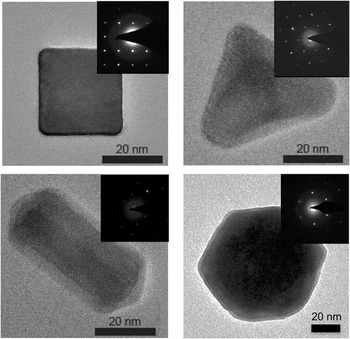
We prepare palladium nanocubes, prisms, rods, and icosahedra by adopting the colloidal syntheses proposed by Niu et al., Reference Niu, Zhang and Xu27,Reference Niu, Zhang and Xu28 Bisson et al., Reference Bisson, Boissiere, Nicole, Grosso, Jolivet, Thomazeau, Uzio, Berhault and Sanchez29 and Xiong et al. Reference Xiong, Cai, Wiley, Wang, Kim and Xia30 The cubes and prisms are single crystalline, while the rods and icosahedra are polycrystalline; accordingly, comparison of their hydrogenation thermodynamics provides insight into the role of particle shape and size as well as defects and grain boundaries. Figure 2 shows representative aberration-corrected electron micrographs of nanoparticles synthesized in our lab. Nanoparticles with sizes ranging from ∼5 nm to hundreds of nanometers can be made, with the specific size, shape, and surface faceting controlled by the reaction conditions.
Transmission electron micrographs and diffraction patterns of Pd nanocubes, prisms, rods, and octahedra colloidally synthesized in our lab.

For electron microscopy measurements, the particles are dispersed on a thin (∼20 nm) SiO2 TEM membrane. Unlike Si3N4 or carbon substrates, SiO2 is characterized by a flat, featureless EELS signal in the spectral range where Pd nanoparticles are expected to have bulk or surface plasmon resonances. Since the electron beam has a strongly reducing effect, its interaction with the nanoparticle ligands can lead to contamination. Accordingly, we have developed centrifugation routines and oxygen-plasma cleaning procedures that minimize the ligand concentration on the membranes, while also minimizing any oxidation of the Pd surface, and preventing contamination during the experiment.
Our experiments utilize a combination of techniques in an environmental TEM to elucidate the reaction mechanism. Selected-area electron diffraction (SAED), dark-field (DF) imaging, and scanning TEM (STEM) allow insights into the particle structure and crystallography. Complementary EELS characterizes electronic changes in Pd. In particular, since EEL spectra are proportional to the material permittivity, Reference García de Abajo31 and the permittivity varies with the Pd:H concentration, Reference Yamada, Tajima, Bao, Okada, Roos and Yoshimura32,Reference Gremaud, Gonzalez-Silveira, Pivak, de Man, Slaman, Schreuders, Dam and Griessen33 STEM-EELS enables direct, local correlation of a particle’s phase with its structure with ∼2-nm spatial resolution. Therefore, our combined SAED, DF, and STEM-EELS approach allows us to characterize both structural and chemical changes in particles upon intercalation and deintercalation of hydrogen.
Figure 1c illustrates experimental EEL spectra from a 23-nm single-crystalline Pd cube, collected by defocusing the electron beam to a spot size of ∼7 nm over the center of a nanocube. Spectra were acquired at two different H2 pressures—P = 4 Pa (at the beginning of the experiment, blue/purple shaded region), and P = 98 Pa (after hydrogen absorption, red shaded region). The measured peaks below 10 eV correspond to the bulk plasmon resonance of the nanoparticle and can be used to track the hydrogenation state of the Pd. Upon increasing the hydrogen pressure, a large and reversible shift in bulk plasmon resonance marks the transition from the α phase (peak at 7.7 eV) to the β phase (peak at 5.6 eV). Peaks at 11 eV and 13 eV correspond to the SiO2 substrate and the presence of hydrogen in the environment, respectively, and their amplitude merely changes with increasing/decreasing hydrogen pressures.
Single-crystalline nanoparticle thermodynamics
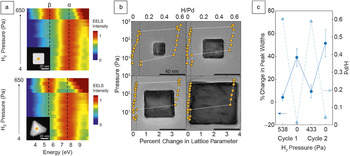
Figure 3a Reference Narayan, Baldi, Koh, Sinclair and Dionne34 shows the complete EEL spectrum evolution for a 24-nm Pd nanocube and a 31-nm nanoprism upon H2 pressure increase, from 4 Pa to 650 Pa. At each pressure, the system is allowed to settle for 30 min to reach equilibrium (the dynamics of the system are described in the next section). At the beginning of the absorption experiment (low H2 pressures), both particles are found in their α phase. During hydrogen absorption, the bulk EELS signal remains approximately constant until pressures exceed 350 Pa for the cube and 200 Pa for the prism. There, a sharp α-to-β transition is observed, indicated by the ∼2-eV red shift of the EELS peak. Importantly, the hydrogenation process is fully reversible, with both particles returning to their α phase upon H2 pressure decrease.
(a) Electron energy-loss spectroscopy (EELS) isotherms for a single-crystalline cube and prism, revealing sharp α-to-β phase transitions. (b) Diffraction isotherms for cubes of various sizes, revealing size-dependent loading pressures and hysteretic gaps, as well as incomplete unloading. (c) Analysis of diffraction spots of single-crystalline cubes reveals increased crystal quality upon hydrogen loading that is reversible upon cycling. Reference Narayan, Baldi, Koh, Sinclair and Dionne34,Reference Narayan, Hayee, Baldi, Koh, Sinclair and Dionne35

Such sharp phase transitions are observed not only using plasmon-EELS, but also via diffraction measurements, based on the lattice constant evolution. For example, Figure 3b Reference Narayan, Hayee, Baldi, Koh, Sinclair and Dionne35 plots pressure-composition isotherms using a series of SAED patterns for nanocubes with edge lengths of 19 nm, 33 nm, 48 nm, and 74 nm. Again, at each pressure, the system is allowed to reach equilibrium before a diffraction pattern is acquired. These measurements corroborate that the particles remain in a single phase at equilibrium and remain single-crystalline throughout both the α-to-β and β-to-α phase transitions. They also illustrate the size-dependence of the loading pressure—all nanoparticles transition from the α phase to the β phase at pressures well below the bulk transition pressure, and smaller particles tend to transition at lower pressures than larger nanoparticles. Reference Baldi, Narayan, Koh and Dionne24,Reference Narayan, Hayee, Baldi, Koh, Sinclair and Dionne35
These diffraction experiments also allow interrogation of the crystalline quality of the nanoparticles during the reaction. To elucidate how the phase transition affects the nanoparticle crystallinity, we cycle the particles with hydrogen and monitor the average change in the diffraction peak width of the observable spots referenced to the diffraction pattern of the pristine particle. A representative data set is shown in Figure 3c Reference Narayan, Hayee, Baldi, Koh, Sinclair and Dionne35 for a 31-nm nanocube. The spots become noticeably sharper after the α-to-β phase transformation; this behavior is seen consistently upon cycling. Since the reciprocal of the spot width is approximately proportional to the crystallite size, crystal quality increases during the loading process. The cycling data thus suggest that crystalline imperfections are introduced at some point during the transformation, but are healed upon complete hydrogen absorption. We will revisit these data when we discuss the real-time transformation data in the next section.
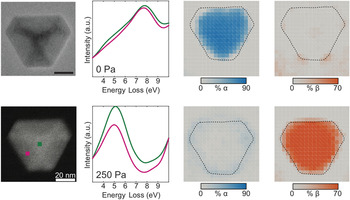
To visualize the thermodynamic distribution of phases within the nanoparticle, we acquired EELS maps, focusing the electron beam down to a small probe size (∼0.25 nm in our system) and raster-scanning the beam across the particle. Reference Narayan, Baldi, Koh, Sinclair and Dionne34 To ensure that the mapping process does not alter the hydrogenation state of the particle, we first load the particles and then “flash-freeze” them to 100 K. Such cold temperatures are chosen since palladium catalytically splits H2 and combines two hydrogen atoms on its surface prohibitively slowly below 220 K.
Figure 4 Reference Narayan, Baldi, Koh, Sinclair and Dionne34 shows EEL spectra and maps of a nanoprism in its unhydrogenated state (top row) and at a H2 pressure of 250 Pa (bottom row). EEL spectra are collected over the center of the particle (green line) and near the edge (magenta line) corresponding to the green and magenta squares in the bottom left figure. As expected, the spectra collected over the unhydrogenated particle are dominated by the α-phase bulk plasmon resonance, as they peak at ∼7.7 eV. At higher pressures, the spectra in both positions shift to 5.6 eV, corresponding to the peak energy of the β phase. Point-spectral measurements over the entire particle with a constant spatial displacement of 2–3 nm result in the maps shown in the right-most columns. The EELS maps confirm that the particle is entirely in the α phase at low pressures and in the β phase at high pressures, consistent with the isotherms in Figure 3. Similar results were also found for other single-crystalline nanoparticles, including cubes, rods, and octahedra. Therefore, in equilibrium, single-crystalline nanoparticles do not exhibit phase coexistence.
Electron energy-loss spectral maps of a single-crystalline nanoprism, revealing that the particle is in the pure α phase at low hydrogen pressures (top) and in the pure β phase at high hydrogen pressures (bottom). Reference Narayan, Baldi, Koh, Sinclair and Dionne34

Polycrystalline nanoparticle thermodynamics
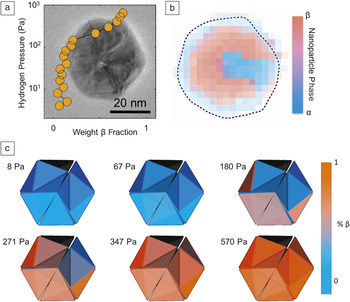
Compared to single-crystalline nanoparticles, polycrystalline particles provide the opportunity to study how defects and strain affect the reaction thermodynamics. For example, Figure 5 plots an EELS isotherm for a 37-nm Pd icosahedron, defocusing the beam over the center of the particle. Reference Narayan, Baldi, Koh, Sinclair and Dionne34 Unlike Pd cubes of similar size, the icosahedral particle shows incomplete loading (i.e., the isotherm never reaches a β-phase weight of 1). The EELS map, shown in Figure 5b, indicates that the core of the icosahedra remains in the α phase, even at the highest hydrogen pressures. Such incomplete loading arises from compressive strain of the particle core. In particular, the icosahedra are composed of 20 tetrahedral crystallites, which can only form the complete volume of the particle via a compressive strain at the core and a tensile strain at the surface. The ∼5% compressive strain at the core of the nanoparticle reduces the hydrogen solubility and prevents the core from transforming to the β phase.
(a) Isotherm and (b) electron energy-loss spectroscopy map of multiply twinned icosahedra at a hydrogen pressure of 250 Pa, showing that the core remains unloaded, due to compressive strain. (c) Three-dimensional particle reconstructions from dark-field imaging and diffraction illustrate how each of the 20 constituent crystallites load at distinct pressures within the icosahedron. Reference Narayan, Baldi, Koh, Sinclair and Dionne34

Additionally, the icosahedral nanoparticle shows no clear sharp transition between the α and β phases; instead, the isotherms are sloped. Such sloping could arise from two possibilities: (1) the particle could be forming a solid-solution (i.e., a gradually changing, but uniformly distributed) concentration of hydrogen in the nanoparticle; or (2) the particle could exhibit mosaic loading, where individual crystallites abruptly change phase, though each at distinct pressures. To determine which mechanism dominates the thermodynamics of icosahedra, we coupled in situ SAED with DF imaging. Such techniques allow us to determine how the lattice constant of individual crystallites within the nanoparticle changes with pressure. The results, shown in Figure 5c, Reference Narayan, Baldi, Koh, Sinclair and Dionne34 indicate that individual crystallites abruptly transition from α to β phases, but each at markedly different H2 pressures. Such an intraparticle mosaic loading process likely stems from the presence of twin planes that can serve as incoherent phase boundaries. In other words, these twin planes can relax the strain arising from the lattice mismatch between the α and β phases.
In addition to “zero-dimensional” nanoparticles, we have also investigated nanorods and nanowires to explore the effects of aspect ratio and surface faceting. In energy- and information-storage systems, nanorods have been shown to give rise to faster kinetics, improved reversibility, and better faradaic efficiencies compared to other nanoscale geometries, Reference Bruce, Scrosati and Tarascon5,Reference Manthiram, Murugan, Sarkar and Muraliganth36,Reference Li, Cui, Ross, Kim, Sun and Yang37 likely owing to their directional electronic and ionic transport. Further, it is hypothesized that nanorods can relieve strain through lateral relaxation—a particularly important consideration for lithium-ion and metal-hydride batteries that undergo large lattice deformations during charging and discharging. Reference Ertekin, Greaney, Chrzan and Sands38
We studied 33 individual nanorods in situ with lengths ranging from 45 nm to 550 nm and radii of 7 nm to 16 nm. Reference Hayee, Narayan, Baldi, Koh, Sinclair and Dionne39 We find that the β phase always nucleates at the nanorod tips, with the nucleation pressure independent of rod length. Rods shorter than ∼55 nm tend to exhibit only one phase in equilibrium, whereas rods longer than ∼60 nm always show phase coexistence. Moreover, nanorods longer than 150 nm usually support two α-β phase interfaces. Such phase-coexistence occurs even within single crystallites of the pentatwinned nanorod. Our experimental results also indicate defect formation associated with phase coexistence. These results suggest that the most promising pentatwinned nanorod geometries for devices are those with aspect ratios less than ∼3 and radii below 10 nm; such small-radius nanorods should result in a coherent (i.e., defect-free) phase transition, maximizing device cyclability.
Dynamic imaging of intercalation-driven transformations
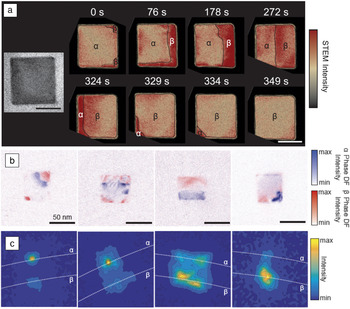
The previously discussed analysis focused on equilibrium; however, our in situ techniques also enable direct visualization of hydrogenation intercalation and deintercalation in real time. In particular, we found that STEM imaging can be used to map the dynamic reaction progression by presenting diffraction contrast between the α and β phases. The bright and dark regions seen in STEM images can be assigned to a particular phase using EELS, as shown in Figure 6 . Reference Narayan, Hayee, Baldi, Koh, Sinclair and Dionne35 Therefore, at a given pressure, we can use STEM imaging to map how particular phases evolve across individual nanoparticles with millisecond resolution. Reference Narayan, Hayee, Baldi, Koh, Sinclair and Dionne35 Such real-time visualization of nonequilibrium states allows us to address outstanding questions about the phase-transformation mechanism.
(a) Scanning transmission electron microscopy (STEM) electron energy-loss spectroscopy time series showing propagation of the β phase across the particle. Scale bar = 25 nm. (b) Dark-field (DF) images showing the β phase nucleating and growing across a single-crystalline cubic nanoparticle, and (c) corresponding diffraction patterns showing a 1.5° lattice rotation and decreased crystalline quality during the reaction. Reference Narayan, Hayee, Baldi, Koh, Sinclair and Dionne35

STEM time series from one cubic particle with an edge length of 43 nm are shown in Figure 6a at a hydrogen pressure of 250 Pa. As seen, the reaction begins with the formation of a β-phase nucleus in one or more corners (here, two corners) of the particle. While the orientation of the interface between the β nuclei and the α-phase matrix cannot be deduced from the STEM images, the diagonal nature of the phase boundary is consistent with a (111) interface. After nucleating, the β phase then grows to form a (100) phase front. The phase front initially reorients itself continuously, but eventually stabilizes in one of the 〈100〉 directions.
The β-phase front then begins to slowly propagate across the particle. For example, from 0 to 76 s, approximately 20% of the particle has converted from the α to the β phase. In the next 200 s, approximately 50% of the particle has transformed; the transformation rate during this time has reduced by more than a factor of two. Given that growth is faster at earlier stages of the process, the reaction is unlikely to be surface limited; as a result, the movement of the phase boundary limits the reaction rate. After a slow progression through the bulk of the particle, the later stages of the phase transformation occur very quickly. Upon nearing the edge of the particle, the α phase is restricted to a corner of the particle, as seen in the 329 s and 334 s snapshots of Figure 6a. The morphologies of the two phases in this stage resemble those seen during the initial stages of the reaction, implying that the beginning and end of the reaction occur by a similar mechanism.
To obtain higher-resolution snapshots of nonequilibrium states, we can “flash-freeze” the reaction while it is in progress and interrogate the intermediate states using SAED. The process we have developed is as follows. First, we rapidly increase the hydrogen partial pressure to one that is slightly above the pressure required for the α-to-β transition. After a short period of time (seconds to minutes), we rapidly cool the nanoparticles to 100 K, while slowly purging the hydrogen from the sample compartment. We then collect a diffraction pattern of an individual particle, which should now be “frozen” into an intermediate, nonequilibrium state.
Since the diffraction spots shift inward upon transitioning to the β phase, spots arising from the two phases are easily resolvable. Introducing an objective aperture allows for the selection of electrons diffracting from a single phase; these electrons can then be used to generate a displaced-aperture DF image. Figure 6b includes overlaid DF images collected from the outside (blue) and inside (red) diffraction spots of four different, but similarly sized, cubic particles. As seen, individual particles are frozen into different nonequilibrium states that closely parallel those seen in the dynamic STEM measurement. Notably, the β phase nucleates in a corner of the cube, eventually forming a (100) phase front that propagates across the cube and pushes out the α phase through a (111)-type interface.
Figure 6c includes zoomed-in diffraction patterns from each of these particles, focusing on the 020 spot, which consists of two subspots. As the β phase nucleates in the cube corner, there are only two subspots—one corresponding to the α phase and one corresponding to the β phase. Each of these spots essentially lie on the same radial line. As the β grows to form a (100) interface, each spot appears to smear into a streak, splitting into two α-β pairs. A fit of the two sets of lattices shows that one is rotated by approximately 1.5° with respect to the other. This secondary set of spots implies that a portion of the lattice exists in a slightly different orientation than the rest of the particle, suggesting either a dislocation or strained rotation. By the time the α phase is nearly pushed out of the particle (right-most panel), there are no longer two sets of lattices in the particle that show different orientations. This absence suggests that the particle has removed crystallographic imperfections during the loading process. Such nanoparticle “self-healing” is consistent with the diffraction isotherm trends seen in Figure 3c. In addition to elucidating why certain nanoparticles are so durable for energy and information storage applications, these results may help inform optimal nanoparticle design for next-generation energy and information-storage applications.
In situ plasmon photocatalysis
As a final application example, we note that metallic nanoparticles are emerging as a new class of heterogeneous photocatalysts due to their ability to efficiently absorb light and convert it into chemical energy. Compared to traditional photocatalysts, plasmonic nanoparticles possess a number of useful features for photocatalysis, including optical near-field enhancement, local heat generation, and efficient hot carrier generation, all of which can be exploited to control and enhance chemical reactions. Reference Zhang, Chen, Liu and Tsai40–Reference Swearer, Zhao, Zhou, Zhang, Robatjazi, Martirez, Krauter, Yazdi, McClain, Ringe, Carter, Nordlander and Halas43 However, since many plasmon photocatalyst studies are based on ensemble measurements, nanoparticle heterogeneity can conceal important and interesting structure-dependent catalytic properties. Further, many studies lack the nanometer-scale spatial resolution to help elucidate the role of plasmons in photocatalytic reactions.
Recently, we have developed methods to couple light into and out of the transmission electron microscope, enabling the first experimental visualization of a plasmon-induced reaction at the single-nanoparticle level. Reference Vadai, Hayee, Sytwu, Angell and Dionne44 In particular, we have studied the photocatalytic dehydrogenation of single palladium nanocubes. These Pd nanoparticles are positioned next to lithographically patterned Au nanodiscs, which serve as nanoantennas to more strongly absorb light at visible frequencies. The Pd nanocubes and Au nanodiscs form antenna (Au)—reactor (Pd) systems of varying interparticle separation, from 0 nm (touching) to 20 nm. Upon illumination, the desorption rate of hydrogen from the Pd nanocubes is significantly enhanced, pushing the system out of equilibrium, resulting in an α to β phase change. These changes are monitored in real time using a combination of direct imaging and single-particle electron diffraction. This photocatalytic process is wavelength dependent, with a maximum rate at the plasmon resonance of the Au particles. Additionally, distance-dependent measurements show that the rate enhancement is more pronounced in the Au-Pd dimers with smaller separations. Finally, real-time imaging suggests that the particular interfaces formed during desorption differ when compared with unilluminated particles, indicating that plasmons may modify the reaction mechanism. While this work is just beginning, the unique capabilities of combined environmental electron microscopy and optical illumination allow us to study photoinduced reactions with unprecedented resolution, helping to unravel the role of hot carriers, local heating, and light-mediated ion and electron transfer in nanomaterials.
Conclusions
Metal-mediated reactions are ubiquitous in a variety of chemical, biological, energy, and information-related systems, and the hydrogenation of palladium presents a rich model reaction in which to explore these processes. The phase transition from the dilute α phase to the hydrogen-rich β phase is characterized by fast kinetics at readily achievable transition temperatures and pressures, making experimental design straightforward. Concurrently, investigations of the thermodynamic and kinetic properties of palladium hydrides have a long, rich history still steeped with scientific debate.
Nanoscale metals bring about questions such as: What is the size- and shape-dependence of thermodynamic and kinetic processes? How do different crystallographic orientations affect the transformation? What is the impact of strain and disorder? and, What mechanisms govern surface catalysis and solute intercalation and deintercalation? Until recently, such questions have proven prohibitively challenging to address, since so few techniques allow correlation of a particle’s size, shape, crystallinity, defect density, and internal strain to its thermodynamics and kinetics with sufficiently high spatial and temporal resolution. Thanks to advances in environmental electron microscopy, our single-particle TEM-EELS approach offers an exciting opportunity to address these questions.
Taken together, our results on both single and polycrystalline nanoparticles indicate several interesting trends. First, single-crystalline nanoparticles such as cubes and prisms do not exhibit thermodynamic phase coexistence; they therefore maximize chemical energy storage at a given chemical potential. This result is in contrast with polycrystalline particles, such as icosahedra and rods, where defects, strain, and surface faceting facilitate phase coexistence. Second, multiple shapes of single-crystalline particles all show sharp phase transitions, suggesting that the internal crystal structure of the particle plays a larger role than its shape in determining the hydrogen absorption/desorption mechanism. Third, particles show size- and surface-termination dependent loading pressures, with larger particles tending to load at larger equilibrium pressures. Therefore, it is relatively “easier” to store energy in smaller nanoparticles at a given chemical potential. Fourth, the crystalline quality appears to improve upon complete hydrogen absorption, and single-crystalline particles have the ability to self-heal upon intercalation. Such results indicate why certain nanoparticle-based systems devices exhibit long life cycles and point toward even more durable, long-lifetime designs. Finally, light and the excitation of surface plasmons offer a burgeoning opportunity to control chemical transformation, not only modifying the reaction kinetics but also offering an opportunity to tailor the reaction mechanism.
While we have focused on metal nanoparticle hydrogenation, the mechanism explored here can likely be generalized to any system in which a reservoir of intercalants is in contact with a host lattice, including Li-ion insertion in battery electrodes, hydrogen absorption in state-of the-art metal hydride catalysts, and ion exchange reactions in quantum dot syntheses. It therefore provides insights crucial to the design and optimization of next-generation materials for energy- and information-storage applications. More generally, our in situ detection scheme could offer new avenues to study transformations of single metallic clusters or nanoparticles in a wide range of reactive chemical and biological environments, with as-of-yet unknown or unresolved properties.
Acknowledgments
Enormous gratitude to A. Baldi, T. Narayan, F. Hayee, M. Vadai, and A.L. Koh, without whom this research would not be possible, and to B. Sinclair who has been an incredible mentor in in situ electron microscopy. I am also very appreciative of the assistance and inspiration provided by my current and former lab members, Stanford’s materials science department, the nanophotonics and plasmonics communities, and the broader materials research community. Finally, thanks to NSF (1151231 and 1641109), AFOSR (FA9550–15–1-0006), Northrop Grumman, and the Camille and Henry Dreyfus Foundation for funding.

Jennifer A. Dionne is an associate professor of materials science and engineering at Stanford University. She received her BS degrees in physics, and systems and electrical engineering from Washington University in St. Louis, and her PhD degree in applied physics at the California Institute of Technology. She was a postdoctoral researcher in chemistry at the University of California, Berkeley. Her research focuses on new nano- and optical materials for applications ranging from high-efficiency energy conversion and storage to bioimaging and manipulation. She has developed in situ techniques to visualize chemical transformations and light–matter interactions with nanometer-scale spatial resolution. She is a recipient of the Adolph Lomb Medal (2016), Sloan Foundation Fellowship (2015), the Presidential Early Career Award for Scientists and Engineers (2014), and the inaugural Kavli Early Career Lectureship in Nanoscience (2014). Dionne can be reached by email at jdionne@stanford.edu.