
I. INTRODUCTION
Single crystals have superior dielectric and electromechanical properties as compared with polycrystalline ceramics due to the averaging of physical properties in the latter. However, single crystals have not been fully exploited because of the difficulties and high cost of crystal growth techniques and limitations to the growth of several piezoelectric compositions. Therefore, efforts have been focused on aligning grains in specific directions to access the anisotropic single crystal properties in a polycrystalline matrix. Templated grain growth (TGG) has been successfully applied to align the grains (i.e., texture or grain orientation) using anisotropically shaped single crystal template particles dispersed within the matrix to initiate anisotropic grain growth during sintering. Reference Messing, Sabolsky, Trolier-McKinstry, Duran, Kwon, Brahmaroutu, Park, Yilmaz, Rehrig, Eitel, Suvaci and Seabaugh1–Reference Duran, Trolier-McKinstry and Messing3
Binary and ternary Pb(Mg1/3Nb2/3)O3-based compositions have been extensively studied for potential device applications. Pb(Mg1/3Nb2/3)O3–0.32PbTiO3 (PMN–32PT) ceramics were textured using 5 vol% BaTiO3 (BT) templates by reactive TGG and enhanced piezoelectric properties were reported (e.g., unipolar strain of 0.28–0.32% and low-field (<10 kV/cm) piezoelectric charge coefficient (d 33) ∼1000–1400 pm/V at 50 kV/cm) with a relatively lower Curie temperature (T C) of 160–170 °C. The rhombohedral to tetragonal phase transition occurred at nearly 65 °C Reference Sabolsky, James, Kwon, Trolier-McKinstry and Messing4 and 90–100 °C. Reference Sabolsky, Trolier-McKinstry and Messing5 Highly textured PMN–32.5 PT using as low as 1 vol% BT (the Lotgering factor = 0.97) had a d 33 of 1000 pC/N. Reference Zhou, Yan, Priya and Wang6 PMN–32PT and PMN–0.37PbTiO3–0.21PbZrO3 (PMN–PZT) ceramics were textured using 5 vol% BT templates. Both compositions reached a d 33 of 878 pm/V and a unipolar strain level of 0.25% measured at 30 kV/cm. T C’s were ∼150 °C for PMN–32PT and 220 °C for PMN–PZT. Reference Richter, Denneler, Schuh, Suvaci and Moos7 Textured PMN–32.5PT was also prepared using 1–5 vol% SrTiO3 (ST) templates. A unipolar strain of 0.32% and a low-field (<5 kV/cm) d 33 of 1660 pm/V at 50 kV/cm (5 vol% ST) were reported (the Lotgering factor = 0.70). Dissolution of ST in the matrix decreased T C to 120 °C, but the properties were still significantly higher than the random samples even in the presence of a paraelectric ST phase. Reference Kwon, Sabolsky, Messing and Trolier-McKinstry8 ST-templated and hot pressed PMN–40PT had a bipolar strain of 0.34% and a low-field (<10 kV/cm) d 33 of 1100 pm/V at 26 kV/cm together with a T C of ∼190 °C. Reference Andreeta, dos Santos, Andreeta, Lente, Garcia, Hernandes and Eiras9 He et al. Reference He, Li, Wang, Long, Mao and Ye10 grew Pb(Mg1/3Nb2/3)O3–Pb(Yb1/2Nb1/2)O3–PbTiO3 (0.53PMN–0.15PYbN–0.32PT) single crystals by the top-seeded solution method as an alternative to low Curie temperature PMN–PT and Pb(Zn1/3Nb2/3)O3–PbTiO3 single crystals and reported electromechanical properties (e.g., d 33 of 1800 pC/N, remnant polarization of 27.8 μC/cm2, coercive field of 7 kV/cm and T C of 205 °C). They also mentioned tuning the composition due to the low rhombohedral–tetragonal phase transition temperature of 50 °C for device applications. Chang et al. Reference Chang, Sun, Wu, Wang, Zhang, Yang, Messing and Cao11 textured Pb(In1/2Nb1/2)O3–Pb(Mg1/3Nb2/3)O3–PbTiO3 ceramics with 5 vol% BT templates (the Lotgering factor = 0.94) and reported a unipolar strain of 0.4% and d 33 of 1620 pm/V at 50 kV/cm together with higher rhombohedral–tetragonal transitions and Curie temperatures of 120 and 200 °C, respectively. In general, it is highly desirable to adjust compositions without (or, unless possible, with higher) low-temperature phase transitions (and at the same time with high Curie temperatures) to exploit the electromechanical properties for high-power electromechanical transducers operating in a wider temperature range.
In this study, the 0.62[0.75(Pb(Mg1/3Nb2/3)O3)–0.25(Pb(Yb1/2Nb1/2)O3)]–0.38PbTiO3 (0.62[0.75(PMN)–0.25(PYbN)]–0.38PT) ternary system was textured in the [001] via the TGG method using 1–7 vol% platelike BT templates. Processing and ferroelectric properties at various PMN/PYbN mole ratios as well as preliminary texture study were detailed in our earlier studies. Reference Akça, Yılmaz and Duran12–Reference Duran, Dursun and Akça14 The particular aim was to investigate dielectric and piezoelectric properties as a function of the template concentration in a systematic way in an attempt to keep the Curie temperature greater than nearly 200 °C for potential device applications at high temperatures. Template-free and template-containing random samples were also prepared and compared with the textured samples.
II. MATERIALS AND METHOD
The synthesis of powders and preparation of final ceramic compositions were detailed in our earlier studies Reference Akça, Yılmaz and Duran12,Reference Akça and Duran13 and briefly summarized here. Intermediate compositions such as PbTiO3, MgNbO6, and YbNbO4 were prepared by solid-state calcination. The final composition 0.62[0.75(PMN)–0.25(PYbN)]–0.38PT with an excess 0.7 wt% PbO was prepared by ball milling in isopropyl alcohol using ZrO2 balls, dried overnight at 40 °C, and then calcined at 750 °C for 2 h to obtain a single perovskite phase. The BT template particles were synthesized using a two-step molten salt and topochemical reaction. Reference Liu, Yan and Zhou15 A vinyl-based binder solution (TC-S1, MSE Teknoloji Inc., Gebze, Turkey) and matrix powder were mixed by ball milling for 24 h to prepare tape casting slurries. The slurries were transferred into glass beakers and then BT templates (1, 5, and 7 vol%) were incorporated into the slurries and further stirred overnight for homogenous mixing. Tape casting was performed on a glass substrate at a speed of 10 cm/s and a blade gap of 0.25 mm to align BT templates in the matrix powder with the template 〈001〉 perpendicular to the surface of the tape-cast sheet. After drying at room temperature for 1 h, tapes were cut and about 30 layers were laminated at 15 MPa. The polymers were burned out at 600 °C for 1 h with a heating rate of 1 °C/min. Then, the samples were sintered at 1250 °C for 4 h under flowing oxygen atmosphere supplied after 750 °C. Reference Duran, Dursun and Akça14 PbO/ZrO2 atmosphere powder was used to control the PbO atmosphere during sintering in a double Al2O3 crucible configuration. Textured samples are hereafter referred to as T1 (1 vol% BT), T5 (5 vol% BT), and T7 (7 vol% BT). For comparison with the textured samples, two kinds of random samples were prepared, namely, template-free (hereafter referred to as R) and template-containing (hereafter referred to as T1R, T5R, and T7R). The R samples were prepared by ball milling a reactive powder mixture of PMN–32.5PT and PYbN–50PT in isopropyl alcohol using ZrO2 balls. They were shaped by cold isostatic pressing at 80 MPa for 3 min and then sintered at 1000 °C for 4 h in air. Reference Akça and Duran13 However, the T1R–T7R samples were prepared in a mortar and pestle so as not to damage the template particles by mixing single phase matrix powder and respective BT template ratios together by adding a binder solution (e.g., 2 wt% binder with respect to dry weight of the powder). These samples were shaped by pressing at 100 MPa and then sintered in oxygen together with the T1–T7 samples. Final matrix powder compositions (i.e., single phase and reactive mixture) were adjusted to be the same in all the samples. The density of sintered samples was measured by Archimedes’ technique. The phase formation and crystallographic texture were checked by X-ray diffraction (XRD) (Bruker D8 Advanced, Bruker AXS GmbH, Karlsruhe, Germany). The Lotgering factor Reference Lotgering16 was used to calculate texture fraction, f,
 $$f = {{\left( {P - {P_{\rm{o}}}} \right)} \mathord{\left/ {\vphantom {{\left( {P - {P_{\rm{o}}}} \right)} {\left( {1 - {P_{\rm{o}}}} \right)}}} \right. \kern-\nulldelimiterspace} {\left( {1 - {P_{\rm{o}}}} \right)}}\quad ,$$
where P and P o are [I (001) + I (002)]/ΣI (hkl) in the textured and random XRD patterns, respectively. The samples were electroded with silver paste and then baked at 600 °C for 30 min in air. The frequency and temperature dependence of the dielectric properties were measured (at 1 V AC) using an inductance–capacitance–resistance meter (Hioki IM 3570, Japan) during heating (2 °C/min heating rate, poled samples) and cooling (cooling rate of 2 °C/min from 350 °C). The furnace temperature was calibrated within ±5 °C using a known-Curie temperature piezoceramic. Poling was performed in silicone oil at 120 °C for 15 min at 25 kV/cm. Polarization–electric field and unipolar strain–field loops were recorded at room temperature and at 1 Hz using a ferroelectric (FE) testing unit Precision LC (Radiant Inc., Albuquerque, New Mexico). The piezoelectric strain coefficient, d 33, and hysteresis were calculated from the unipolar strain-field curves by an MTI-2000 fotonic sensor (MTI Instruments Inc., Albany, New York).
III. RESULTS AND DISCUSSION
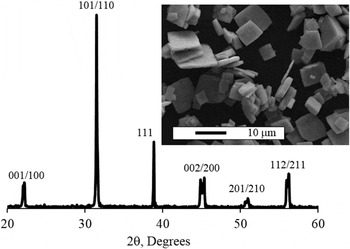
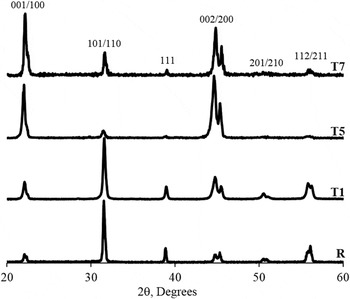
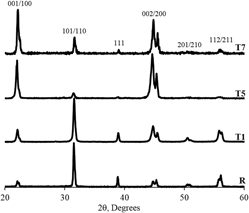
Figure 1 shows the XRD pattern and scanning electron microscope (SEM) picture of the BT template particles synthesized by a two-step molten salt and topochemical reaction. Reference Liu, Yan and Zhou15 The SEM micrograph depicts that the platelet particles had an average size of ∼5–10 μm and a thickness of ∼0.5–1 μm, and XRD proved a single perovskite phase formation. The aspect ratio of the particles was suitable to be oriented under shear force during tape casting. Reference Suvaci and Messing17,Reference Seabaugh, Kerscht and Messing18 Figure 2 compares XRD patterns of the random and textured samples. All peaks belonged to the perovskite phase and splitting in the peaks indicated a tetragonal crystal structure. Texture formation was limited for the T1 sample (f = 0.21) but growth on templates was favored with increasing template particles and an f = 0.91 was obtained in the T5 sample. With further increasing the template content (T7), a lower f = 0.71 was calculated. These results indicate that 5 vol% BT template content was the best amount to reach the highest f in this system. A reactive mixture of PMN–32.5PT and PYbN–50PT powder was used in the R samples, Reference Akça and Duran13 and a single phase 0.62[0.75PMN–0.25PYbN]–0.38PT powder was used in the T1–T7 samples. To understand the effect of matrix powder calcination and sintering atmosphere on texturing, samples containing a reactive mixture were also prepared and sintered in air or oxygen. A pyrochlore phase appeared after sintering at 1050 °C although a highly textured structure (f = 0.92 for T5) was obtained when a reactive mixture was sintered at 1250 °C in air. When a reactive mixture was sintered at 1250 °C in oxygen, the T1 sample was not textured, the T5 sample had a pyrochlore phase without any texture, and the T7 sample had more pyrochlore phase with a limited texture (f = 0.43). Limited texture (e.g., f = 0.11 for T1 and f = 0.44 for T7) was obtained when a single phase matrix was sintered at 1250 °C in air. These results indicated that the reactive matrix facilitated pyrochlore formation in the template-containing samples irrespective of whether they were sintered in air or oxygen. On the other hand, the pyrochlore phase did not form up to 1200 °C in air for the reactive matrix (the R samples). Reference Akça and Duran13 Pyrochlore formation may be attributed to a possible competition between perovskite phase formation and/or its stability with increasing temperature and texturing during the TGG process, because the degree of texture increased sharply after matrix densification; in other words, significant texture development required a higher temperature to facilitate grain growth. Reference Messing, Sabolsky, Trolier-McKinstry, Duran, Kwon, Brahmaroutu, Park, Yilmaz, Rehrig, Eitel, Suvaci and Seabaugh1,Reference Chang, Sun, Wu, Wang, Zhang, Yang, Messing and Cao11 In the PMN–PYbN–PT system, matrix densification takes place at lower temperatures such as 1000 °C for the R sample (ρ = 98% of theoretical density). Reference Akça and Duran13 As for the T5 sample, f = 0.53 at 1000 °C (ρ = 95% of theoretical density) and f = 0.91 at 1250 °C (ρ = 98% of theoretical density) after sintering for 4 h in oxygen. Furthermore, PMN–PT is easily textured on BT templates Reference Sabolsky, James, Kwon, Trolier-McKinstry and Messing4,Reference Richter, Denneler, Schuh, Suvaci and Moos7 but textured PYbN–PT has not been reported in the literature. Note that PYbN–PT can be densified at temperatures as low as 900 °C and the pyrochlore phase forms at temperatures ≥1050 °C. Reference Duran, Trolier-McKinstry and Messing19 Sintering under oxygen atmosphere was also successfully applied in texturing PMN-based ceramics using BT and ST templates. Reference Sabolsky, James, Kwon, Trolier-McKinstry and Messing4,Reference Richter, Denneler, Schuh, Suvaci and Moos7,Reference Kwon, Sabolsky, Messing and Trolier-McKinstry8,Reference Chang, Sun, Wu, Wang, Zhang, Yang, Messing and Cao11,Reference Brosnan, Messing, Meyer and Vaudin20 Therefore, the effect of sintering atmosphere (air or oxygen) and the matrix condition (reactive or single phase) should be further investigated in detail, because it does affect the perovskite phase formation and/or texturing on BT templates. Current results suggest that highly textured microstructures are obtained when a mixture of single phase matrix powder and template particles is sintered in oxygen (e.g., 1250 °C for 4 h) and random samples are obtained when a reactive powder mixture is sintered in air (e.g., 1000 °C for 4 h).
XRD pattern and SEM picture of the BT templates.

XRD patterns of the samples.

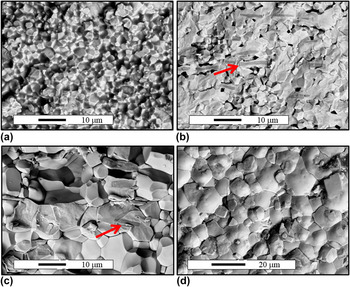
Figure 3 shows SEM pictures of the samples. Fracture surfaces reveal that the R sample had a uniform grain size distribution of <5 μm without any abnormal/exaggerated grain growth [Fig. 3(a)]. Matrix grain growth on aligned BT templates started and improved with increasing temperature from 1000 °C [Figure 3(b)] to 1250 °C [Fig. 3(c)]. Although the R and T5 samples were sintered at 1000 °C [Figs. 3(a) and 3(b)], the bigger particle size of the BT particles in the T5 sample caused retarded densification (98% versus 95% of theoretical density), as evident from some pores located around the template particles and limited texture development (f = 0.53). Increasing temperature to 1250 °C [Fig. 3(c)] promoted densification to 98% of theoretical density and subsequently f = 0.91 was obtained, which states that the absence of exaggerated grain growth in the matrix, as well as, close contacts between template particles and matrix grains were required for a successful TGG process. A relative density below 90% was reported to inhibit texture formation. Reference Suvaci and Messing17 Figure 3(c) further reveals that there were no pores entrapped within the grown regions during the TGG process by means of Ostwald ripening (i.e., consumption of the finer matrix grains by the larger textured grains). Reference German, Suri and Park21 The intergranular liquid PbO phase (added as 0.7 wt% excess) facilitated dissolution of finer matrix grains due to their higher solubility and then deposition/reprecipitation on the lower energy surfaces (e.g., {001}) of the bigger textured grains tended to decrease the system total energy. Grain growth ceased when the growing boundaries impinged on each other, as seen from the blocklike 10–20 μm grains in Fig. 3(d). A schematic representation as well as TEM observations on texture formation by the TGG process were detailed elsewhere for BT-textured PIN–PMN–PT ceramics. Reference Chang, Sun, Wu, Wang, Zhang, Yang, Messing and Cao11 The BT template particles (as marked by arrows) are also clearly distinguished in the microstructures [Figs. 3(b) and 3(c)]. In our earlier study, Reference Duran, Dursun and Akça14 SEM-energy dispersive X-ray analysis proved that the BT did not dissolve in the matrix and there was no interdiffusion of ions between template particles and matrix grains. In other words, BT templates were chemically stable in the lead-based environment for texturing, but at the same time gave rise to the formation of a composite structure whose physical properties were dependent on the template concentration. Similar results were also observed in the literature. Reference Zhou, Yan, Priya and Wang6,Reference Richter, Denneler, Schuh, Suvaci and Moos7,Reference Chang, Sun, Wu, Wang, Zhang, Yang, Messing and Cao11
SEM pictures of the samples: (a) R fracture surface, (b) T5 fracture surface (sintered at 1000 °C), (c) T5 fracture surface (sintered at 1250 °C), and (d) T5 as-sintered surface (sintered at 1250 °C). Arrows indicate the BT template particles.

In texturing ceramics, there is a best (or critical) template concentration to attain the highest texture available and this concentration depends on the composition (e.g., crystal structure) and processing parameters such as liquid phase and sintering temperature. Reference Duran, Trolier-McKinstry and Messing3,Reference Suvaci and Messing17 Below a critical template concentration, the number of template particles is not enough (i.e., far from each other) to induce full texturing by consuming all matrix grains. Above a critical concentration, on the other hand, the template frequency per volume is higher to consume the matrix grains but the tangling of the template particles during tape casting starts to cause misalignment of some templates, particularly smaller template particles as seen in Fig. 1. As a result, grain growth on misaligned templates during sintering causes off-axis texturing with respect to the [001], resulting in lower f. This result is consistent with the grain growth behavior of the samples given in Fig. 3. The R sample [Fig. 3(a)] has a uniform grain size distribution of <5 μm which indicates that abnormal grain growth is not observed. In other words, grain growth by the Oswald ripening mechanism is possible only when the template particles are present [Figs. 3(b)–3(d)]. Similar microstructure development has also been observed in the BT-templated PMN–PT ceramics. Reference Zhou, Yan, Priya and Wang6,Reference Kwon, Sabolsky, Messing and Trolier-McKinstry8,Reference Chang, Sun, Wu, Wang, Zhang, Yang, Messing and Cao11,Reference Brosnan, Messing, Meyer and Vaudin20 Note that the Lotgering factor is a qualitative method and does not give information about the texture distribution. Misorientation from [001] broadens the texture distribution and subsequently lowers f, necessitating more comprehensive texture characterization methods such as rocking curves, pole figures, and electron backscattered diffraction. Reference Richter, Denneler, Schuh, Suvaci and Moos7,Reference Brosnan, Messing, Meyer and Vaudin20
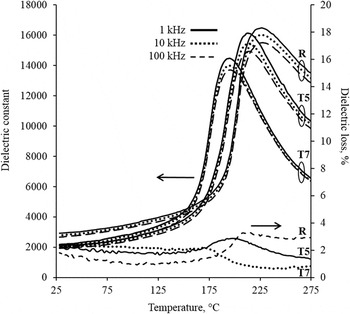
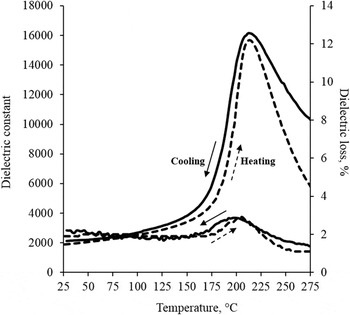
Figures 4 and 5 compare the temperature and frequency dependence of dielectric properties of the samples, and Table I summarizes the key dielectric data measured during heating and cooling. Figure 4 shows that the Curie temperature (T C) decreased with increasing BT content, which can be attributed to a composite effect within the microstructure, because BT has a lower T C (130 °C Reference Xie, Yin, Hashimoto, Tokano, Sasaki and Sato22 ) with respect to the matrix phase (i.e., 226 °C for the R sample). Textured and random ceramics experienced no frequency dispersion and thus behaved like a normal ferroelectric. As the temperature was raised toward T C, the dielectric constant (K) increased for all samples due to softening of the structure and the temperature-induced phase transformation. Reference Sehirlioglu, Sayir and Dynys23 Figure 5 shows the thermal dielectric hysteresis of the T5 sample measured during heating (poled sample) and cooling (unpoled sample) at 1 kHz. Dielectric measurements using poled samples were particularly carried out to determine the depolarization temperature (T d) as well as to observe any possible low temperature phase transformations. The heating curve in Fig. 5 indicated no low-temperature phase transition. T d corresponds to a temperature (lower than T C) where the dielectric loss (tan δ) is maximum. T C and particularly T d must be considered together to fabricate temperature-stable devices without significant degradation of piezoelectric properties. Those temperatures for highly textured T5 sample were both greater than 200 °C and the difference between them was negligible (i.e., T C = 213 °C and T d = 204 °C, as given in Table I). Also, the temperatures at which tan δ was maximum during cooling and heating were just slightly different, that is, 214 °C versus 212 °C for the R samples and 198 °C versus 204 °C for the T5 sample. It is expected that tan δ would decrease in the textured samples due to a lesser number of domains and domain walls within the bigger grains. However, tan δ values increased with increasing template content for both poled (heating) and unpoled (cooling) samples (Table I). The increase in tan δ may be attributed to the increased number of insoluble BT templates within the bigger PMN–PYbN–PT matrix grains (composite effect) where more domains and domain walls were generated along the template–matrix interfaces by means of differences in polarization and strain, as explained by Zhou et al. by applying phase field modeling. Reference Zhou, Yan, Priya and Wang6 Relatively lower tan δ values in the poled samples, however, were due to aligned domains in the [001] within the bigger grains, yielding lesser domain walls. The samples had an electrically soft character due to the relatively high tan δ values measured at 25 °C. Zhou et al. Reference Zhou, Yan, Priya and Wang6 further explained that the volume fraction of the insoluble BT phase within the PMN–PT matrix determined the resulting electromechanical properties such that the higher volume fraction of templates tended to decrease the properties due to its inferior properties (e.g., relatively lower K of the BT phase Reference Messing, Sabolsky, Trolier-McKinstry, Duran, Kwon, Brahmaroutu, Park, Yilmaz, Rehrig, Eitel, Suvaci and Seabaugh1 ) and composite effect. The dielectric constant decreased with increasing volume fraction of templates as given in Table I, which is similar to the dielectric tendency modeled and measured for the BT-templated PMN–PT ceramics. Reference Zhou, Yan, Priya and Wang6
Temperature and frequency dependence of the dielectric constant measured during cooling. Dielectric loss data were taken at 1 kHz.

Temperature dependence of the dielectric properties measured during heating (poled sample) and cooling (unpoled sample) at 1 kHz for the T5 sample.

Dielectric properties of the samples measured at 1 kHz.

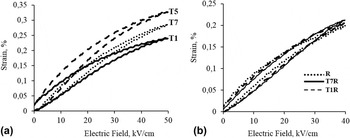
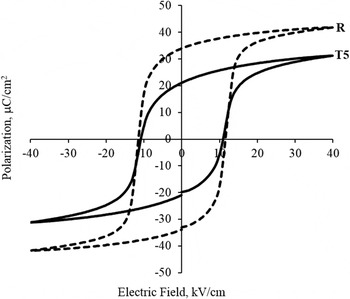
Figure 6 shows the unipolar strain–field plots for the textured and random poled samples. Maximum strains achieved at 50 kV/cm were 0.24, 0.33, and 0.29% for the T1, T5, and T7 samples, respectively [Fig. 6(a)]. The maximum piezoelectric strain coefficients (d 33) (i.e., maximum strain/maximum electric field) and hysteresis (i.e., strain difference between upper and lower curves at the half value of a maximum electric field/maximum strain) were calculated to be 480 pm/V and 12.2% for the T1 sample; 660 pm/V and 7.7% for the T5 sample; and 580 pm/V and 7.4% for the T7 sample. A smaller hysteresis is particularly important for device applications from a temperature stability point of view during operation. In addition, a low-field (<5 kV/cm) d 33 for the T5 sample was 1340 pm/V calculated from the decreasing (i.e., upper curve) slope of the unipolar strain–field curve when driven at 50 kV/cm. The higher piezoelectric properties (e.g., higher strain and d 33, and narrower hysteresis) obtained with increasing f is attributed to higher volume of pore-free and [001]-oriented single crystal regions as well as lower area of grain boundaries [Figs. 3(c) and 3(d)] along the field-application direction. However, the lower d 33 of the BT phase (e.g., 87 pC/N, Reference Chu, Xu, Li, Zeng, Yu, Luo and Yin24 140 pC/N Reference Pertsev, Zembilgotov and Waser25 ) negatively affected the resulting d 33 of the samples due to the composite effect. The random samples R, T1R, and T7R had similar strain-field behaviors with a maximum strain of 0.21% ± 0.1% and a hysteresis of 12% ± 1% [Fig. 6(b)] indicating that if template particles were randomly oriented, the resulting properties were not very different from the template-free random sample due to the averaging of the properties. These results prove that piezoelectric properties are dependent on a best amount of template particles to achieve maximum f, which subsequently results in a maximum unipolar strain, d 33, and narrower hysteresis, as observed for the T5 sample. The low hysteresis and high strain levels are particularly desired for high performance piezoelectric actuators and transducers. The T5 and R samples were further investigated for bipolar polarization–electric field (P–E) behaviors (Fig. 7). The R and T5 samples exhibited slanted P–E loops due to their tetragonal crystal structures (Fig. 2). Furthermore, well-saturated P–E hysteresis loops indicated stable domain configurations without any lossy behavior. The R and T5 samples had remnant polarization (P r) (coercive field, E c) of 34 μC/cm2 (11.5 kV/cm) and 21 μC/cm2 (11 kV/cm), respectively. The decrease in P r in the T5 sample was due to the texturing and composite effect, similar to the BT-textured PMN–PT ceramics. Reference Sabolsky, Trolier-McKinstry and Messing5,Reference Zhou, Yan, Priya and Wang6 Yan et al. Reference Yan, Zhou, Maurya, Wang and Priya26 recently reported a giant piezoelectric voltage coefficient (g 33) in 〈001〉-textured PbTiO3 ceramics using platelike PbTiO3 templates. To fully utilize the dielectric and electromechanical properties of the textured ceramics (in spite of enhanced physical properties via heteroepitaxial growth), efforts should be concentrated on synthesizing template particles having a similar composition with the matrix phase (i.e., homoepitaxy), thereby eliminating likely deleterious effects (e.g., unmatched dielectric and piezoelectric properties, mechanical clamping of domain walls, generation of domains at the template–matrix interfaces, limitation on poling efficiency and polarization rotation, etc. Reference Sabolsky, Trolier-McKinstry and Messing5,Reference Zhou, Yan, Priya and Wang6 ) of the second phase template particles embedded within the bigger textured grains.
Unipolar strain plots of (a) textured and (b) random samples.

Polarization–electric field hysteresis loops of the samples.

IV. CONCLUSIONS
The 0.62[0.75PMN–0.25PYbN]–0.38PT ternary system was successfully textured in [001] via the TGG method using 1–7 vol% platelike BT templates. The absence of exaggerated grain growth in the matrix as well as close contacts between template particles and matrix grains resulted in a texture fraction of 0.91 at 5 vol% BT template. Dielectric spectra indicated no frequency dispersion like normal ferroelectrics. Measurements of the poled samples during heating revealed a depolarization temperature of 204 °C without any low-temperature phase transition. Chemically stable BT phase within the matrix gave rise to a composite effect and its relatively inferior properties decreased dielectric constant, remnant polarization, and piezoelectric strain coefficients. The Curie temperature (T C) decreased from 226 °C to 213 °C at 5 vol% BT addition due to the lower T C of the BT. A high level of strain (0.33%), narrower hysteresis level (7.7%), higher piezoelectric strain coefficient (660 pm/V), and low-field (<5 kV/cm) piezoelectric strain coefficient (1340 pm/V) at 50 kV/cm were achieved at 5 vol% BT addition. Random samples had lower strains (0.21% ± 0.1%) and wider hysteresis levels (12% ± 1%). These results suggest that highly textured ternary compositions can be used as temperature-stable, high performance transducers and actuators without severe temperature limitations. Also, texturing opens up new opportunities for the concept of domain engineering in the ternary ceramics.
ACKNOWLEDGMENTS
This work was supported by the Ankara Yıldırım Beyazıt University (Turkey)-Scientific Research Projects [grant number 664].